Introducing Atatus MCP Server: Connect AI Agents to Your Observability Data
AI coding assistants like Claude, Cursor, Codex, GitHub Copilot have become standard tools in the modern engineering workflow. Developers use them to write code, generate tests, and review pull requests. But when something breaks in production, these assistants hit a wall: they have no access to your actual system state.
They can reason about logs, traces, and metrics. They just can't see yours.
This is the problem Atatus MCP Server solves. Using the Model Context Protocol (MCP) - an open standard for connecting AI agents to external data sources, Atatus MCP Server gives AI assistants secure, structured access to your observability platform. Instead of switching between dashboards, your AI agent can query production telemetry directly and give you answers grounded in real data.
Try Atatus MCP Server Free
Connect Claude or Cursor to your observability data in under 5 minutes.
In this article:
- What Is Atatus MCP Server?
- Why Developers Need It?
- How It Works?
- Supported AI Clients
- Authentication and Security
- Available MCP Tools
- Example Workflows
- Enterprise Features
- Monitoring MCP Usage
- Performance Optimization
- Best Practices
What Is Atatus MCP Server?
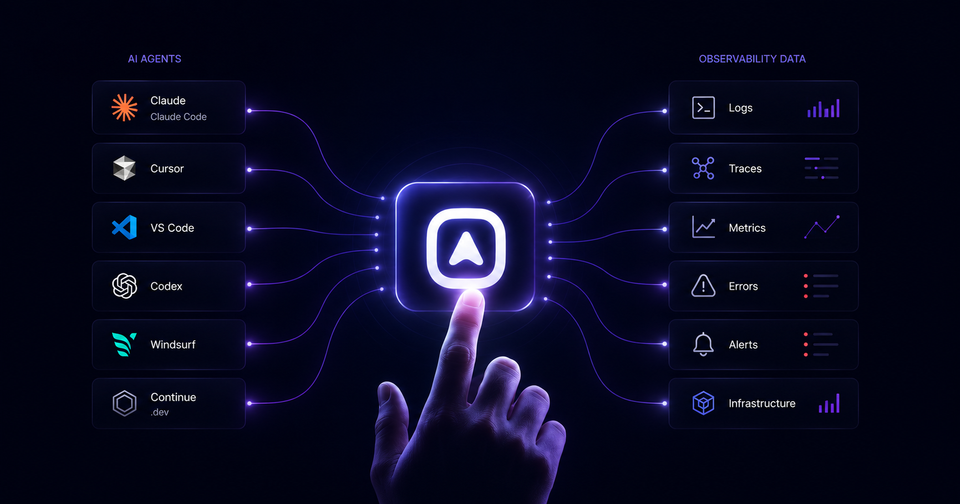
Atatus MCP Server is a remote server that implements the Model Context Protocol exposing Atatus observability data as structured tools that any MCP-compatible AI client can call.
When you connect Claude Code or Cursor to Atatus MCP Server, the AI assistant gains the ability to query your logs, search distributed traces, fetch infrastructure metrics, read active alerts, and retrieve error groups within a single conversation context, without manual navigation of the Atatus UI.
Instead of:
- Opening a browser tab
- Navigating to the right service
- Adjusting the time range
- Finding the trace
- Copying the error to your IDE
You ask your AI agent directly:
The agent calls the relevant Atatus MCP tools, synthesizes the data, and surfaces the root cause with spans, stack traces, and query context directly in your editor.
Why Developers Need It?
The biggest bottleneck in incident response is not intelligence, it is context. Your team understands distributed systems. Your AI assistant can reason about them. The gap is that AI agents have no access to what is actually happening in your production environment.
Here is what that costs in practice:
| Problem | Without Atatus MCP | With Atatus MCP Server |
|---|---|---|
| Context switching | Toggle between IDE, dashboards, and logs | Query observability data directly from your editor |
| Incident investigation | Manually correlate traces, logs, and errors | AI correlates signals automatically across all data sources |
| Onboarding | New engineers learn dashboards before they can debug | Ask questions in natural language from day one |
| Alert triage | Open Atatus, find the alert, and click through to the relevant context | "Summarize today's alerts and their status" in one prompt |
| Post-mortems | Reconstruct timelines manually across multiple tools | AI builds the incident timeline automatically from logs and trace data |
How It Works?
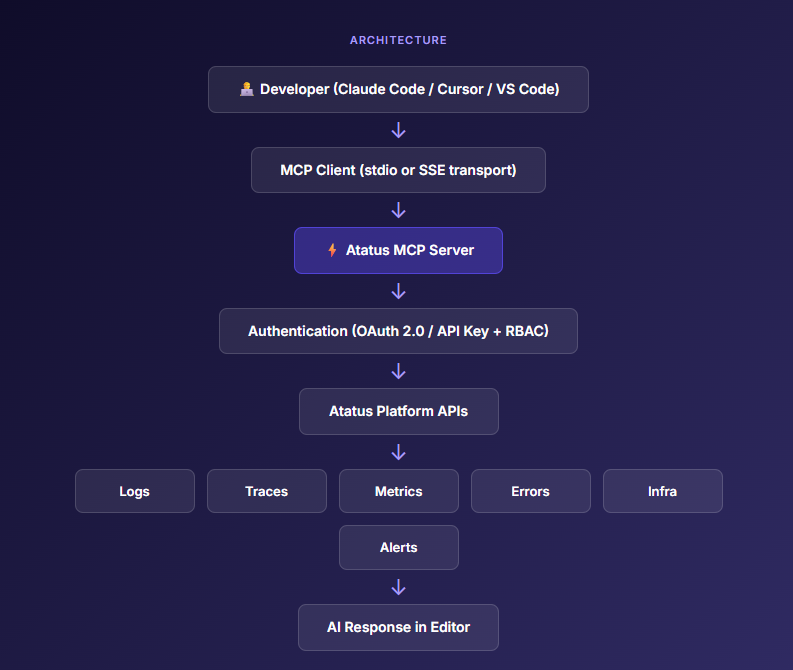
The architecture is straightforward. Your AI client communicates with Atatus MCP Server using the MCP protocol. The server authenticates the request, calls the relevant Atatus APIs, and returns structured data the AI can reason about.
Component Breakdown
- MCP Client - the AI assistant running inside Claude Code, Cursor, or VS Code. It discovers available tools by requesting the tool manifest from Atatus MCP Server and calls them as needed during a conversation.
- Atatus MCP Server - implements the MCP server specification. It handles tool routing, request validation, authentication, response formatting, and result truncation to fit AI context windows. Runs as a remote SSE endpoint for cloud deployments.
- Authentication layer - validates every request before it reaches Atatus APIs. Supports OAuth 2.0 tokens and API keys. RBAC policies determine which tools a given credential can call.
- Atatus Platform APIs - the underlying REST APIs powering the Atatus observability platform. MCP Server sits in front of them, translating natural-language tool calls into structured API requests and returning formatted responses.
Supported AI Clients
| AI Client | Connection Type | MCP Support | Notes |
|---|---|---|---|
| Claude Code | SSE / stdio | ✅ Native | Best-in-class MCP support; recommended for production. |
| Claude Desktop | stdio | ✅ Native |
Full tool calling; configure via mcp_settings.json.
|
| Cursor | SSE | ✅ Native | Add via Cursor Settings → MCP Servers. |
| OpenAI Codex | SSE | ✅ Supported | MCP tool use via Codex function-calling bridge. |
| VS Code | SSE | ✅ Extension | Requires the MCP extension from the VS Code Marketplace. |
| Windsurf | SSE | ✅ Native | Configure in the Windsurf MCP settings panel. |
| Continue.dev | stdio / SSE | ✅ Native |
Add as a context provider in config.json.
|
| Any MCP client | SSE / stdio | ✅ Compatible | Works with any client implementing the MCP specification. |
Authentication & Security
Every request to Atatus MCP Server is authenticated before it reaches your data. We support two authentication methods and enforce RBAC at the tool level.
Authentication Methods
| Method | Recommended For | Setup |
|---|---|---|
| API Key | Individual developer setups, CI/CD | Generate in Atatus → Settings → API Keys |
| OAuth 2.0 | Enterprise multi-user deployments | Configure an OAuth application in Atatus → Settings → OAuth |
RBAC & Permissions
Create dedicated service accounts for your AI agents. Assign each account only the tool categories it needs. A CI-based Codex agent checking deployment status does not need access to raw log search.
| Role | Tool Access | Use Case |
|---|---|---|
| Read-only Viewer | All read tools, no mutations | Developer debugging in IDE |
| APM Reader | Traces, errors, and APM metrics only | Backend service teams |
| Infra Reader | Infrastructure, Kubernetes, and host metrics | Platform engineering teams |
| Incident Responder | Alerts, incidents, logs, and traces | On-call SRE workflows |
| Full Read Access | All available tools | Engineering managers and staff engineers |
Available MCP Tools
Atatus MCP Server exposes tools across seven capability domains. Each tool accepts structured parameters and returns formatted data sized for AI context windows.
Logs
| Tool | Description | Example Prompt |
|---|---|---|
| search_logs | Full-text search across log streams with optional service, severity, and time filters. | "Search logs for 'connection refused' in the payments service in the last 30 minutes." |
| get_log_patterns | Cluster log messages by pattern to automatically surface recurring errors. | "What are the most common error patterns in the auth service today?" |
| get_log_volume | Return log volume over a time range, optionally grouped by service or severity. | "Show me the error log volume for the API gateway over the last 6 hours." |
| tail_logs | Return the most recent log lines for a given service or query. | "Show me the last 50 log lines from the order-service." |
APM & Distributed Tracing
| Tool | Description | Example Prompt |
|---|---|---|
| get_slow_traces | Return the slowest traces for a service and time window, including span breakdown. | "Find the slowest checkout API traces from the last hour." |
| get_trace_detail | Fetch a complete trace with spans, service graph, and timing for a specific trace ID. | "Show me the full trace for trace ID abc123." |
| get_endpoint_metrics | Return P50, P95, P99 latency, request rate, and error rate for an endpoint. | "What is the P99 latency for POST /api/v2/orders over the last 24 hours?" |
| find_slow_db_queries | List the slowest database queries observed during a selected time window. | "Find slow database queries in the last hour." |
| compare_deployments | Compare APM metrics before and after a deployment event. | "Compare API performance before and after the 3 PM deployment." |
Infrastructure
| Tool | Description | Example Prompt |
|---|---|---|
| get_host_metrics | Retrieve CPU, memory, disk I/O, and network metrics for a specific host. | "Show CPU and memory usage for the db-prod-01 host." |
| get_kubernetes_pods | List Kubernetes pods with status, restart count, and resource usage. | "Which pods are restarting frequently in the payments namespace?" |
| get_container_metrics | Return container-level CPU, memory, and network usage metrics. | "Show me memory usage for the api-gateway containers." |
| list_services | Return all monitored services with their current health status. | "List all services and their current health status." |
Errors
| Tool | Description | Example Prompt |
|---|---|---|
| get_error_groups | Return grouped errors by type and frequency for a specific service. | "List the top errors in the order service from the last hour." |
| get_error_detail | Fetch the full stack trace, affected user count, and first/last seen timestamps for an error group. | "Show me the stack trace and impact of error group #4892." |
| get_error_trend | View error rate trends over time with deployment correlation. | "Did error rates increase after today's deployment?" |
Alerts & Incidents
| Tool | Description | Example Prompt |
|---|---|---|
| get_active_alerts | List all currently firing alerts with their severity and triggering metric. | "What alerts are currently firing?" |
| get_alert_history | Retrieve historical alert events for a specified time window. | "Show me all alerts that fired today." |
| get_incidents | Return recent incidents with their timeline and current status. | "Summarize all incidents from today." |
| get_incident_timeline | Retrieve the complete event timeline for a specific incident. | "Walk me through what happened during incident INC-442." |
Dashboards
| Tool | Description | Example Prompt |
|---|---|---|
| list_dashboards | List available dashboards by name and tag. | "What dashboards do we have for the payments team?" |
| get_dashboard_summary | Return current widget values and key metrics from a dashboard. | "Summarize the current state of the production overview dashboard." |
Example Workflows
These workflows represent real scenarios where Atatus MCP Server reduces mean-time-to-resolution by giving your AI agent the production context it needs.
Workflow 01 · Deployment Regression
"Why did latency spike after the 3pm deployment?"
The agent calls compare_deployments to diff APM metrics before/after, then get_slow_traces to find affected endpoints, then find_slow_db_queries to pinpoint the root cause — often a missing index or an N+1 query introduced in the release.
Workflow 02 · Error Rate Triage
"Which services have the highest error rate right now?"
The agent calls list_services for health status, then get_error_groups on each affected service to surface the specific exceptions, their frequency, and first occurrence time relative to recent deploys.
Workflow 03 · Incident Summary
"Summarize all incidents from today with current status."
The agent calls get_incidents for the day's incident list, then get_incident_timeline on each open incident to build a structured summary with contributing signals, affected services, and resolution status.
Workflow 04 · Kubernetes Pod Health
"Which pods are restarting frequently and why?"
The agent calls get_kubernetes_pods to list restart counts, then get_container_metrics on affected pods to check for OOM conditions, then search_logs to find the exact error messages triggering the restarts.
Workflow 05 · Database Performance
"Find slow database queries affecting the order service."
The agent calls find_slow_db_queries filtered to the order service, retrieves the full query text and execution plans, then correlates with get_slow_traces to identify which API endpoints trigger them.
Workflow 06 · On-Call Handoff
"Give me a status report of the last 8 hours to prepare for handoff."
The agent compiles a structured report: active alerts, resolved incidents, top error groups, services with degraded P99 latency, and any anomalous infrastructure metrics in a format ready to paste into a Slack message or runbook.
Enterprise Features
Atatus MCP Server is designed for production engineering teams with compliance, auditability, and multi-tenant requirements.
| Feature | Description |
|---|---|
| Audit Logging | Every tool call is logged with the authenticated identity, tool name, parameters, and response status. Logs are retained according to your data retention policy. |
| RBAC Enforcement | Enforce tool-level permissions by allowing or denying individual tools or entire categories for each service account. |
| Multi-tenant Isolation | All requests are scoped to the authenticated account, preventing cross-tenant data access. |
| Encrypted Transport | All MCP connections use TLS 1.2 or later. Plaintext transport is never permitted. |
| Read-only Design | MCP tools provide read-only access. AI agents can observe data but cannot modify any Atatus resources. |
| Session Tracking | Each MCP session is assigned a unique ID, with session metadata available for auditing and security reviews. |
| IP Allowlisting | Restrict MCP Server access to approved IP ranges or VPN egress IP addresses for additional security. |
Monitoring MCP Usage
An AI layer that calls your observability APIs at scale is itself a system worth monitoring. Atatus emits telemetry on MCP Server activity so you can observe how your AI agents are using production data.
| Metric | Description | Alert When |
|---|---|---|
| mcp.tool.calls | Total tool invocations grouped by tool name and authenticated identity. | Unexpected spike in tool call volume. |
| mcp.session.count | Tracks active and historical MCP sessions. | Unusual increase in session creation rate. |
| mcp.response.latency | Measures tool response latency (P50, P95, and P99). | P99 latency exceeds 5 seconds for critical tools. |
| mcp.auth.failures | Authentication failures grouped by credential or identity. | Any sustained authentication failure rate. |
| mcp.errors | Counts tool-level error responses. | Error rate exceeds 5%. |
| mcp.tokens.consumed | Approximate context tokens returned per MCP session. | Token usage approaches model context limits. |
Performance Optimization
AI context windows are finite. Returning 10MB of raw logs to an LLM is counterproductive. Atatus MCP Server is designed to return exactly what the agent needs, nothing more.
- Response truncation - all log and trace responses are capped at configurable limits (default: 100 log lines, 50 spans) to prevent context window overflow.
- Pagination - tools that return large datasets support cursor-based pagination so agents can request additional pages if needed.
- Intelligent field selection - responses include only the fields most relevant to the query type. Raw log objects are stripped to essential fields (timestamp, level, message, service, trace ID).
- Server-side filtering - filtering happens at the API level, not in the AI layer. Time ranges, service filters, and severity filters reduce data before it enters the context window.
- Result caching - repeated identical queries within a session window are served from cache, reducing API load and improving response time.
- Rate limiting - per-credential rate limits prevent AI agents from inadvertently overwhelming the Atatus API tier during recursive investigation loops.
Best Practices
Credential Management
- Create one service account per AI agent type (IDE agent, CI agent, on-call bot). Never share credentials across agents.
- Assign the minimum tool permissions required. An IDE debugging agent rarely needs alert management tools.
- Rotate API keys on a 90-day schedule. Store them in environment variables or secrets managers, never in dotfiles committed to version control.
Observability Data Hygiene
- Use consistent service naming across your stack. An AI agent correlating logs to traces to metrics relies on service names matching across all three data sources.
- Tag your deployments in Atatus. The
compare_deploymentstool is most useful when deployment events are accurately tracked. - Ensure your OpenTelemetry instrumentation is complete. Sparse tracing coverage limits the AI agent's ability to identify root causes across service boundaries.
Prompt Engineering
- Specify time ranges explicitly: "in the last 30 minutes" is more useful than "recently."
- Name specific services when you know them: "in the payments service" focuses the tool call and returns more relevant results.
- Break complex investigations into steps: first identify affected services, then drill into specific errors, then find root causes in traces.
- Ask for comparisons: "compare before and after deployment X" triggers the
compare_deploymentstool which is purpose-built for regression detection.
Ready to Connect Your AI Agent to Atatus?
Full platform access. No credit card. Cancel any time.
Frequently Asked Questions
1) How is it different from calling the Atatus API directly?
Direct API calls require custom integration code for every AI tool you use. MCP is a universal protocol: any MCP-compatible client connects to Atatus MCP Server without bespoke glue code. The server also handles context optimization, response truncation, and token-efficient formatting automatically, things you would need to build yourself with raw API access.
2) Which AI clients are supported?
Claude Code, Claude Desktop, Cursor, OpenAI Codex, VS Code (with the MCP extension), Windsurf, Continue.dev, and any other client that implements the MCP specification. If a client supports MCP, it supports Atatus MCP Server.
3) Is Atatus MCP Server secure for production use?
Yes. Every request is authenticated via OAuth 2.0 or API key before reaching Atatus APIs. RBAC limits which tools a given credential can call. All connections use TLS. The server is read-only by design, no tool can modify Atatus data. Full audit logs are maintained for every tool call.
4) Can multiple developers use Atatus MCP Server simultaneously?
Yes. Atatus MCP Server is multi-tenant and designed for concurrent access. Each developer or agent maintains an independent authenticated session. Sessions are isolated and audited separately.
5) How is MCP usage monitored?
Atatus emits telemetry on MCP tool calls, session counts, response latency, authentication failures, and token consumption. You can build Atatus dashboards on top of this data and set alerts on unusual activity patterns.
6) What Atatus products are accessible via MCP?
APM (traces, endpoint metrics), Logs, Infrastructure Monitoring (hosts, Kubernetes, containers), Error Tracking, Alerts, Dashboards, Synthetic Monitoring status, and Incidents. Coverage expands as we add new tools.
7) How do I get started?
Start a free 14-day Atatus trial. Once your account is active, navigate to Settings → API Keys, generate a new key, and add the MCP server configuration to your preferred AI client. Check full setup documentation
Conclusion
AI coding assistants are no longer just code-generation tools, they are becoming the primary interface through which engineers interact with their systems. The missing piece has always been production context.
Atatus MCP Server closes that gap. With a single configuration block in your AI client, Claude, Cursor, or VS Code gain access to your full observability stack such as logs, metrics, distributed traces, errors, infrastructure, alerts, and incidents through a secure, read-only, enterprise-grade interface.
Your team stops switching tabs to investigate incidents. Your on-call engineers get answers faster. Your AI agents finally have the context they need to be genuinely useful in production.
Get Started
Connect your preferred AI assistant to Atatus in under 5 minutes.
#1 Solution for Logs, Traces & Metrics
![]() APM
APM
![]() Kubernetes
Kubernetes
![]() Logs
Logs
![]() Synthetics
Synthetics
![]() RUM
RUM
![]() Serverless
Serverless
![]() Security
Security
![]() More
More

![New Relic vs Splunk - In-depth Comparison [2026]](/blog/content/images/size/w960/2024/10/Datadog-vs-sentry--19-.png)
![New Relic vs Sentry - Which Monitoring Tool to Choose? [2026]](/blog/content/images/size/w960/2024/10/VS--1-.png)