I/O Wait Time: A Guide to Improving Linux Performance
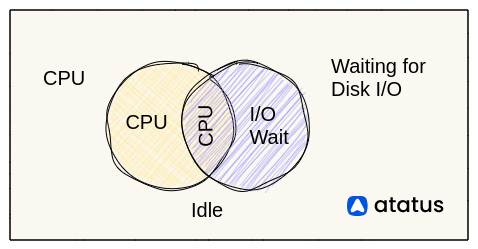
I/O wait is a plaguing issue in Linux. Speaking in layman terms, I/O wait is the time taken by the processor (here, CPU) to complete an input service request.
Ideally, our CPU doesn't seem to do any work when it is processing one input request at a time, thus the duration between your input and the output provided by the system can be treated as the I/O wait time.
The problem with this seemingly harmless issue is that overtime, this drains our kernel and bogs down our CPU thus resulting in poor performance.
Let’s learn what is I/O wait, the reasons for having such high I/O wait time and the solutions of fixing them in this article.
Let's look at the following:
- What is I/O wait in Linux?
- Understanding CPU usage in Linux
- Causes of high I/O wait time
- Assessing high I/O wait in Linux
- Fixing the high I/O wait problem
- Monitor IO wait time using Atatus
What is I/O wait in Linux?
I/O wait is the term used to describe a state in which a computer's Central Processing Unit (CPU) is idle, waiting for input/output (I/O) operations to complete.
When a computer is in I/O wait, it is not performing any computational tasks and is instead waiting for data to be read from or written to a storage device, such as a hard drive or networked file system.
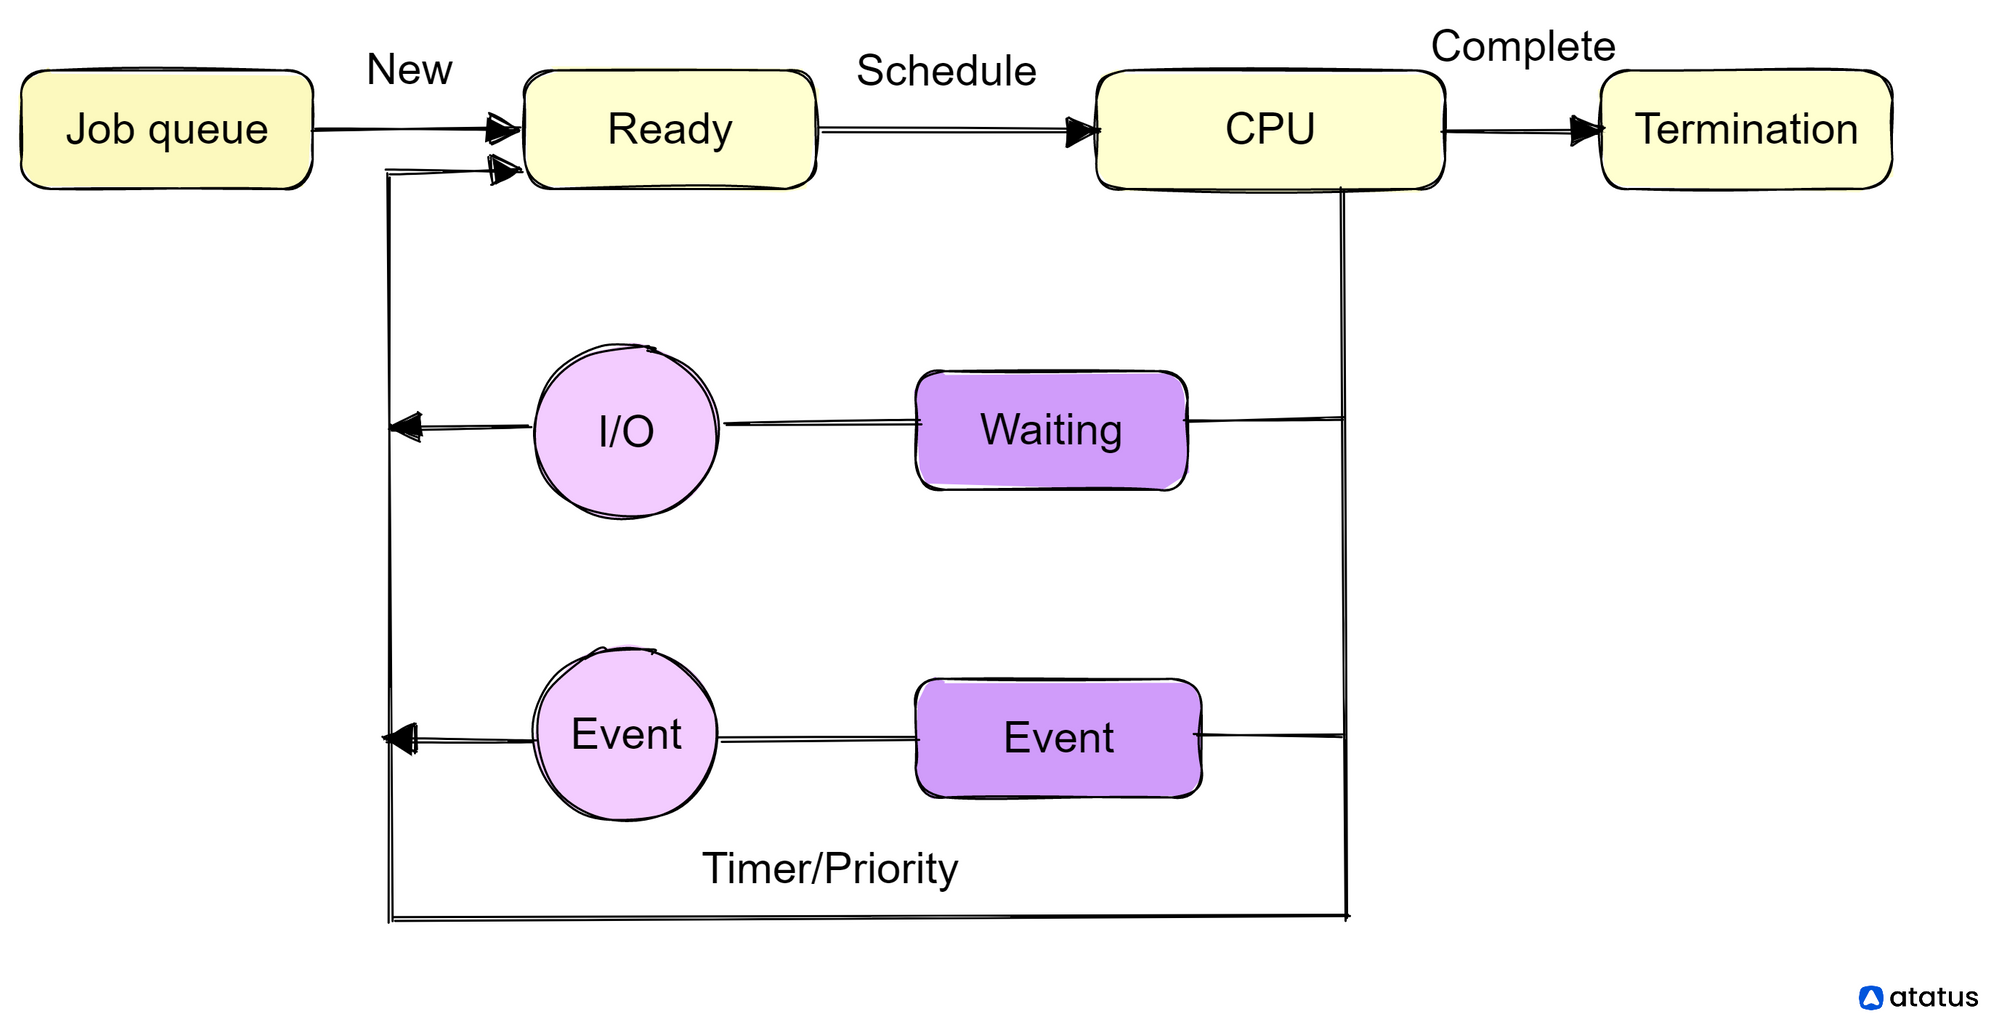
Normally, a CPU can exist in four states:
- Running - When the CPU is performing tasks actively
- Waiting - When the CPU is waiting for new instructions or waiting for a certain input request to be completed
- Idle - When the CPU currently has no work to do and is waiting to be assigned some new task.
- Stuck - As in upon encountering an error or when it is unable to complete a task and is in an infinite loop.
Usually, when the CPU is assigned a task which requires an I/O transaction, the CPU passes on a request to the I/O controller. Then this I/O controller takes up this task and serves the request.
This wait time between an input and a processed output is called the I/O wait time. It is the time taken by the I/O controller to process the request.
If you have a CPU with multiple cores, finding exactly where this I/O wait is occurring becomes difficult.
Because there are chances that a task fails in one of the cores, it gets transferred to the following core and again takes up some wait time before producing an output.
So the final I/O wait time you see is a lot more than what is expected, giving a false impression.
Example of IO wait time in Linux
An example of I/O wait in a Linux system might involve a process that is waiting for data to be transferred over a network connection. For instance:
- A process is running on a Linux server and needs to retrieve data from a database that is hosted on a remote server.
- The process sends a request for the data over the network connection.
- The remote server is busy with other tasks and is unable to immediately fulfill the request.
- The process on the Linux server is put into an I/O wait state while it waits for the data to be transferred.
- Once the data is available, it is transferred over the network connection and received by the Linux server.
- The process on the Linux server can now continue executing.
Understanding CPU usage in Linux
Understanding usage is very important when faced with CPU IO wait situations. Some common ways to view and monitor CPU usage in Linux include:
- The
topcommand: This command allows users to view a list of running processes sorted by CPU and memory usage. It also displays information such as the process ID, the user who owns the process, and the command line used to start the process. - The
pscommand: This command allows users to view information about running processes, including the CPU usage and elapsed time. - The
vmstatcommand: This command displays information about system memory, CPU, and I/O activity. It can be used to view real-time CPU usage statistics. - The
mpstatcommand: This command displays real-time CPU usage statistics for each CPU core on a system.
To view overall CPU usage for the system, you can use the top or vmstat commands. To view CPU usage for a specific process, you can use the ps or top commands, and specify the process ID of the process you want to view. To view CPU usage for individual CPU cores, you can use the mpstat command.
Also, based on the % of I/O wait, we can decide the need to switch to a new kernel or an additional CPU storage. The percentage demarcations for I/O wait and their relevant observations are given below:
- 0-4% – There is no activity in the kernel.
- 5-10% – The kernel is starting to work, but it's not under a significant workload.
- 11-20% – Kernel is working hard and becoming sluggish. This is where you might start to see some performance issues.
- 21-100% - The kernel is under heavy load and is unable to handle all requests. This is where you will see the biggest performance issues.
Causes of high I/O wait time
I/O wait can have a significant impact on a computer's performance, as it means that the CPU is not being fully utilized.
High levels of I/O wait can indicate that the computer's I/O subsystem is a bottleneck and that the CPU is not being kept busy enough.
To improve performance in such cases, it may be necessary to optimize the I/O subsystem or to add more CPU resources.
There are several reasons why a computer's CPU may be in I/O wait:
- Disk I/O: If the computer is reading from or writing to a storage device, such as a hard drive or SSD, it will be in I/O wait while it waits for the data to be transferred.
- Network I/O: If the computer is waiting for data to be transferred over a network connection, it will be in I/O wait.
- Other I/O operations: A computer may also be in I/O wait while waiting for other I/O operations to complete, such as reading from or writing to a USB device or printer.
- Insufficient CPU resources: If the CPU is not able to keep up with the demand for computational tasks, it may spend a significant amount of time in I/O wait.
- Slow I/O subsystem: If the computer's I/O subsystem is slow or overloaded, it may take longer for I/O operations to complete, resulting in higher levels of I/O wait.
High I/O wait on specific CPU cores can occur when the CPU is waiting for input/output operations to be completed.
This can occur when a system is reading or writing data to a storage device, or when it is communicating with a network or external device.
High levels of I/O wait on specific CPU cores can indicate that the system is experiencing a hurdle in its I/O operations, which can slow down overall performance.
There are several potential causes of high I/O wait on specific CPU cores, including:
- Slow or congested network connections
- Outdated hardware, such as slow hard drives or insufficient RAM
- Heavy workloads that are causing the system to constantly read and write data
- Poorly optimized software or operating system configurations
To address high I/O wait on specific CPU cores, it may be necessary to upgrade hardware, optimize software and operating system configurations, or distribute workloads more evenly across the system.
Assessing high I/O wait in Linux
i.) Using top command
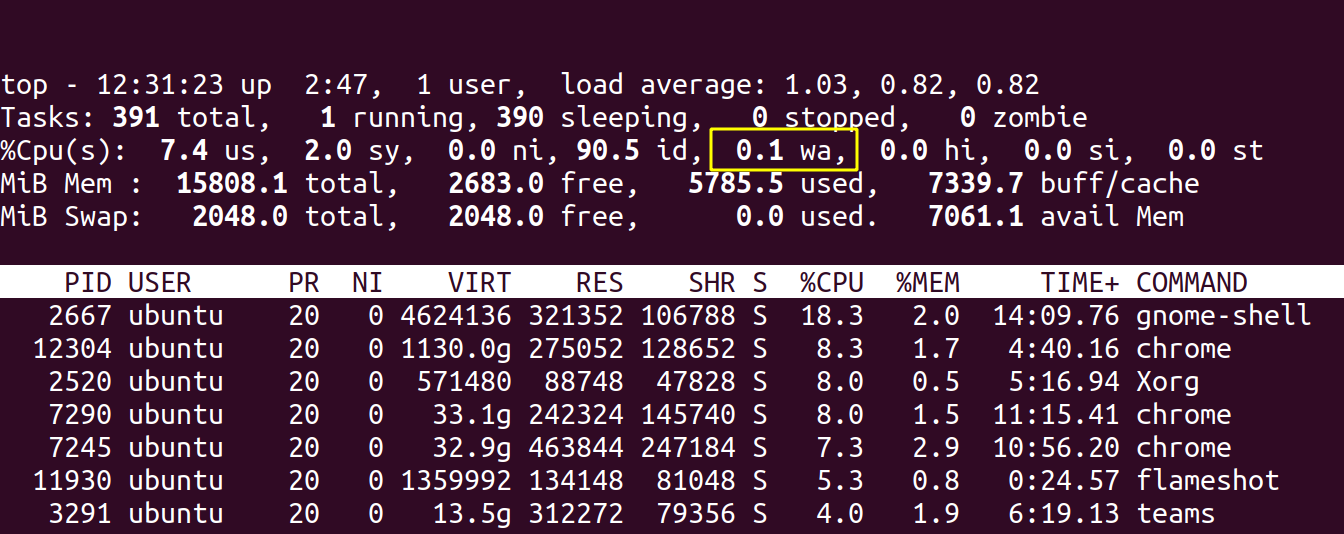
The top command is a Linux utility that allows you to monitor system performance in real time.
You can use it to view the CPU utilization, including the percentage of time that the CPU is spending waiting for I/O operations to complete (i.e., I/O wait time).
To view the I/O wait time using the command top, follow these steps:
- Open a terminal and type
top. This will display a real-time view of your system's performance, with the most CPU-intensive processes listed at the top. - Press the I key to sort the processes by I/O wait time. This will cause the processes with the highest I/O wait time to be listed at the top of the top output.
- Press Q to quit top when you are finished.
You can also use the -i flag to display I/O wait time in the top output. For example:
top -iThis will display the I/O wait time as a percentage of the total CPU time. You can press the I key to toggle the display of I/O wait time on and off.
ii.) Using vmstat command
vmstat in Linux allows you to monitor system performance and resource utilization. You can use it to view the I/O wait time for your system.
To view the I/O wait time using vmstat, follow these steps:
- Open a terminal and type
vmstat. This will display real-time statistics for your system, including the I/O wait time. - Press CTRL+C to stop the
vmstatoutput.
You can also specify the number of seconds between updates and the number of updates to display.
For example, to display updates every 5 seconds for a total of 3 updates, you can use the following command:
vmstat 5 3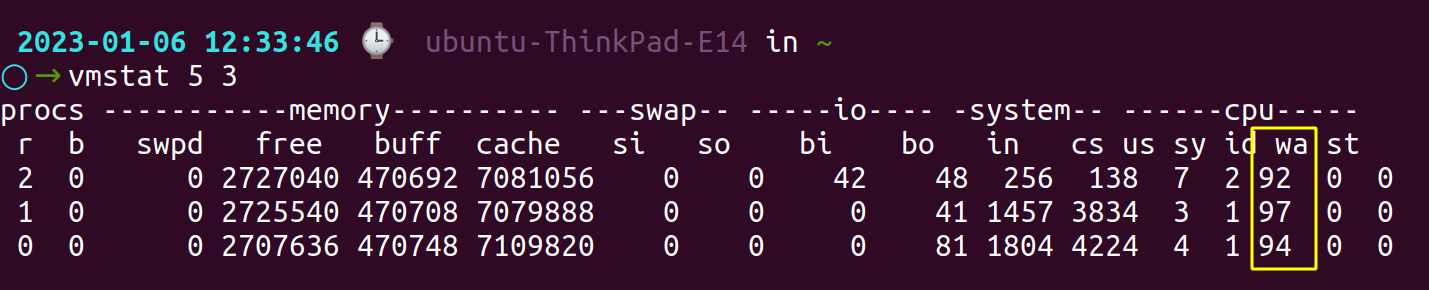
This will display the I/O wait time as a percentage of the total CPU time.
iii.) Discover processes causing high I/O wait using iotop
The iotop is a Linux command that allows you to monitor I/O usage in real time. It is similar to top, but it displays information about I/O usage instead of CPU usage. You can use iotop to view the I/O wait time for each process.
To use iotop, follow these steps:
- Open a terminal and type
sudo iotop. This will display a real-time view of I/O usage, with the most I/O-intensive processes listed at the top. - Press the F key and then the W key to save the current display settings to a configuration file. This will allow you to view the I/O wait time every time you run iotop.
- Press Q to quit iotop when you are finished.
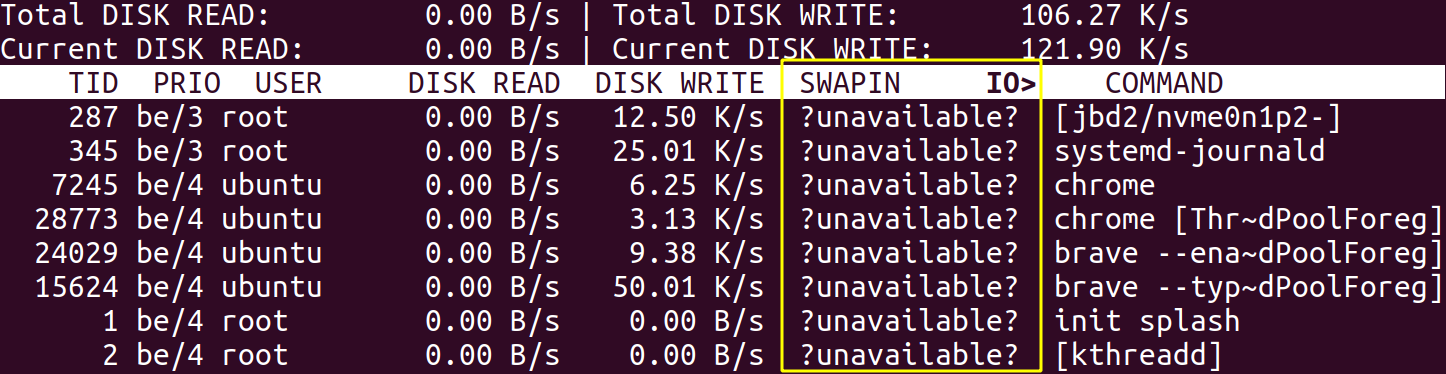
Here SWAPIN and IO shows the percentage of time spent by processes or threads while swapping in and waiting on IO operations respectively.
You can also use the --only flag to display only the processes that are currently performing I/O operations. For example:
sudo iotop --onlyThis will display a list of processes that are currently performing I/O operations, along with their I/O wait time.
Some common options for the iotop command include:
-o: displays only processes that are actively using I/O
-b: runs iotop in batch mode, allowing it to be used in scripts
-d: sets the refresh interval for the display
-p: specifies a specific process to monitor
For example, to view a list of all processes using I/O in real-time, you can use the command iotop -o. To monitor the I/O usage of a specific process, you can use the command iotop -p [pid], where [pid] is the process ID of the process you want to monitor.
iv.) Find out which disks are being written to with iostat
The iostat command allows you to monitor disk I/O activity and disk utilization. You can use it to view the I/O wait time for your disks.
To view the I/O wait time for all disks using iostat, follow these steps:
- Open a terminal and type
iostat. This will display real-time statistics for all disks, including the I/O wait time. - Press CTRL+C to stop the
iostatoutput.
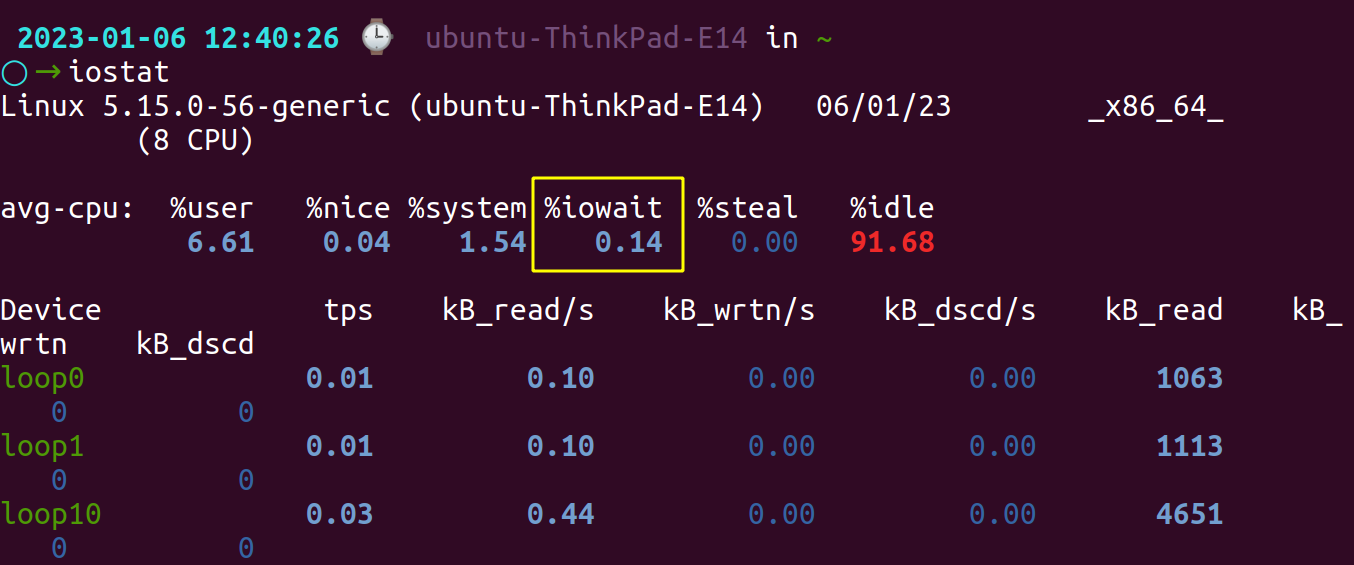
You can also use the -x flag to display extended statistics, including the I/O wait time. For example:
iostat -xThis will display the I/O wait time as a percentage of the total CPU time.
You can also specify a particular disk or disks to monitor. For example, to monitor sda, you can use the following command:
iostat -x sdaSome common options for the iostat command include:
-x: displays extended statistics, including I/O service time and I/O utilization
-d: displays statistics for individual devices
-c: displays CPU utilization statistics
-p: displays statistics for a specific disk or file system
For example, to view I/O statistics for all disks and file systems on a system, you can use the command iostat -x. To view statistics for a specific device, you can use the command iostat -xd [device], where [device] is the name of the device you want to view. To view CPU utilization statistics, you can use the command iostat -xc.
Fixing the high I/O wait problem
There are several possible ways to fix high I/O wait time in Linux, depending on the cause of the problem. Here are a few general strategies you can try:
- Identify the cause of the high I/O wait time: Use
top,iotop, or other system monitoring tools to determine which processes or disks are responsible for the high I/O wait time. This will help you to focus your efforts on the right areas. - Check for disk errors: Use the
fsckcommand to check for and fix any errors on your disks. High I/O wait time can sometimes be caused by faulty disks or disk controllers. - Tune your I/O scheduler: Linux uses an I/O scheduler to optimize disk performance. You can try changing the I/O scheduler to see if it improves performance. To do this, you can use the elevator kernel parameter.
- Increase the number of I/O requests that can be handled simultaneously: You can try increasing the size of the I/O request queue to allow more I/O requests to be handled at the same time. You can do this using the
nr_requestskernel parameter. - Optimize your disk layout: You can try optimizing the layout of your disk partitions to improve I/O performance. For example, you can try placing frequently accessed files on faster disks or near the beginning of the disk.
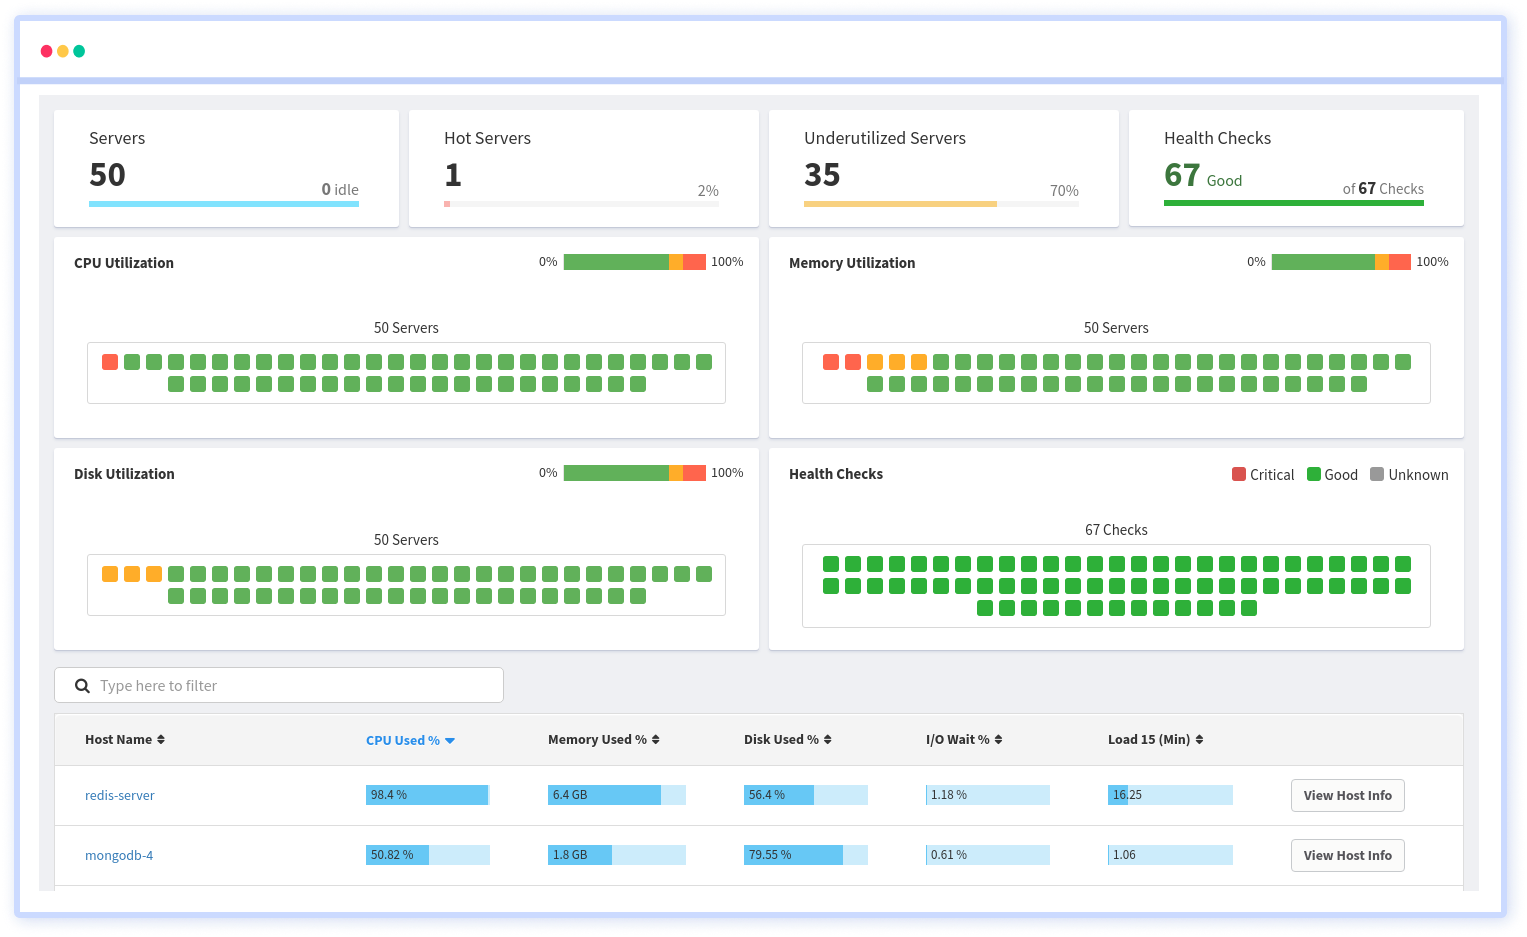
Monitor IO wait time using Atatus
To monitor IO wait time using Atatus Infrastructure Monitoring, you can do the following:
- Sign up Atatus and install the Atatus agent on your servers.
- Atatus allows you to track key metrics for your servers, CPU, processes, host etc., including IO wait time.
- Set up alerts to notify you if IO wait time exceeds a certain threshold. You can set up alerts in Atatus to send notifications via email, Slack, or VictorOps and much more.
- Monitor IO wait time over time using Atatus' dashboard. You can view IO wait time trends and see how they relate to other metrics, such as CPU and memory usage.
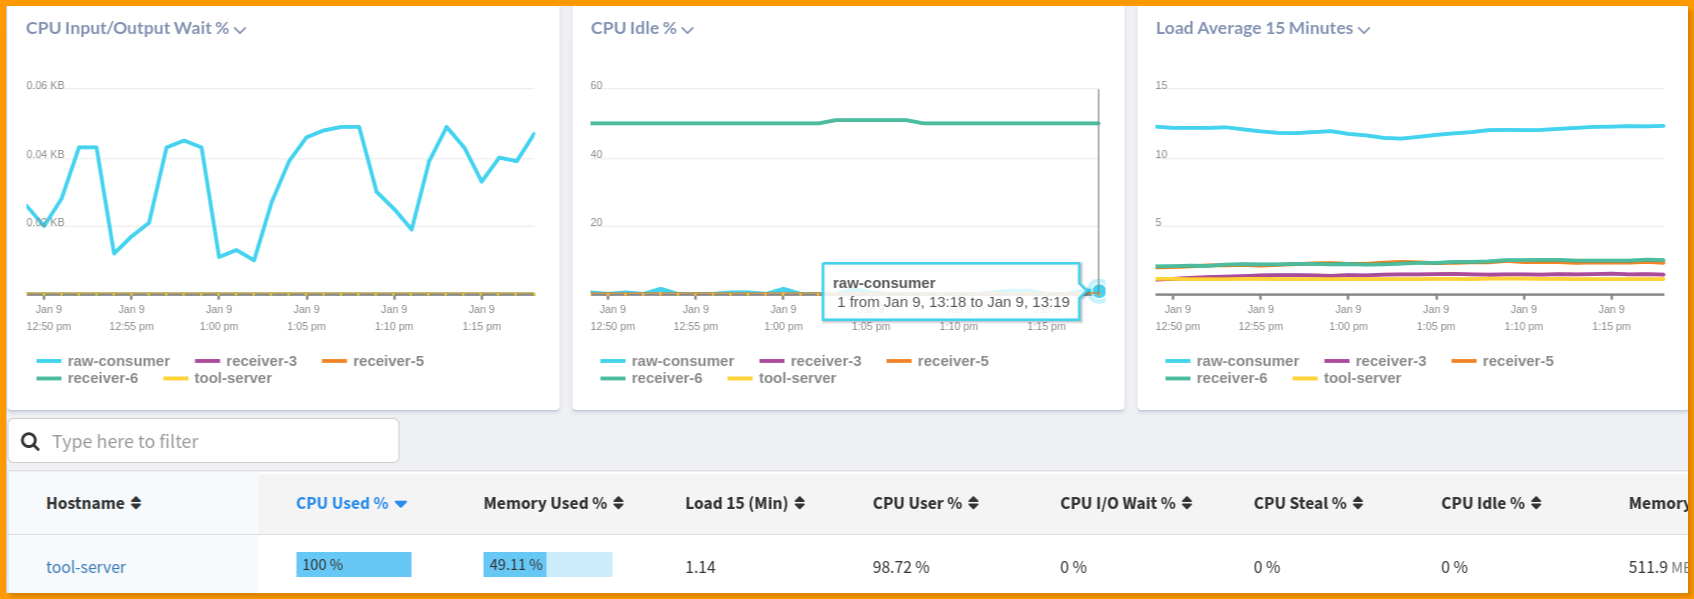
By monitoring IO wait time using Atatus Infrastructure Monitoring, you can identify and address issues that may be impacting the performance of your application.
Conclusion
We have now read completely about what I/O wait is and how to diagnose it when the wait time increases.
Using Linux commands like top and vmstat can help with assessing high I/O wait time, while iotop can identify the processes causing this lag and subsequently check with iostat command to find out which disks are increasing this wait time.
Following the solutions that we’ve provided for fixing the I/O wait might help you a great deal to keep your system healthy and running for a longer time.
Infrastructure Monitoring with Atatus
Track the availability of the servers, hosts, virtual machines and containers with the help of Atatus Infrastructure Monitoring. It allows you to monitor, quickly pinpoint and fix the issues of your entire infrastructure.
In order to ensure that your infrastructure is running smoothly and efficiently, it is important to monitor it regularly. By doing so, you can identify and resolve issues before they cause downtime or impact your business.
It is possible to determine the host, container, or other backend component that failed or experienced latency during an incident by using an infrastructure monitoring tool. In the event of an outage, engineers can identify which hosts or containers caused the problem. As a result, support tickets can be resolved more quickly and problems can be addressed more efficiently.
Start your free trial with Atatus. No credit card required.
#1 Solution for Logs, Traces & Metrics
![]() APM
APM
![]() Kubernetes
Kubernetes
![]() Logs
Logs
![]() Synthetics
Synthetics
![]() RUM
RUM
![]() Serverless
Serverless
![]() Security
Security
![]() More
More