11 Java Debugging Tips for Developers with Eclipse
Debugging your code is one of every developer's worst nightmares. Debugging Java code is a difficult task. It is the process of detecting and fixing bugs or errors in code, projects, or applications.
For any Java developer, debugging is a must-have ability. The ability to debug a Java program allows you to uncover any subtle bugs that aren't obvious during code review or appear when a specific situation occurs.
This article offers some tips for debugging Java code. We'll use the Eclipse IDE's GUI to illustrate some frequent run-time difficulties. Other IDEs, such as IntelliJ, are also available, and both offer excellent Java debugging support.
We will go over the following:
- Breakpoints
- Watchpoint
- Step Filtering
- Logical Structure
- Variables View
- Inspect and Watch
- Drop to Frame
- Step into Selection
- Human Readable Objects
- Stop in Main
- Step Into, Over, and Return
#1 Breakpoints
The Breakpoint is crucial, and you probably already know how to use it.
Breakpoints are created by double-clicking on the left side of a line of code, in case you're unfamiliar with them. Your application's execution will then come to a halt at that time, allowing you to examine the state and, hopefully, identify the source of your misbehaving code.
Conditional Breakpoint
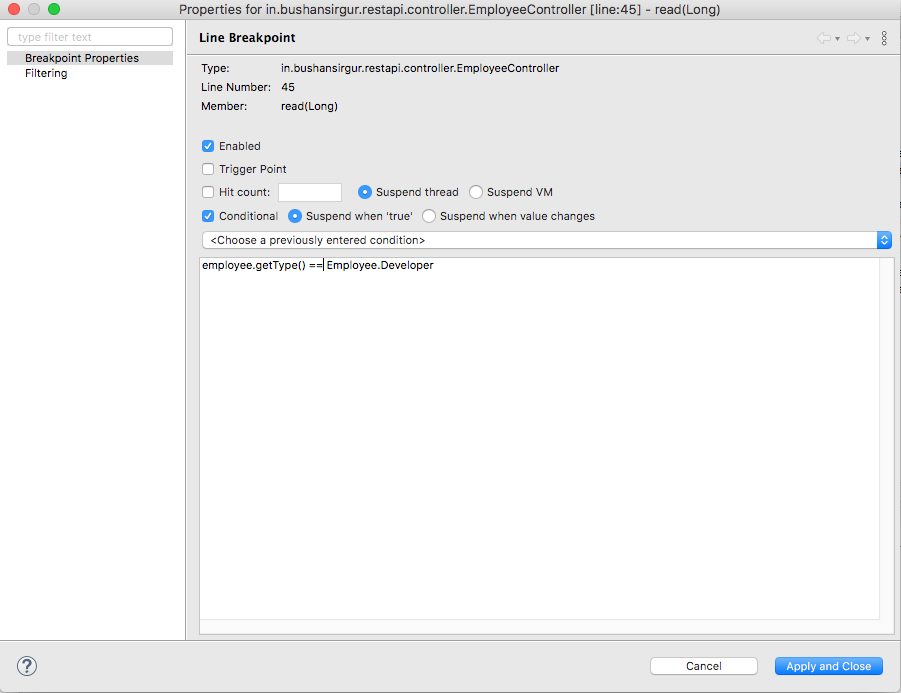
Eclipse allows you to set up a conditional breakpoint for debugging Java programs, which is a breakpoint with a condition. Your thread will only stop at the specified line if the condition matches, rather than merely halting on that line like a line breakpoint.
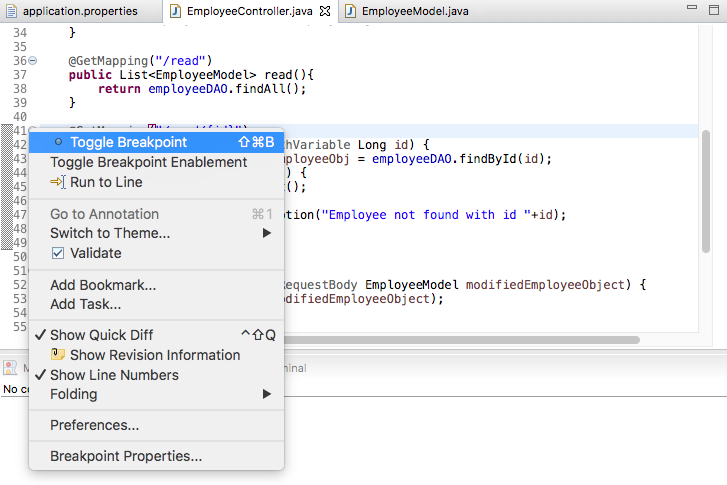
To create a breakpoint, right click on the exact line you wish to break and click on "Toggle Breakpoint" to apply. To create a conditional breakpoint, right click on the line where you have applied breakpoint --> select properties and insert the condition. Now, when that condition is true and the application is in debug mode, the program will only stop.
Exception Breakpoint
How many times have you been frustrated by a NullPointerException and had no idea where the problem originated?

Exception breakpoints are specifically designed for situations like this. Exception breakpoints are available in both Eclipse and Netbeans. Exception breakpoints can be created depending on java exceptions such as NullPointerException and ArrayIndexOutOfBoundException.
When you start your program in debug mode and an exception occurs, you can set an exception breakpoint from the breakpoint window, and your program will stop.
Different debuggers have different implementations of their debugging control algorithms that can add a condition to the breakpoint, allowing the code to be stopped or paused conditionally at a specific step. Some allow you to change data before restarting the process.
#2 Watchpoint
A breakpoint on a field or variable is called a watchpoint. It is the Eclipse IDE's best feature. When the targeted field or variable is accessed or updated, the program's execution is halted, and you can debug.
When a certain attribute is accessed or modified, the program will halt and provide debugging. Select Toggle Watchpoint from the context menu of a class variable in Outline view. This will create a watchpoint that attributes to the list of watchpoints in the Breakpoints view.
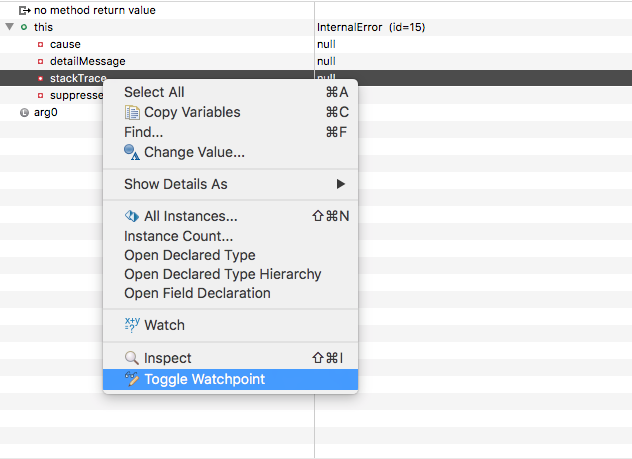
The steps below will help in creating a watchpoint:
- Double-click the left margin (just next to the field declaration).
- Configure the watchpoint's properties. Each time the attribute is read, updated, or both, the program will come to a halt.
- The Watchpoint will appear in the Breakpoints view once you have successfully set it up.
#3 Step Filtering
When you use "Step Into" during the debugging process, the control of the program can sometimes shift from one class to another, and you can end yourself in external libraries or JDK classes like System or String.
Step filtering is used if you do not want to use the JDK classes or other libraries. It will assist you in removing JDK classes from "Step Into". This feature will assist you in debugging by allowing you to skip certain packages.
Step filtering is simple to set up using the steps below:
- Go to Windows
- Click on Preferences
- Click on Java
- Select Debug
- Choose Step Filtering
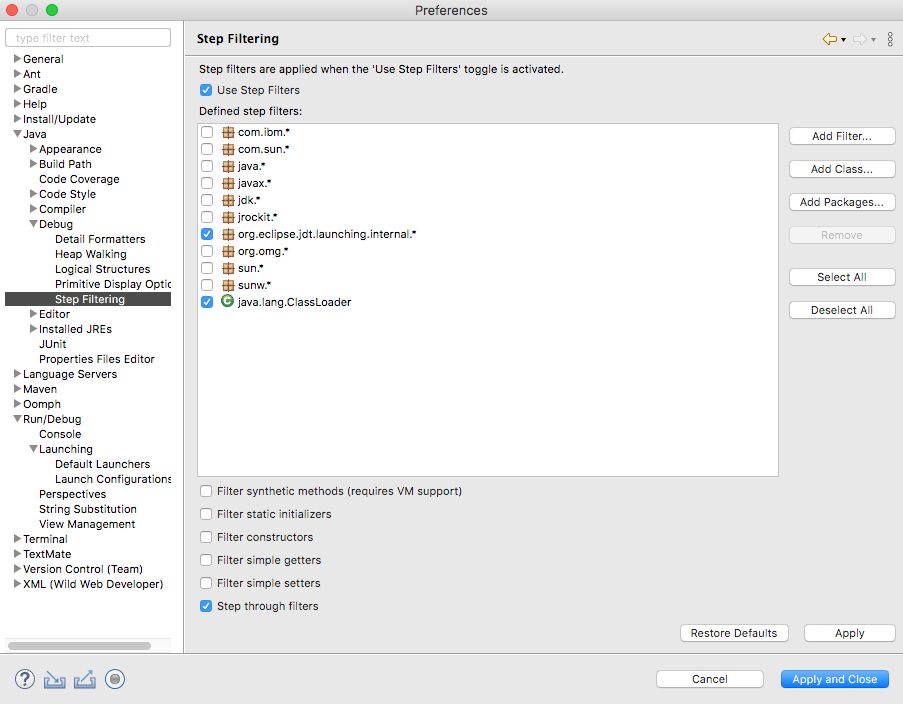
Later, you can use the Debug window to enable or disable the step filtering option.
Also, Read Tips to Node.js Debugging.
#4 Logical Structure
With Eclipse's default settings, checking the values of a map or a list is difficult. You can either alter them or go another route.
The logical structure option comes in handy when trying to figure out what's in a Java collection class like HashMap or ArrayList. The logical structure will display only the necessary information, such as the key and value of a HashMap, rather than the detailed information.
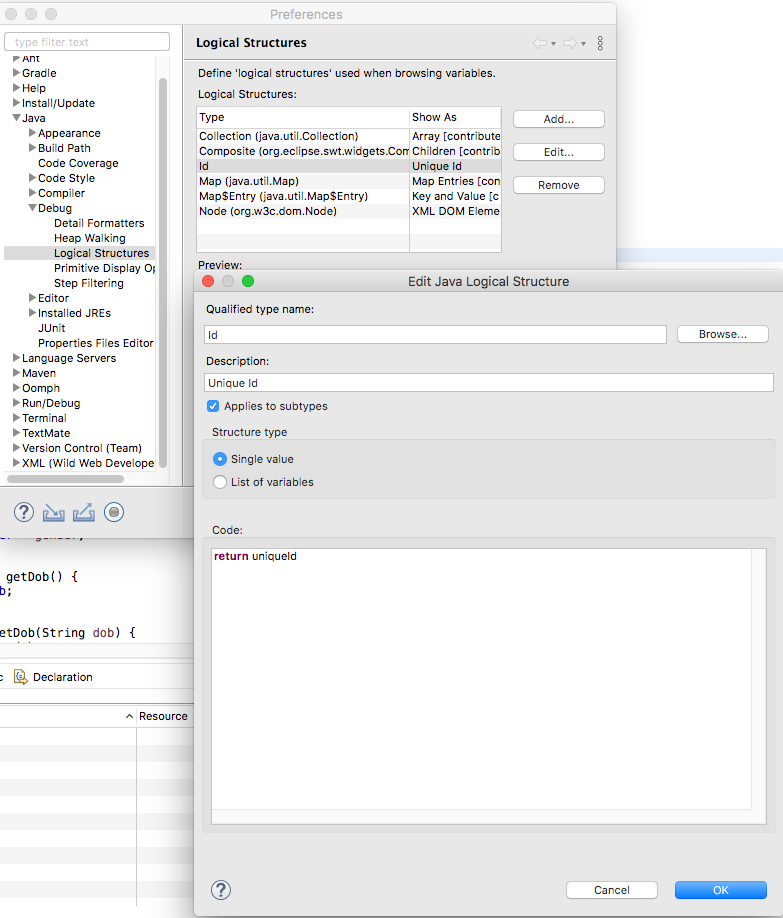
For example, when working with a HashMap, you must browse through the physical entries and deal with HashMap implementation specifics. However, above the variables is a little button labeled "Show Logical Structure." This option is particularly useful if the objects in your structure lack meaningful toString() methods.
#5 Variables View
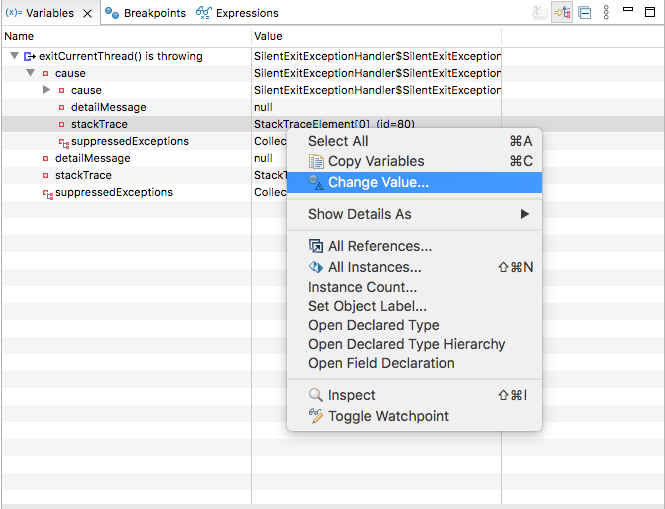
Change the variable value
You can update the values of your variables directly during debugging instead of restarting your debug session with slightly modified input data, such as data entered in a web form. With that capability, you can sometimes save some time and occasionally imitate some weird behavior a little easier.
Debug Shell (Previously known as Display View)
Are you familiar with the term "Debug Shell"?
During debugging, go to "Window->Show View->Debug Shell" to turn it on.
Before Eclipse 4.8, the debug shell is called as display view.
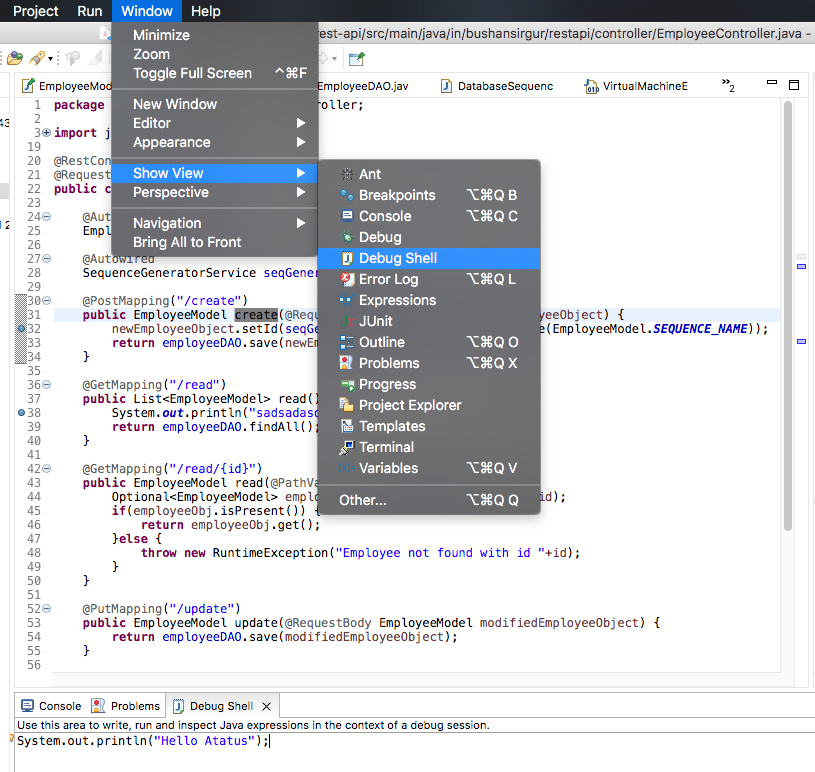
In Eclipse, there should now be a new blank view. This view can be used to enter and evaluate new code. Since the code is run in the context of the current debugging positions, you can use all of your variables and even content assist.
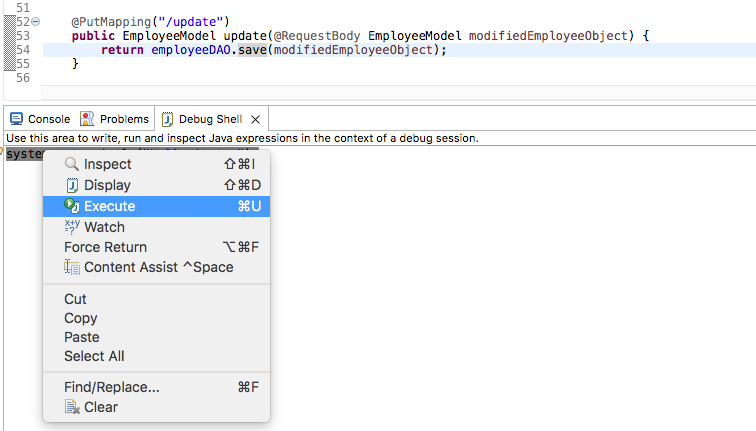
To execute the code: Select the entire code, right click and click on "Execute" to run the code.
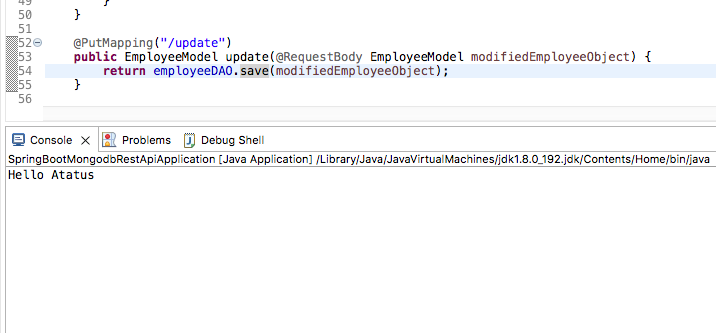
You can view the output in the Console. To turn on console go to "Window -> Show View -> Console".
Simply highlight your code and use the context menu or CTRL+U (execute) or CTRL+SHIFT+I (inspect) to run it.
#6 Inspect and Watch
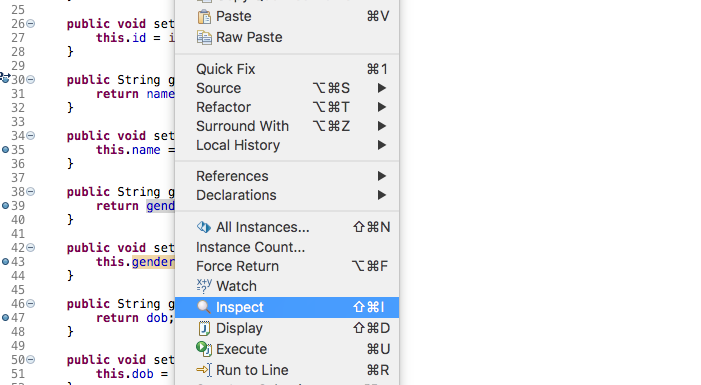
These are two menu options that we use while debugging a Java program to see the value of an expression.
While debugging Java programs, you can use this capability to check the value of expressions. Simply right-click the statement and select inspect from the menu.
During the debugging process, it will display the value of the specified expression. The value will appear on the watch window in front of you. You can also put a watch on a condition, and the value will appear in the watch window.
#7 Drop to Frame
"Step Into", "Step Over", and maybe "Step Return" are terms that I believe everyone is familiar with. That's all you need to know to navigate your code when debugging. We did like to mention two more navigation methods that we enjoy. "Drop to Frame" is the first.
If your application ended at your breakpoint and the important things had already happened, you can “Drop To Frame”. This means that you can return to your stack and begin debugging from there.
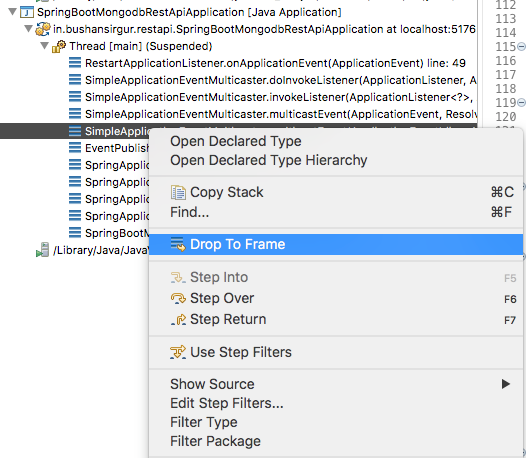
You can use that functionality to go back in time by just selecting a point in your java stackframe where you were previously. We frequently find ourselves debugging and then missing the moment where we need to pay attention. We can then execute the code again using the "Drop to Frame" Feature.
#8 Step into Selection
"Step into Selection" is the second thing.
This is a simple one, but not many people know about it. To do so, simply press Ctrl+Alt and click on the method name you wish to go to. Very convenient and quick.
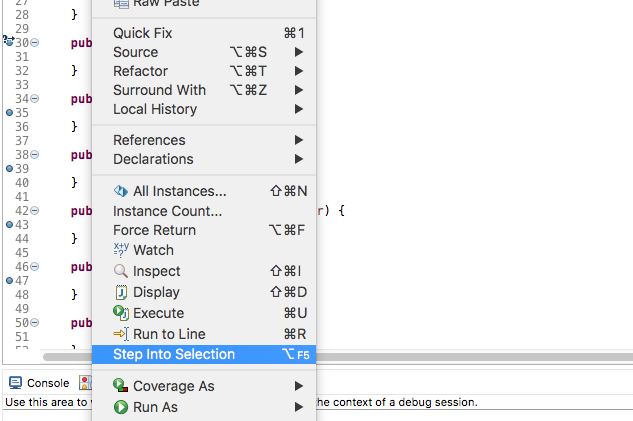
This is significantly better than the standard "Step Into," for example, if you wish to enter a method with several parameters and step through all of the parameter evaluations in one step. A good feature is "Run to Line." Simply position your cursor in front of the line you wish to stop and press "CTRL+R."
#9 Human Readable Objects
The value is displayed in the variables view utilizing the toString() method of your objects. As a result, offering good toString() implementations, such as the default-toString-implementation in java.lang, is extremely beneficial.
The same is suggested by Object:
Returns a string representation of the object. In general, the toString method returns a string that "textually represents" this object. The result should be a concise but informative representation that is easy for a person to read. It is recommended that all subclasses override this method.
// toString implementation for Employee Class

public class Employee {

    private String name;
    private String title;
    private String department;

    public String toString() {
        return "Employee (name=" + this.name + ", title=" + this.title + ", department=" + this.department + ")";
    }
}
#10 Stop in Main
This option is available in the Edit configuration window of the Debug settings. When this feature is activated, the execution of a program will stop at the first line of the main function.
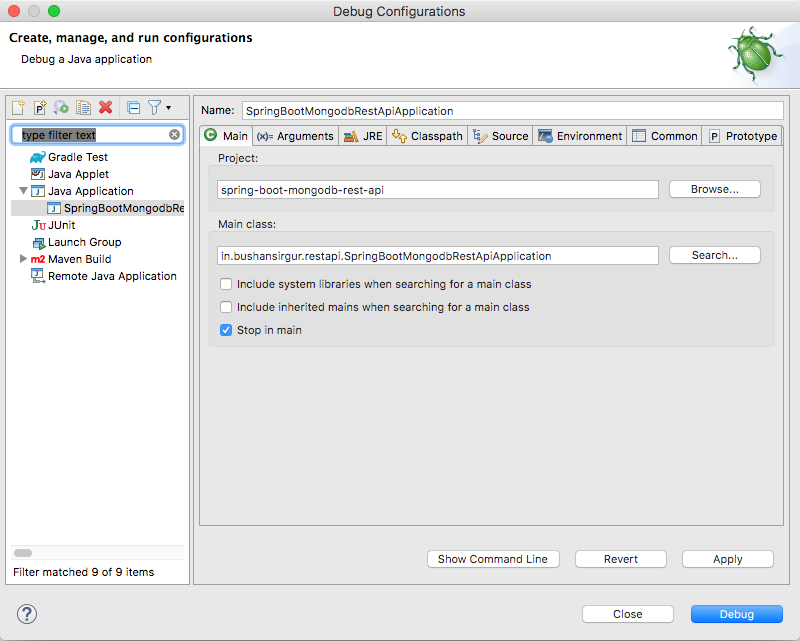
To enable this feature, go to the Edit configuration window and check the option that says "Stop in Main."
#11 Step Into, Over, and Return
This is the first thing to learn in debugging, thus I kept it at the last point.
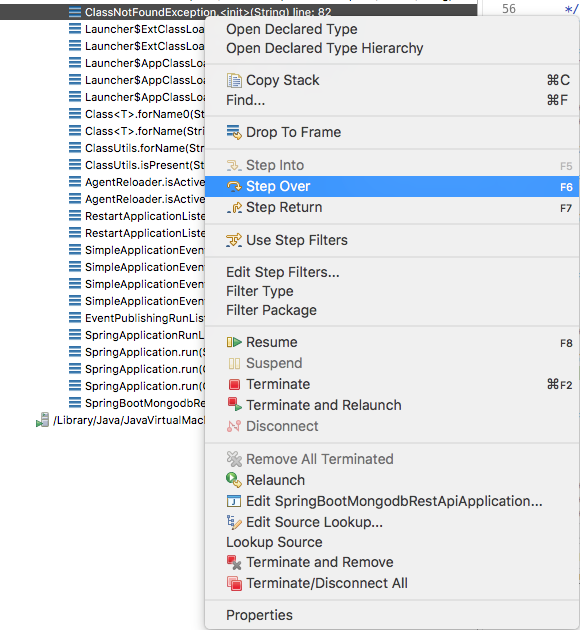
- F5 - (Step Into)
If the current line contains a method call, the control will be transferred to the first line of the called method. - F6 - (Step Over)
The control is moved to the following line. If the current line contains a method call, it executes the method call internally before moving the control to the next line. - F7 - (Step Return)
When done from within a method, control is passed to the calling line, from which the current method is called. - F8
Move to the next breakpoint.
Conclusion
Every Java developer needs to be able to debug, but this is not something that can be learned quickly. It takes practice because there is no one-size-fits-all debugging technique or set of tools that will solve every bug.
Experimenting and thoroughly studying the causes of the bug, as well as employing strategies from the preceding, will enable us to dig further into the bug and eventually solve it.
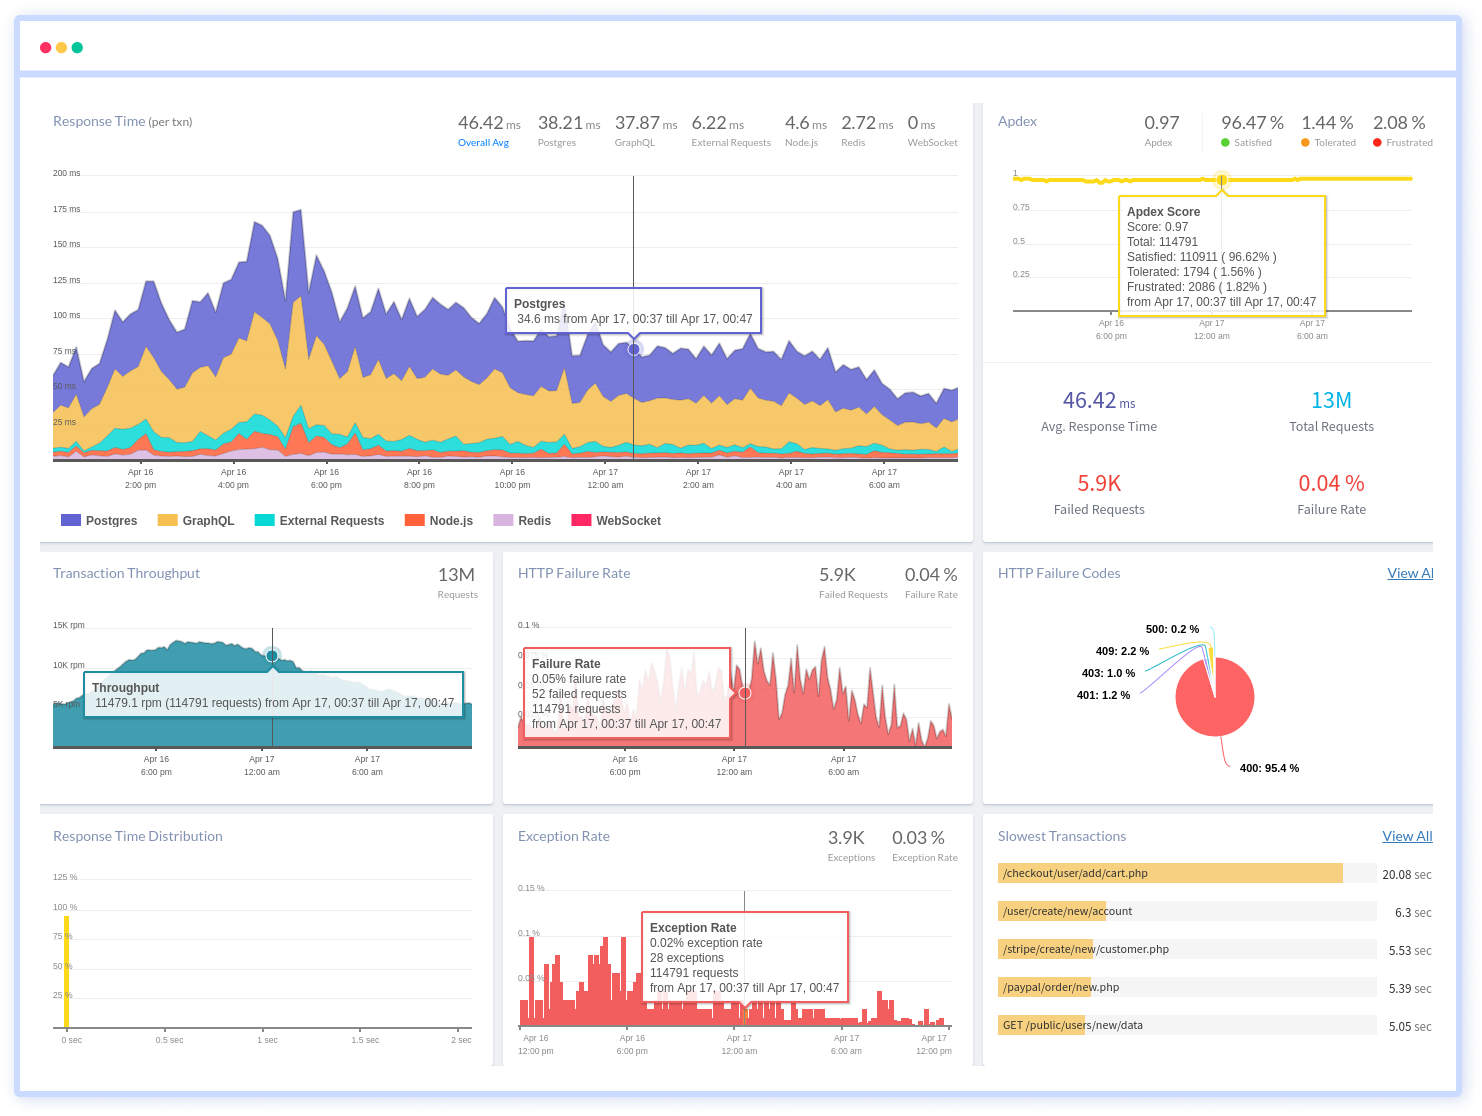
Monitor Your Java Applications with Atatus
Atatus keeps track of your Java application performance bottlenecks to give you a complete picture of your clients' end-user experience. You can determine the source of delayed response times, database queries, and other issues by identifying backend performance bottlenecks for each API request.
To make bug fixing easier, every Java error is captured with a full stack trace and the specific line of source code marked. To assist you in resolving the Java error, look at the user activities, console logs, and all Java requests that occurred at the moment. Error and exception alerts can be sent by email, Slack, PagerDuty, or webhooks.
#1 Solution for Logs, Traces & Metrics
![]() APM
APM
![]() Kubernetes
Kubernetes
![]() Logs
Logs
![]() Synthetics
Synthetics
![]() RUM
RUM
![]() Serverless
Serverless
![]() Security
Security
![]() More
More