A Complete Guide to PHP Debugging
If you're using PHP or adopting a PHP application, you need to know how to debug in PHP. Debugging PHP errors in a production environment is one of the most frustrating things a developer can go through. Identifying the underlying cause is challenging when error reports are ambiguous.
Nobody enjoys debugging their code. However, if you want to create great web applications, you must fully complete the process.
In this guide, you will learn certain PHP debugging methods that apply to practically every programming. I'll go over the specifics of PHP, starting with the fundamentals and working my way up to fully integrated debugging approaches.
We will cover the following:
- Dumping Variables to stdout
- Switch Error Reporting Level
- Monitor Error Log
- PHP Debugging Tools
- Tools to Consider for Debugging
Dumping Variables to stdout
One approach to observe what's going on in your PHP application is to use the var_dump function.
When you don't have any other options and need a quick way to debug PHP script, you can generally output values. This may entail running var_dump or logging a series of events.
var_dump() is a PHP native function that shows structured, human-readable data about one (or more) expressions. This is especially beneficial when working with arrays and objects, as var_dump() recursively reveals their structure, providing you the most complete picture of what's going on. It will print the value of a variable to stdout.
You can also use additional routines to debug PHP scripts through outputs. Here are a few functions:
- var_dump ($var) - Dumps the type and value of the variable to stdout.
- print_r ($var) - It prints the variable value to stdout in a human-readable format.
- get_defined_vars() - It gets all defined variables, including built-ins and custom variables (to see them, use print_r).
- debug_zval_dump ($var) - Dumps the variable together with its reference counts. This is helpful when updating a single reference from multiple pathways.
- debug_print_backtrace() - It prints the current function call-chain in a backtrace.
- debug_backtrace() - It obtains a backtrace. Asynchronously, you can print_r, log it to a file, or send it to a logging endpoint.
Read this blog to learn more about these functions for PHP debugging.
Here's some code that shows how to utilize each of these helpful debugging functions:
<?php

$myVar = "Hello!!!";
var_dump($myVar);
print_r($myVar);
$allVars = get_defined_vars();
print_r($allVars);
debug_zval_dump($allVars);

function sayHello($hello) {
    echo $hello;
    debug_print_backtrace();
}
sayHello($myVar);

?>
These functions allow you to debug your PHP code quickly.
Monitor Error Log
To debug your code, you need to know about the error. Unless you monitor the logs all day and night, you won't know when something bad happened.
Learn How to Log to Console in PHP and Why Should You Do It.
Sending your PHP logs to a provider that will handle a few important things for you is the best option:
Many PHP logging utilities can be configured to operate with Atatus. Atatus works with PHP that handles all of these tasks for you. It also captures traces automatically—and only when it should.
You want to be able to see all of your logs in one location. If you can keep your logs and metrics in one place across all instances. You'd be able to recognize issues no matter where it occurs.
- Traces
It's not only a stack dump that reveals what happened when an issue occurred. It's also a means of monitoring performance, which is frequently a symptom or cause of a bug. - Deduplication of Log Entries
When a bug generates an error, the logs can quickly fill up. It's a show-stopper to just go through the logs and find hundreds or thousands of identical entries. - Alerting
Alerting is a way to send notifications automatically about an issue to a group email or an individual. This could be due to a server problem or errors in your logs. It should be configurable, and you should be able to make changes to it.
Without a doubt, Atatus is an excellent tool for discovering bugs. However, after you've found them, you must correct them.
Switch Error Reporting Level
Error reporting in PHP can be configured in a few different ways. You must have access to the php.ini file to use it. You might also use the access configuration. If you can't utilize configuration files, you can use a script to change the values. This is possible, but consider how you'd change modes after your application has been deployed.
The correct degrees of error logging can be achieved using a mix of settings. You should consider the following options:
- error_reporting - It determines the logging level. During development, E_NOTICE is useful since it alerts you to errors such as unassigned variables.
- display_errors - It instructs PHP on whether and where error messages should be displayed.
- display_startup_errors - Only use it when you're debugging.
- log_errors and error_log - It communicates with each other to send errors to a log file. Rather of displaying them to end-users, do this in production.
The PHP manual goes over these options in greater depth and provides further information. Even if your logging settings are perfect, you must still monitor for errors.
PHP Debugging Tools
One of several debugging tools can be used to attach a debugger client to PHP code. Debug utilities such as Xdebug and ZendDebugger are supported by PhpStorm.
We are polyglots (people who know or use several languages), so we need an IDE that supports many languages. We've used Xdebug with Visual Studio before, so let's see how to do it with VS Code.
The debug server is identical, but each client (IDE or CLI) has a slightly different configuration. The debug server (a Zend extension) opens a port through which the client communicates with the server. It's merely a matter of setting up the right components and installing them.
The following are the steps to programming in PHP:
- In VS Code, look for PHP extensions.
- Install the PHP Debug extension to your PHP configuration.
- Click “Reload” to reload VS Code.
- Install the Xdebug program. The PHP Debug extension for VS Code is limited to Xdebug integration. If we install PHP 7.0, the correct version of Xdebug must be downloaded from the download page.
<?php
   phpinfo();
?>
- Put it in the PHP/ext directory once you've found the proper version.
- The next step is to set up PHP to use the extension and enable remote debugging. In the php.ini file provided in PHP Info, add the following configuration:
; set the extension path
zend_extension="/absolute/path/to/xdebug.so"

; allow remote debugging
[XDebug]
xdebug.remote_enable = 1
xdebug.remote_autostart = 1- It will configure the PHP server to work with XDebug. No matter which IDE you use, the processes are the same.
- Xdebug creates an HTTP port for your debugger to connect to. The client must still be set to connect to the server and utilize the debugging protocol.
- Finally, set up VS Code to connect with Xdebug. After a few simple steps, the attachment is completed automatically.
Configuring Your IDE
You must configure IDE to attach to the debugger after installing Xdebug. This is equivalent to adding a debug configuration in Visual Studio Code. Fortunately, it is automatic and only a few simple steps are required:
- Switch to the debug mode.
- The languages menu will appear when you click the gear.
- Choose PHP. The default configuration will be generated by Visual Studio Code.
- The PHP server should be reloaded. We'll need to install a third-party extension called "PHP Server" to make this easier. To control the PHP server, use the context menu (right-click).
- It puts the IDE in a position where it can connect to Xdebug. A TCP port on the debug server is used to communicate with the debugger. By default, Xdebug uses the DBGp protocol via port 9000.
Attaching a Debugger
We’ve installed a debugging extension and configured our IDE. It's now time to connect to the debugger.
A launch.json file was generated by the PHP Debug plugin for VS Code. That file is placed in the project's root .vscode directory. Here's what it resulted in:
{
    // Use IntelliSense to learn about possible attributes.
    // Hover to view descriptions of existing attributes.
    // For more information, visit: https://go.microsoft.com/fwlink/?linkid=830387
    "version": "0.2.0",
    "configurations": [{
            "name": "Listen for XDebug",
            "type": "php",
            "request": "launch",
            "port": 9000
        },
        {
            "name": "Launch currently open script",
            "type": "php",
            "request": "launch",
            "program": "${file}",
            "cwd": "${fileDirname}",
            "port": 9000
        }
    ]
}
It's going to add two new launch configurations. These can be found in the debug view. With the current script, we can either connect to an existing server or start a new one. Since I already have phpinfo running, I'll begin by selecting Listen for XDebug to connect to that server.
The debug toolbar will appear once you've been connected.
A control mechanism can be found in most debuggers. You can use this to start, stop, step, and restart your debugger. We're connected and ready because we see a stop and pause icon, so let's get stepping.
Setting PHP Breakpoints
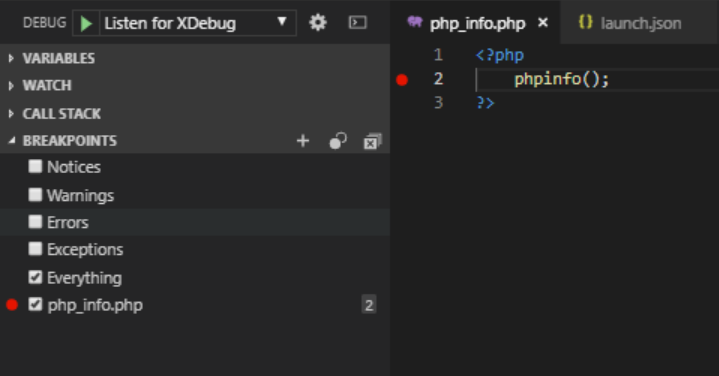
The first step is to create a php breakpoint where you believe there is an issue. We normally plug one in right before we enter the problem code so we can see what's going on. To get things started, let's add one to the phpinfo script.
By clicking in the left margin, you may usually set a breakpoint on the next line. Alternatively, place your cursor on the line and press F9. If you have many function calls on the same line, this is a good approach to make sure the php breakpoint is set on the right one. In the left margin, a red dot should emerge. This is an example of a breakpoint. It should also appear in the "breakpoints" section.
We're still looking at things in Debug view. One php breakpoint was set. You can now right-click the red breakpoint circle in the margin next to the code and select Edit breakpoint. Conditions come in handy when you have a large collection but only one element is causing a problem. Conditionals are something we use all the time.
You can log a message and break after a particular number of hits, in addition to conditional breakpoints. When you have code that repeats without a specific unique value to break on, the latter is useful.
For example, you may have code that renders components in a collection. You can simply set the hit count to 13 if the 13th component produces a disaster. We've had to manually count too many times to notice how useful this feature is.
Tools to Consider for Debugging
Finally, we'd like to highlight a handful of useful tools that we've found beneficial in the debugging process. We won't go into great detail about how to install and configure these extensions and add-ons, but we wanted to bring them up because they can make our life so much easier.
- Xdebug
Xdebug is a PHP extension that seeks to make the process of debugging your applications a little easier. Xdebug is extremely customizable and adaptable to a wide range of scenarios. Stack traces, for example, can be set to four different levels of detail. This means you can change the sensitivity of Xdebug's output to acquire more detailed information about your application's behavior. - FirePHP
FirePHP is a PHP library and Firefox add-on that can be extremely beneficial when working with AJAX. Essentially, FirePHP allows you to use a single method call to log debug information to the Firebug console. All data logged to the Firebug console is sent via response headers, so it does not affect how the browser renders the website.
Conclusion
In this article, we've covered a lot. It'll be enough to get you started debugging PHP. This is a complex subject, but the best way to learn is to practice. You'll develop a reputation as a bug exterminator extraordinaire if you practice debugging until you've mastered the technique.
Hopefully, you've learned how to debug in PHP, use var_dump(), and more. Similarly, I hope you will find Xdebug and FirePHP beneficial and that they will make your development cycle easier.
Atatus: PHP Performance Monitoring and Log Management
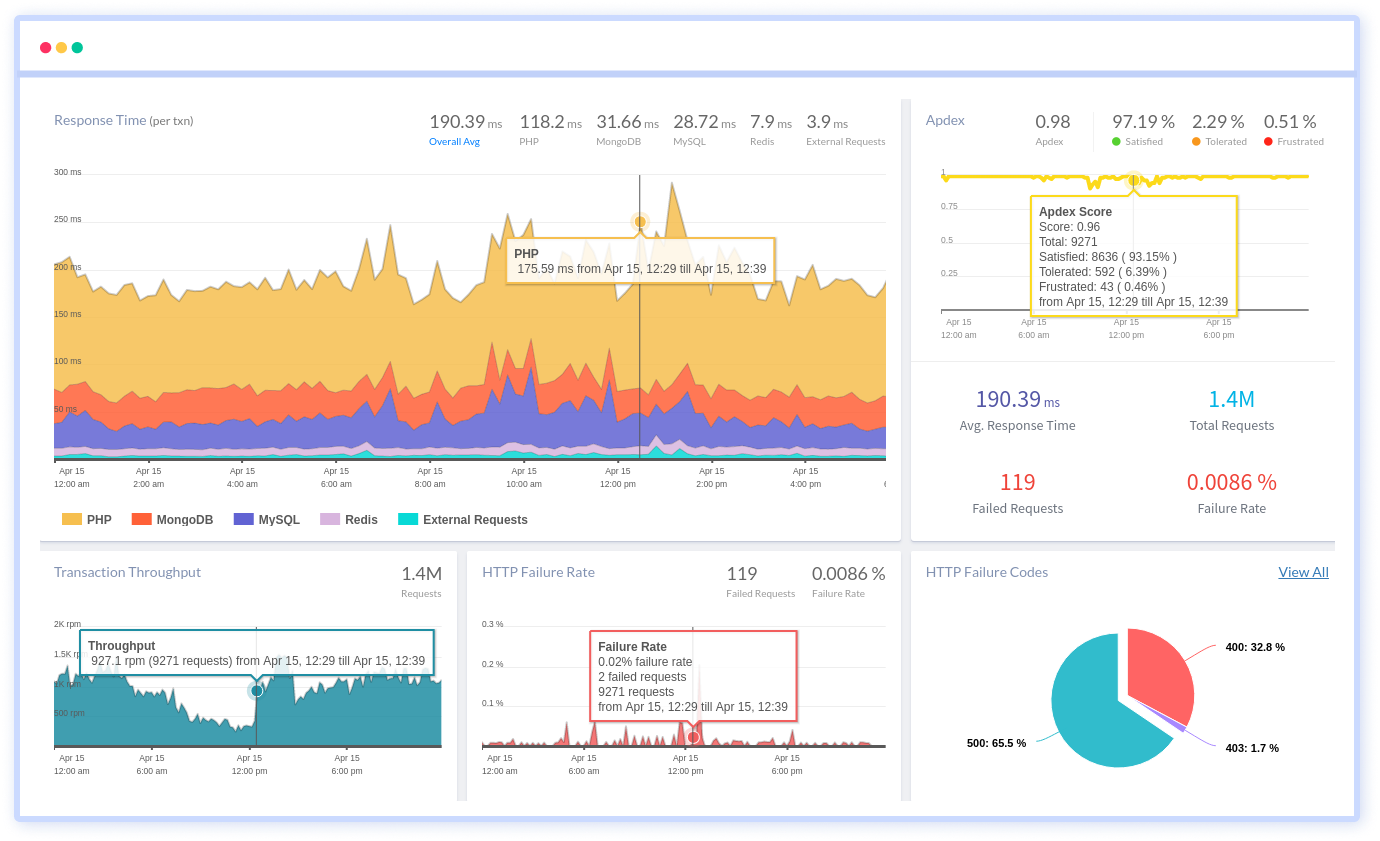
Atatus is a Full Stack Observability Platform that collects all requests to your PHP applications without requiring you to change your source code. However, the tool does more than just keep track of your application's performance. It monitors logs from all of your PHP applications and systems into a centralized and easy-to-navigate user interface, allowing you to troubleshoot faster.

We give a cost-effective, scalable method to centralized PHP logging, so you can obtain total insight across your complex architecture. To cut through the noise and focus on the key events that matter, you can search the logs by hostname, service, source, messages, and more. When you can correlate log events with APM slow traces and errors, troubleshooting becomes easy.
We offer Application Performance Monitoring, Real User Monitoring, Serverless Monitoring, Logs Monitoring, Synthetic Monitoring, Uptime Monitoring, and API Analytics. It works perfectly with any application, regardless of framework, and has plugins.
#1 Solution for Logs, Traces & Metrics
![]() APM
APM
![]() Kubernetes
Kubernetes
![]() Logs
Logs
![]() Synthetics
Synthetics
![]() RUM
RUM
![]() Serverless
Serverless
![]() Security
Security
![]() More
More