Java Profiling Essentials: A Guide to different Java Profilers
When you are building an application with Java (or any other language, for that matter), there are certain aspects that you need to monitor constantly. This monitoring helps a long way in retaining your product's marketability and improving customer satisfaction.
You can probably think of those situations wherein you are getting redirected to the homepage while you were halfway through filling out your passenger details for your journey or those error messages that pop up over and over again while accessing a product on the web.
These are irky situations, and we would like to avoid them at best. So what do we do then? Well, profiling is a good shot!
Let’s look at what profiling is in detail and also go through the ways in which you can maintain the performance of your application high and robust.
Let's look at the following:-
What is Java Profiling?
Java profiling is the process of gathering performance data about a Java application in order to identify and diagnose performance bottlenecks and memory leaks.
Profiling can be done using various types of profilers, such as sampling profilers, instrumenting profilers, memory profilers, JVM profilers, thread profilers, and remote profilers.
The performance data collected by a profiler can include information such as method call counts, memory usage, CPU usage, thread activity, and garbage collection statistics.
Profiling aims to identify and fix performance issues that can slow down the application or cause it to crash. Profiling can be done during development, testing, or in production to gather information about how the application behaves under different loads and conditions.
Types of Java Profilers
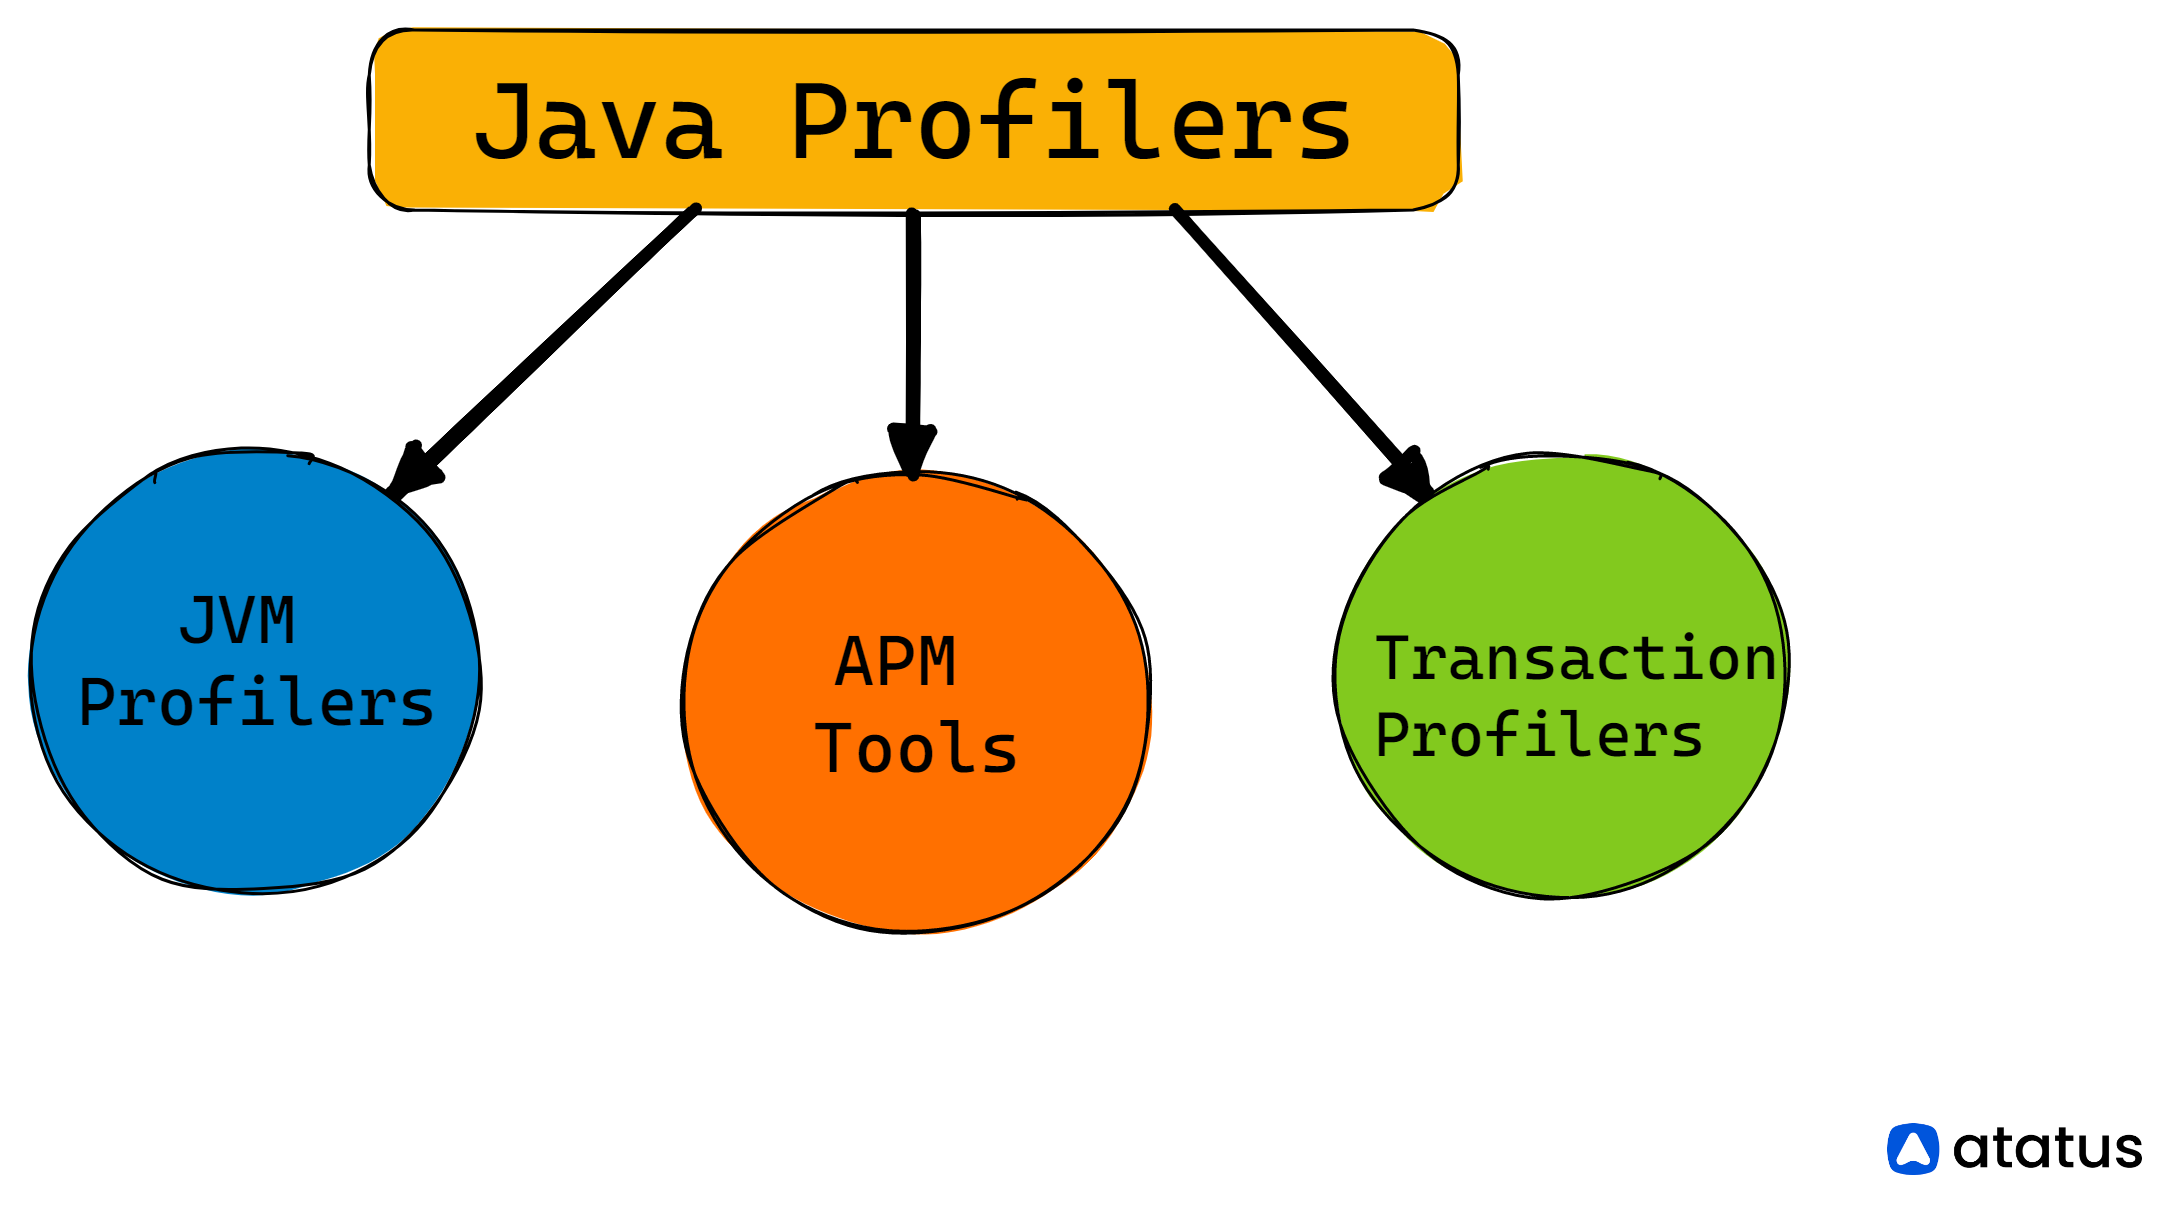
Profilers can be of various types. It can be sampling profilers, instrumenting profilers, memory profilers, thread profilers, or remote profilers. But for the sake of understanding, we are going to couple a few and mention them under these three headings:
- JVM profilers
- APM tools
- Lightweight transaction profiles
#1 JVM Profilers
JVM (Java Virtual Machine) profilers are tools that help analyze and optimize Java application performance. They can be used to measure various aspects of the application's performance, such as memory usage, CPU usage, and thread activity.
Some examples of JVM profilers include JProfiler, VisualVM, and Yourkit. These tools can help identify bottlenecks in the application, such as slow-running methods or memory leaks, which can then be addressed to improve the application's overall performance.
Pros:
- Tracks all the JVM metrics, including CPU usage, threads, and memory
- Tracks down memory leaks
- Reviews memory consumption on a regular basis
- Garbage collection allows tracking precisely which processes are eating away too much memory.
Cons:
- Requires the machine to be directly connected to the profiler
- It doesn't work off-thread
- Profiling is a high-powered activity and can slow down your application
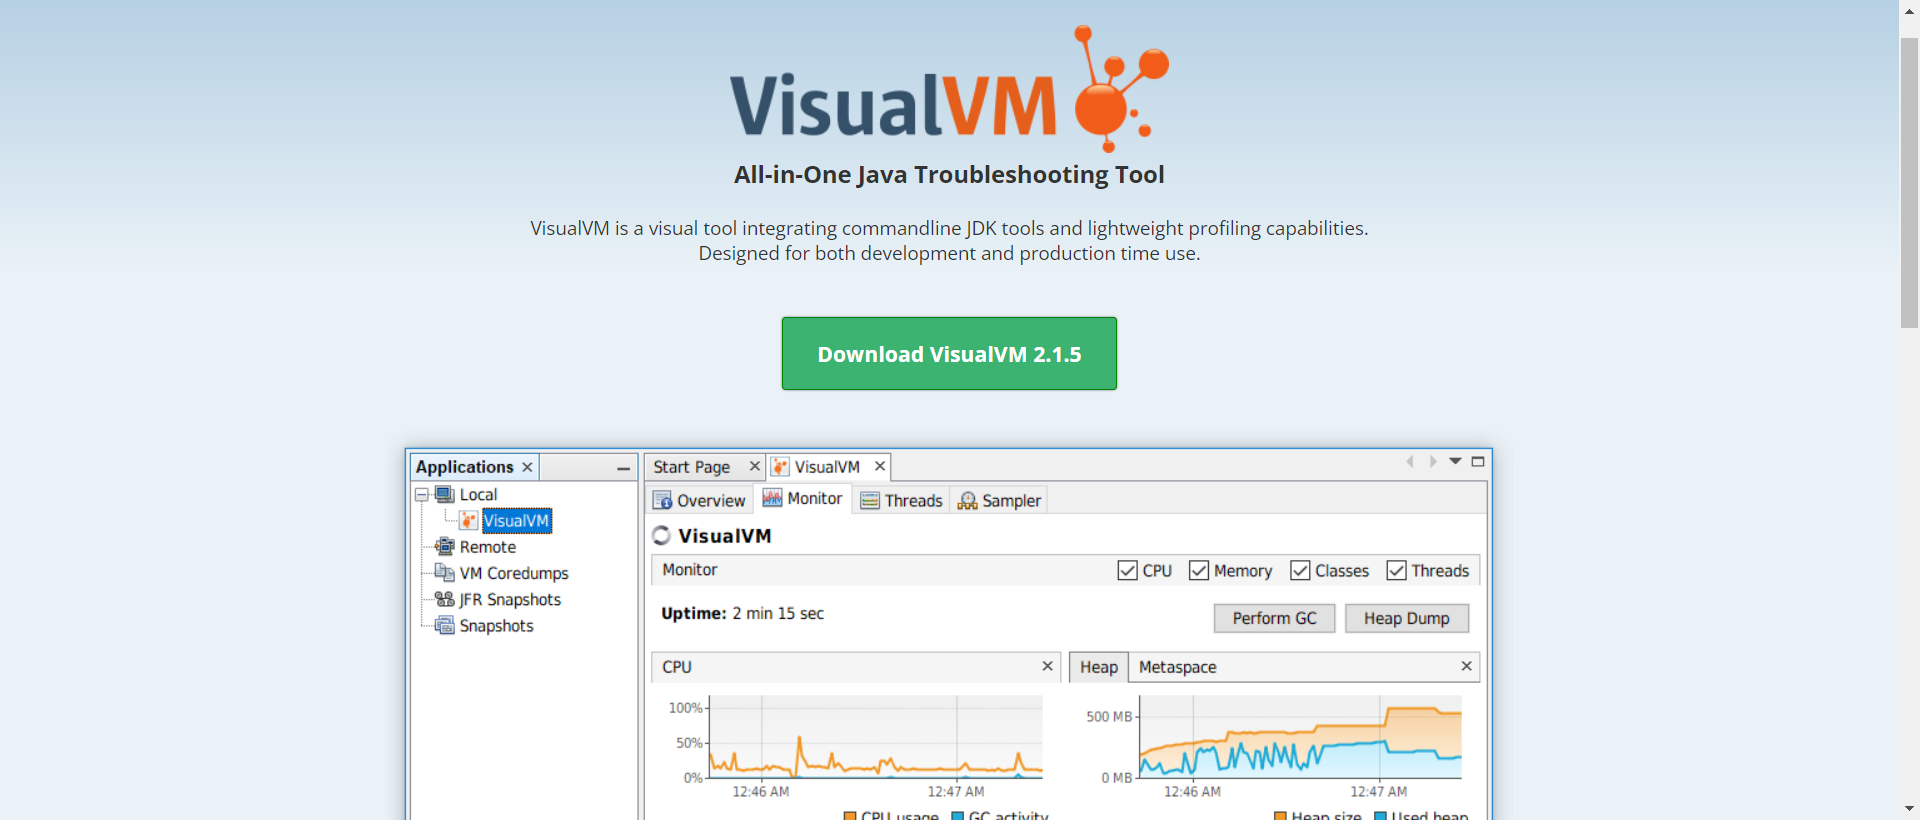
1. visualVM Java Profiler
VisualVM is a java profiler tool developed by java development kit (JDK). Since it is a part of JDK, there is no need to pay any license fee when installing.
In a survey by rebellabs, visualVM was voted by 46.5% of developers. It is a comprehensive profiler that displays local and remote processes on all VMs. Apart from this, it can also be configured with additional VMs using JMX.
VisualVM is lightweight and easy to use, making it a good choice for developers and administrators who need to identify and diagnose performance issues quickly. In addition to being a lightweight monitoring tool, it can collect and display thread dumps and heap dumps, as well as display various statistics about the internals of the Java Virtual Machine.
Head dump analysis can give you insights into memory-related issues like leaks, while thread dumps can resolve thread-related deadlocks.
It can monitor MXBeans via JMX(Java monitoring extensions), assess thread pool usage and memory pool statistics, and check the garbage collection frequency.
Its sharp performance analysis makes visualVM stand out from other profiler tools. And this is why most developers tend to choose visualVM for their primary application performance monitoring. They might then follow it with other heavier profilers for an in-depth cleanup.
VisualVM has a plug-in architecture that allows for the addition of new features and functionality.
You can customize the look and feel of the interface, create your own plugins and also it allows to import and export settings.
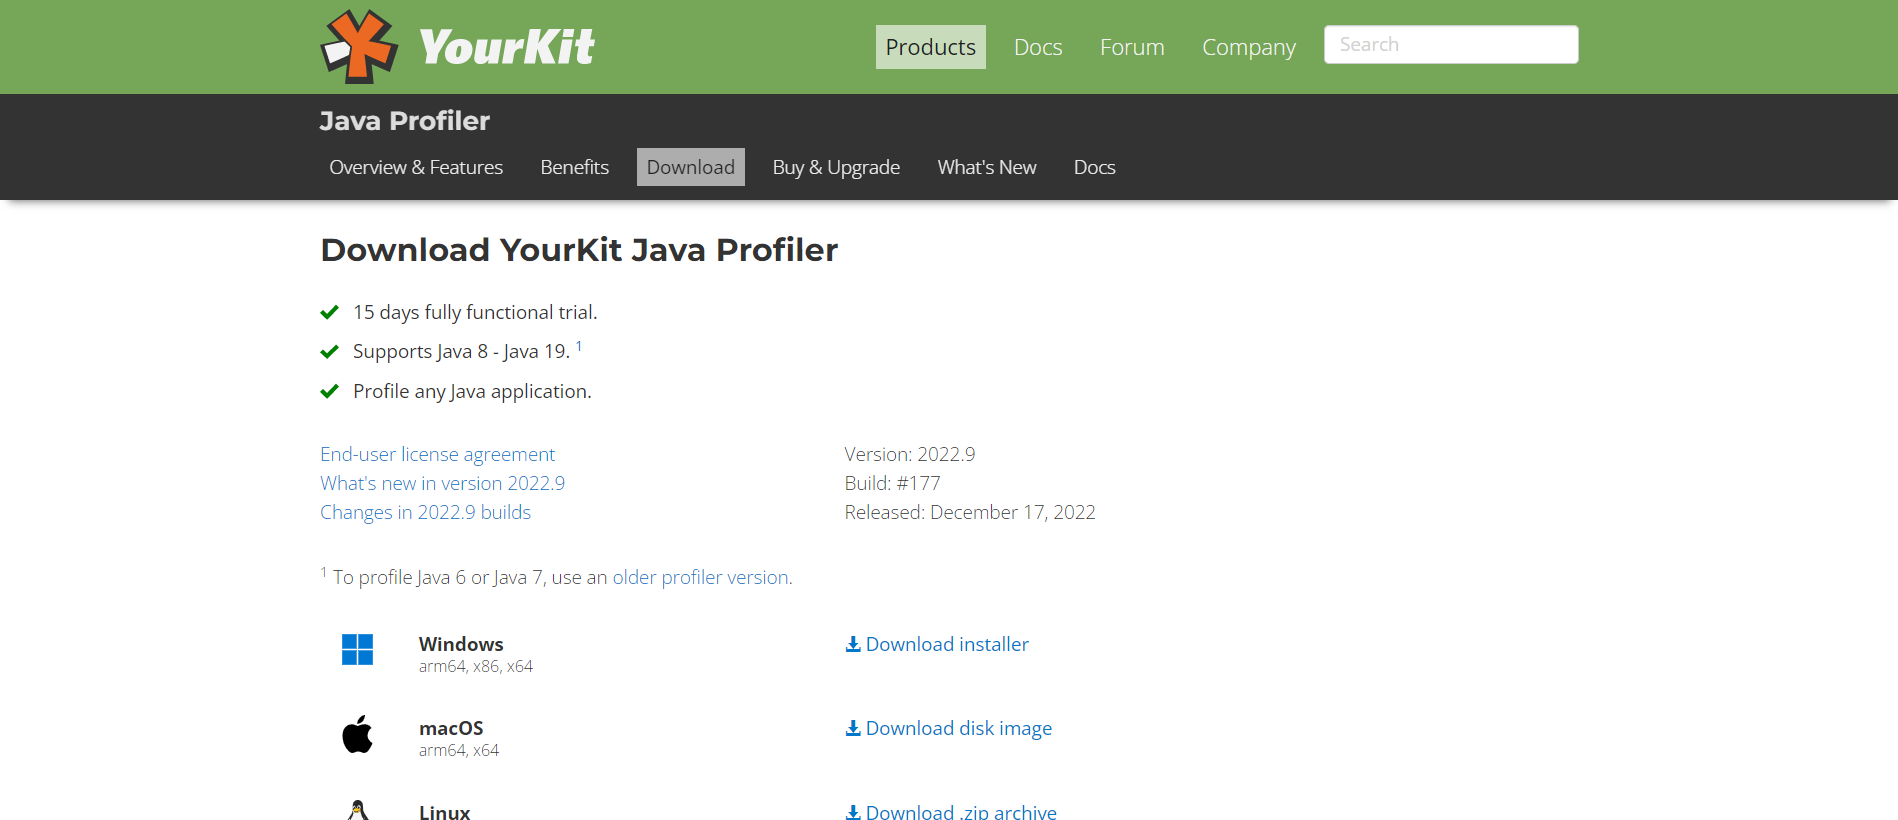
2. YourKit JVM Profiler
YourKit Java Profiler has a variety of features that are designed to help developers analyze and optimize the performance of their Java applications. Some of the key features include:
- Heap profiling: Allows you to track the size and growth of the heap, identify memory leaks, and analyze object retention.
- CPU profiling: Allows you to track the performance of individual methods and identify performance bottlenecks.
- Thread and monitor profiling: Allows you to track the activity of threads and monitors in your application and identify potential concurrency issues.
- JMX and JVM statistics: Provides information on the current state of the JVM and JMX-enabled applications, such as memory usage, thread count, and garbage collection statistics.
- Call tree and hot spots: Provides detailed information on method invocations and allows you to identify the most frequently called methods in your application.
- Snapshot comparison: Allows you to compare two snapshots of an application's performance and identify changes that may have affected performance.
- Integration with Eclipse and IntelliJ IDEA: You can profile the application directly from your development environment with the plugin. You can also profile applications from the command line and automate profiling with scripts.
- Compatibility: Compatible with various Java versions.
YourKit Java Profiler is a powerful tool that can help developers optimize the performance of their Java applications by providing detailed information on memory usage, CPU usage, and thread activity.
#2 APM Tools
APM (Application Performance Management) tools are used to monitor the performance of software applications, typically in production environments. They provide a wide range of capabilities including:
- Real-time monitoring of key performance metrics such as response time, throughput, and error rates.
- Tracing individual requests through the application to identify performance bottlenecks.
- Root cause analysis of performance issues.
- Alerting and notification of performance issues.
- Historical performance data analysis and reporting.
These tools can be used to monitor different types of applications, including web applications, mobile apps, and microservices. They can also be used to monitor the performance of applications running on different platforms, including on-premises, cloud, and hybrid environments.
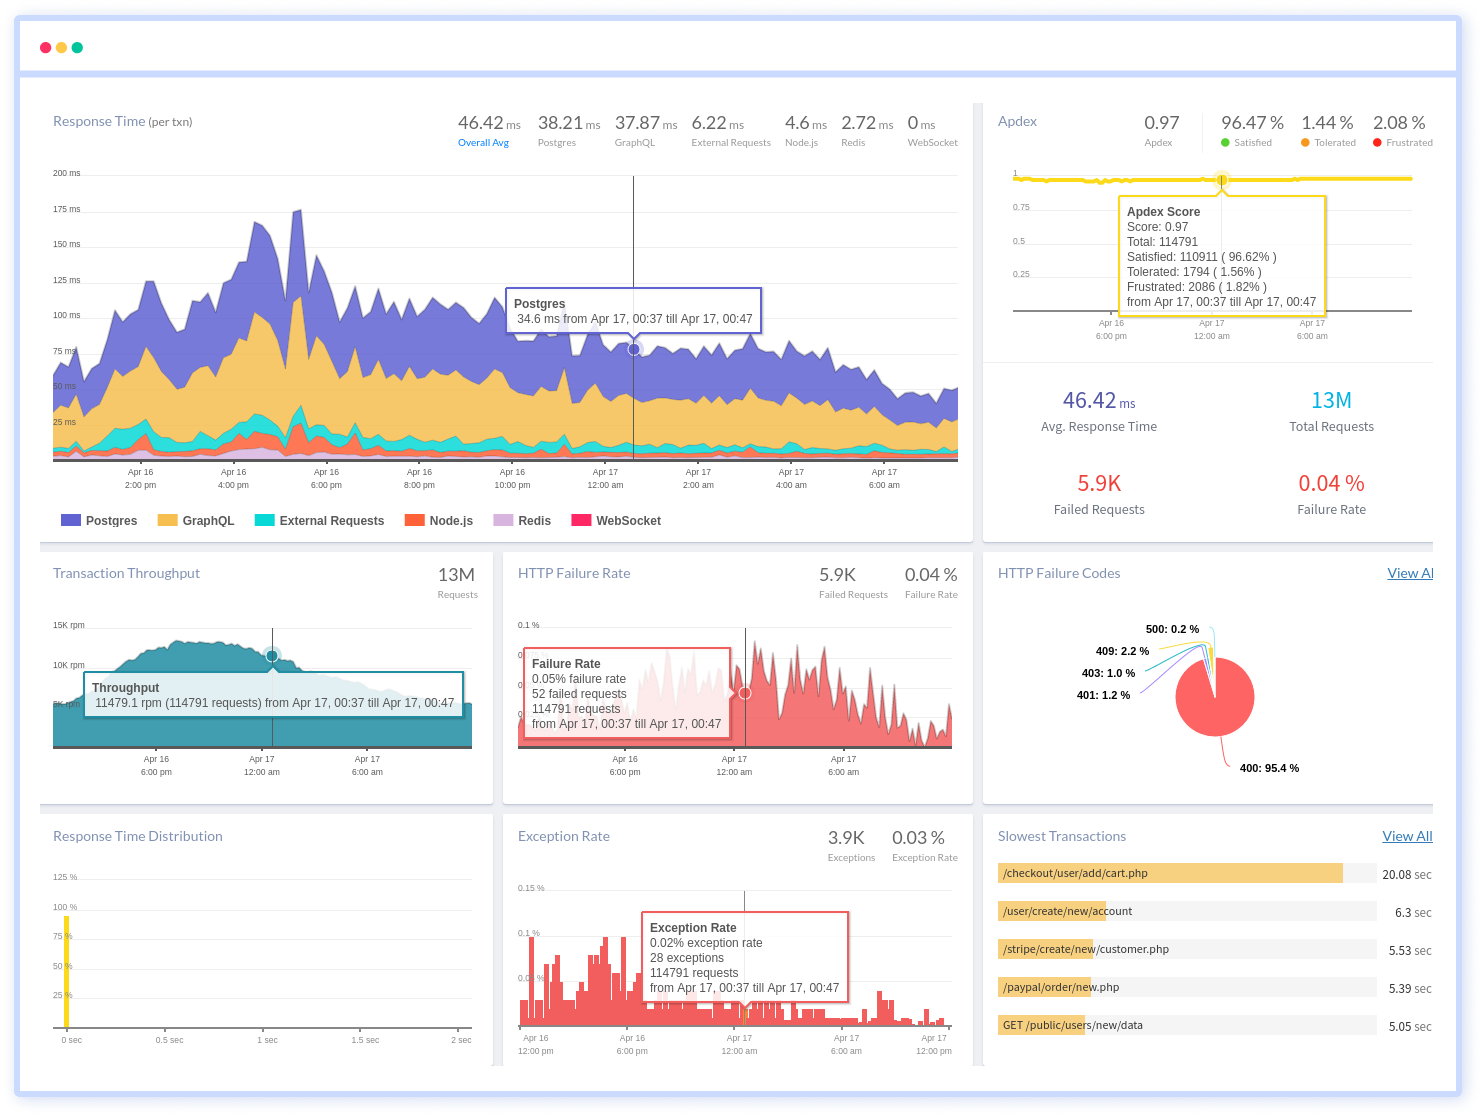
1. Atatus
Atatus is a powerful application performance monitoring and management tool which is designed for developers and managers. It is an all-in-one integrated platform with transaction monitoring, database monitoring, external requests monitoring, and shows live performance data.
It supports Java, PHP, Node.js, Ruby, Python, JavaScript, Laravel, Express, Angular, React, and much more platforms.
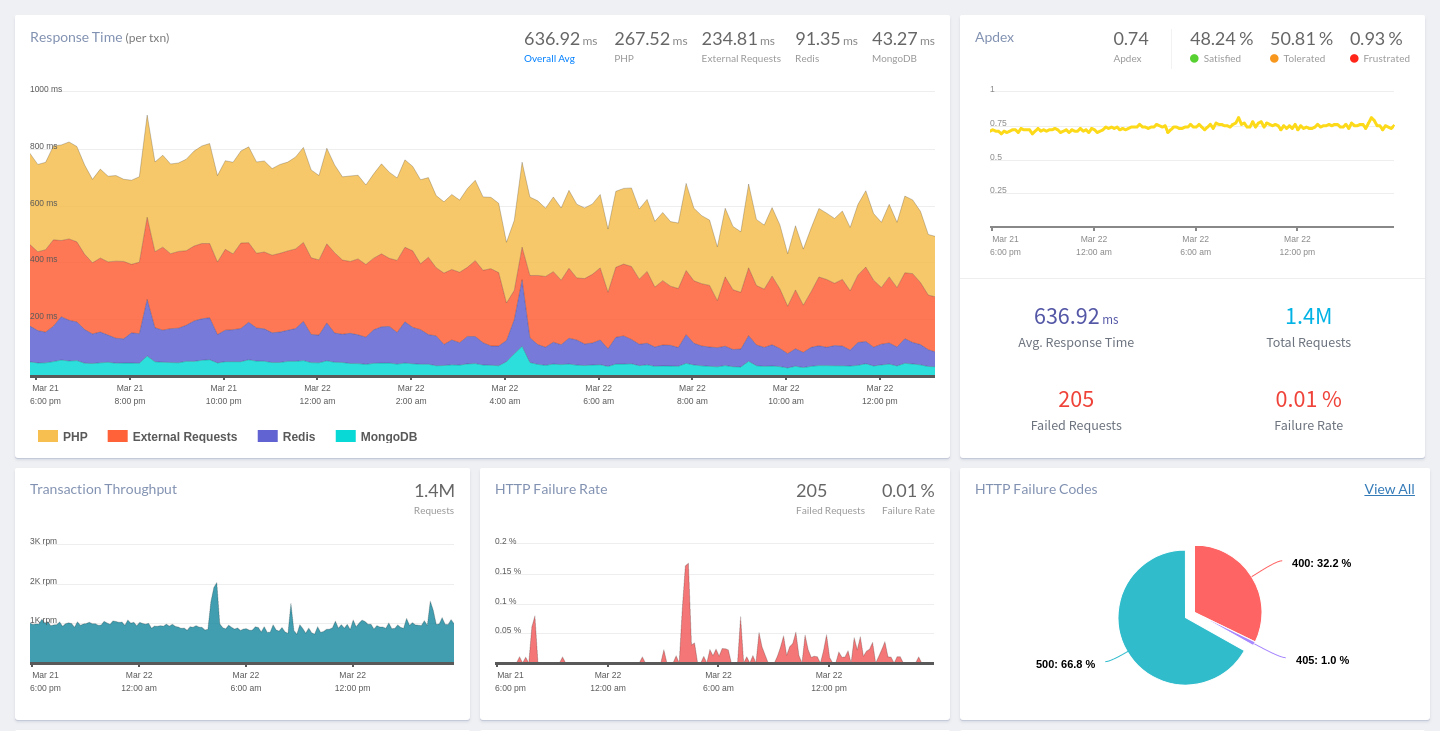
The platform dynamically collects millions of performance data points from across your applications, allowing you to resolve issues more rapidly and enhance the digital user experience. And with the flexibility of cloud or on-premise deployment, everything takes place in real-time in the field.
Atatus ensures that your teams know all the performance metrics necessary to produce reliable software. When a performance bottleneck occurs, you can investigate who, when, and what caused it.
In addition to tracking the functionality of your apps, Atatus sends you notifications when there are problems.
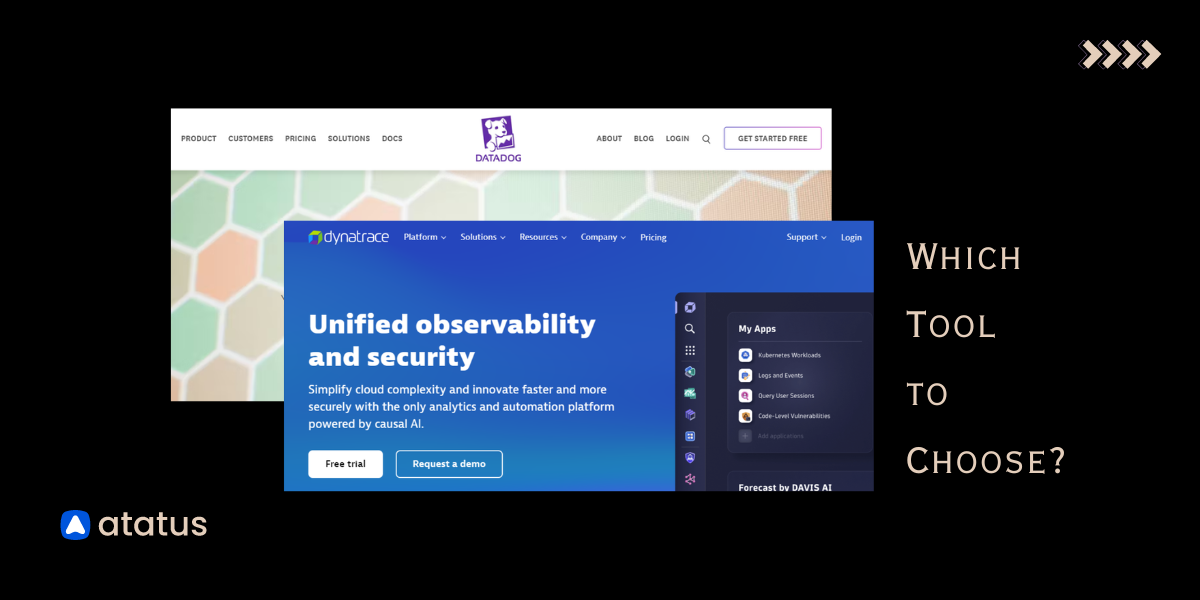
2. Datadog
Datadog is a cloud-based monitoring and analytics platform that helps organizations monitor and optimize their applications, infrastructure, and business processes.
It allows you to collect and visualize metrics from various sources, including servers, applications, cloud platforms, and containers.
Datadog provides distributed tracing capabilities that allow you to track the performance of individual requests as they pass through your applications and infrastructure. This can help you to identify bottlenecks and optimize performance.
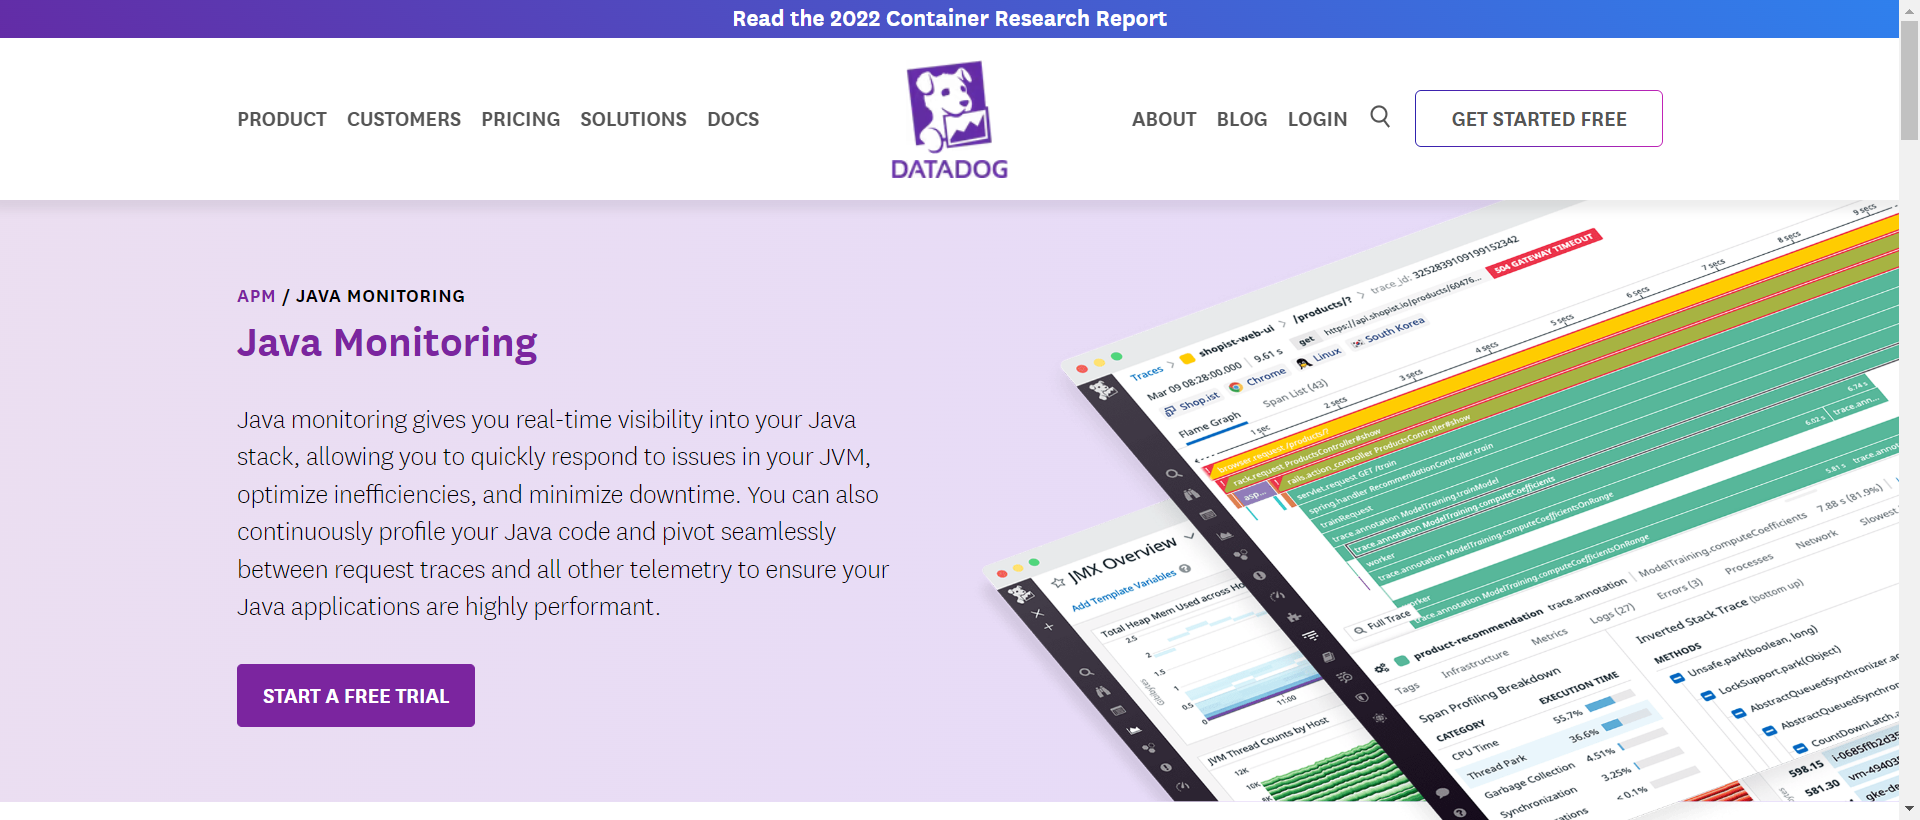
It gives alerts based on metrics, logs, and traces and integrates with popular notification platforms, such as Slack, PagerDuty, and email. In addition, it provides a wide range of integrations with popular tools and other platforms, such as AWS, Azure, and Google Cloud.
Datadog is a popular choice for monitoring and analytics due to its comprehensive feature set and wide range of integrations.
#3 Lightweight Transaction Profilers
A lightweight transaction (LWT) is a type of database transaction that is designed to be lightweight in terms of performance and resource usage.
In a lightweight transaction, the database only performs a partial check of the constraints on the data being modified, as opposed to a full check in a traditional, heavyweight transaction. This allows lightweight transactions to be faster and more efficient than heavyweight transactions, but they are also less robust and may not provide the same level of data consistency.
In terms of the YourKit JVM Profiler, Lightweight transaction profiling is a feature that allows to profile database transactions and measure their performance.
It analyzes database queries and transaction performance, providing information about the time spent on database-related operations, the number of database queries, and the amount of data sent and received. It also allows to analyze the performance of specific database queries and transactions and identify bottlenecks impacting the application's overall performance.
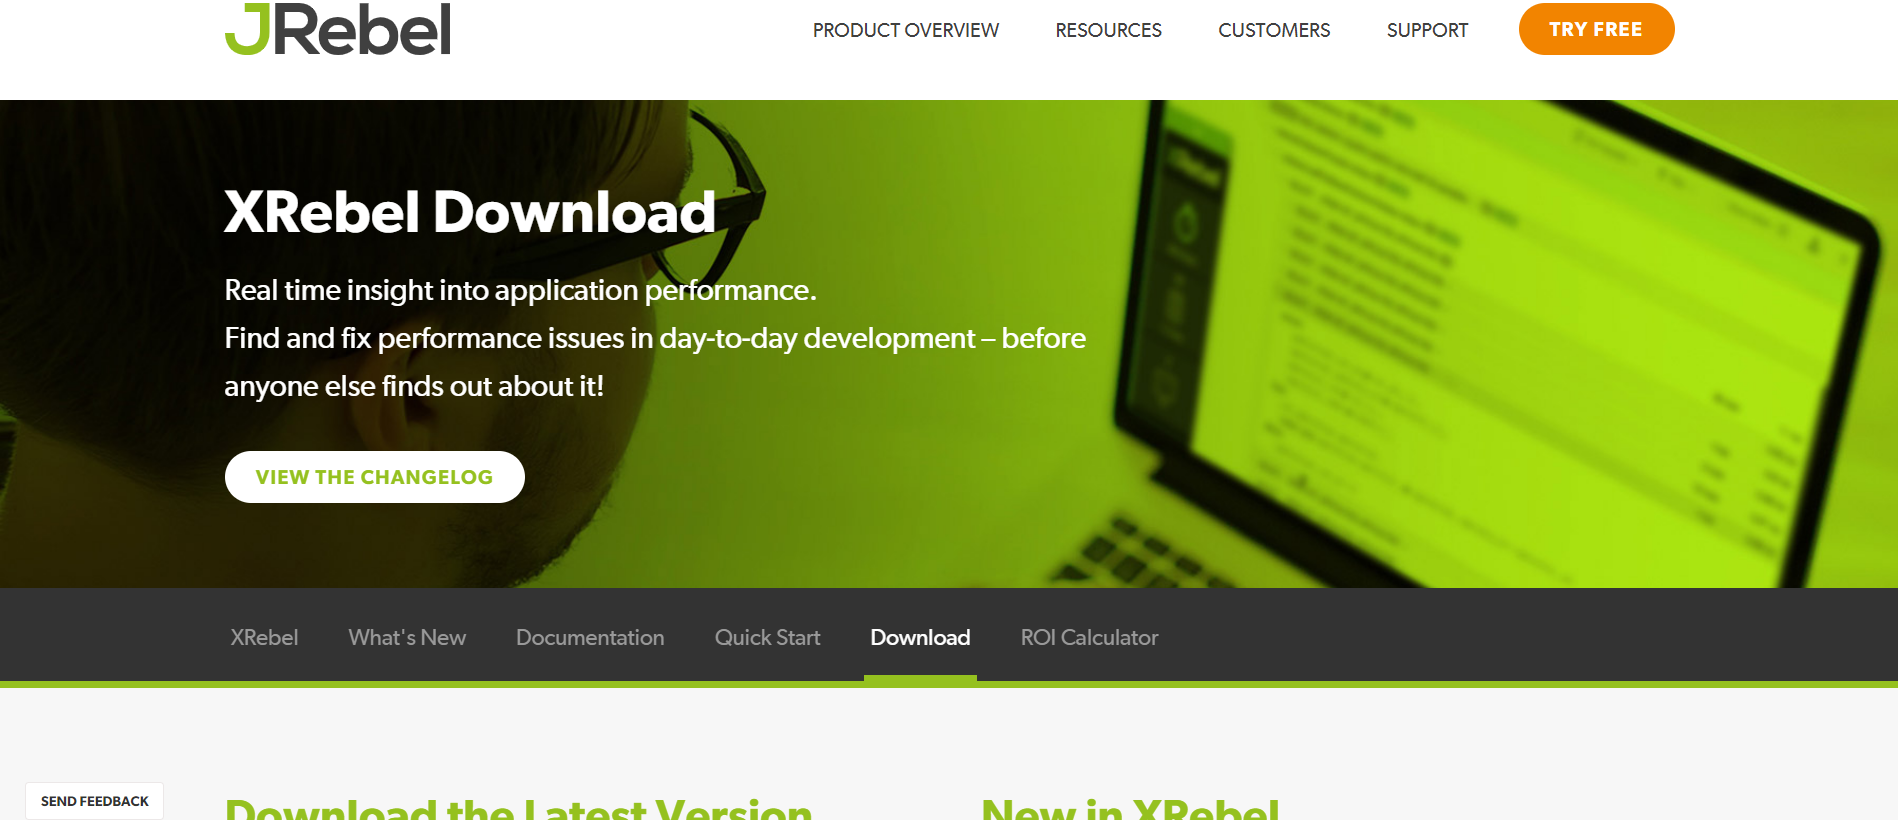
1. XRebel
XRebel is a Java performance optimization tool from ZeroTurnaround that helps developers identify and fix performance issues in their Java applications. It provides real-time visibility into the performance of an application by monitoring and analyzing various aspects of the application, such as database queries, web requests, and method invocations.
Some of the features of XRebel include:
- Real-time performance monitoring: This allows you to see the performance of your application in real time, including the time taken for web requests and database queries.
- Automatic detection of performance issues: XRebel can automatically detect common performance issues, such as slow database queries and memory leaks.
- Root cause analysis: it can help you identify the root cause of a performance issue by providing detailed information on the methods and queries that are causing the issue.
- Integration with popular Java frameworks: XRebel is compatible with a variety of popular Java frameworks, including Spring, Hibernate, and Struts.
- User-friendly interface: XRebel has a user-friendly interface that allows you to navigate and analyze performance data quickly.
- Integration with your favorite IDE: You can profile the application directly from your development environment with the plugin.
- Remote profiling: You can profile applications running on remote servers or in the cloud.
- Continuous monitoring: Allows you to monitor the performance of your application even after it has been deployed to production.
XRebel is a good tool that can help developers identify and fix performance issues in their Java applications by providing real-time visibility into the application's performance. As a result, it helps developers optimize their code and improve the application's overall performance.
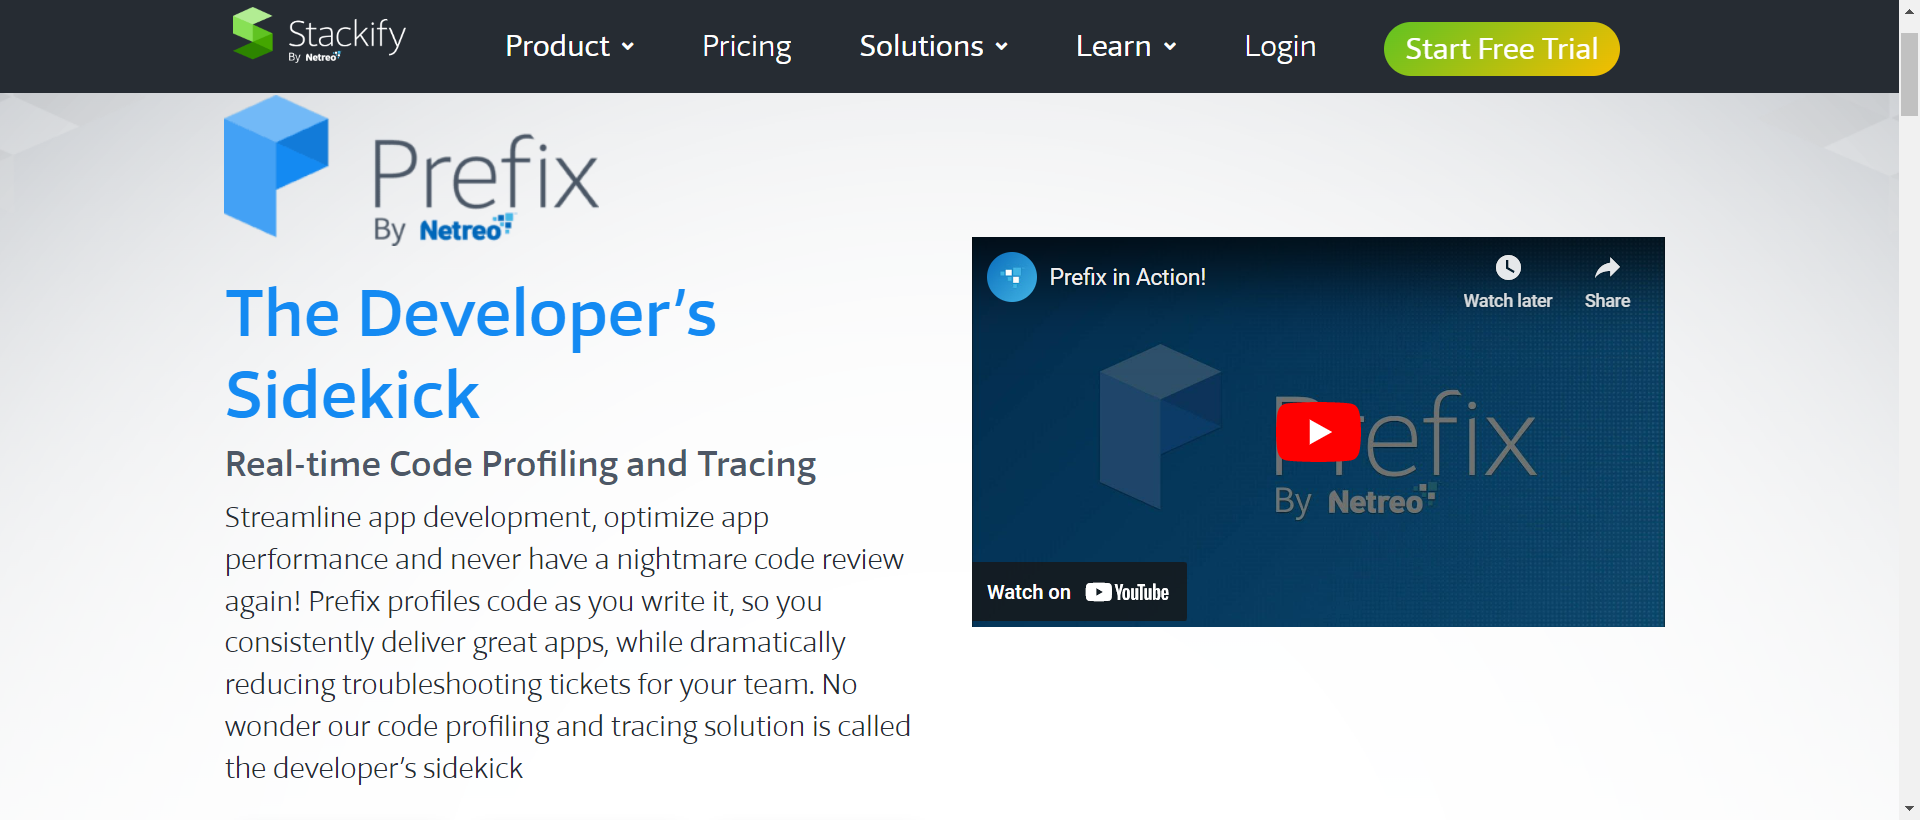
2. Stackify Prefix
Stackify Prefix lets you see the performance of all your web requests, SQL queries, and other method calls in real time. Additionally, it provides detailed metrics such as method execution time, database query performance, and memory usage. It can also identify and alert on performance bottlenecks, exceptions, and slow database queries.
Prefix can be used to diagnose and troubleshoot performance issues in development, staging, and production environments.
It works with a wide range of Java frameworks and platforms, including Spring, Hibernate, and Tomcat.
The tool can also be integrated with other Stackify products, such as Retrace and Logify Alert, to provide a comprehensive performance monitoring and troubleshooting solution.
Which one is the best for you?
A profiler working in the development and production environments is entirely different. This is where APM tools become our most confident option.
JVM profilers can be used in the development stage to track any disparities in the critical metric of the application and followed by using an APM tool after running this program. They will give you a complete analysis of how your application is faring in the real world.
Lightweight transaction profilers are a different genre; they don't fit into either of these tools but provide quality information on exactly which method or a function is causing the trouble - since they directly inject them into the code at the beginning of a method.
After reading this article, you might know about profiling and profiler tools. Anyways, to give you a concise overview, we will give out specific stand-out pointers:
- It is always good to check out a profiler tool to maintain your application’s performance smoothly and steadily.
- There are three kinds of profiler tools doing different varieties of profiling activities.
- visualVM tops the list of current favourite profiler tools among developers.
- APM tools are beneficial when you want to measure and contain production environment issues.
- Multiple profiling is the trend right now. First, use a primary tool like visualVM, for an in-depth analysis followed by a clean-up, go for heavier and more focused profiler.
Conclusion
Here, we have looked at three kinds of java profilers: JVM profilers, Lightweight transaction profilers, and APM tools. These profilers help us identify various bottlenecks in our java application.
They tend to have slight differences when it comes to their working styles. For example, some give an in-depth analysis of all the components (like JVM profilers). In contrast, others (like LWT) focus on a particular aspect and give us insights into its performance.
Also, profilers suitable for the development environment and production environment are different. For example, JVM is best in the development stage but go for APM tools when assessing application performance.
Monitor your Java application for errors & exceptions with Atatus
With Atatus Java performance monitoring, you can monitor the performance and availability of your Java application in real-time and receive alerts when issues arise. This allows you to quickly identify and troubleshoot problems, ensuring that your application is always running smoothly.
One of the key features of Atatus is its ability to monitor the performance of your Java application down to the individual request level. This allows you to see exactly how long each request is taking to process, as well as any errors or exceptions that may have occurred. You can also see a breakdown of the different components of your application, such as the web server, database, and external services, to see how they are affecting performance.
In addition to monitoring performance, Atatus also allows you to track the availability of your Java application. This means that you can see when your application is down or experiencing errors, and receive alerts when this occurs. You can also see how long your application has been running, as well as any uptime or downtime trends over time.
Atatus also offers a range of tools and integrations that can help you to get the most out of your monitoring. For example, you can integrate Atatus with popular tools like Slack, PagerDuty, and Datadog to receive alerts and notifications in your preferred channels. You can also use Atatus's APIs and SDKs to customize your monitoring and build custom integrations with your own tools and systems.
Overall, Atatus is a powerful solution for monitoring and managing the performance and availability of your Java application. By using Atatus, you can ensure that your application is always running smoothly and that any issues are quickly identified and resolved.
If you are not yet a Atatus customer, you can sign up for a 14-day free trial .
#1 Solution for Logs, Traces & Metrics
![]() APM
APM
![]() Kubernetes
Kubernetes
![]() Logs
Logs
![]() Synthetics
Synthetics
![]() RUM
RUM
![]() Serverless
Serverless
![]() Security
Security
![]() More
More


![New Relic vs Splunk - In-depth Comparison [2025]](/blog/content/images/size/w960/2024/10/Datadog-vs-sentry--19-.png)