A Beginner's Guide to Use journalctl Commands

journalctl is a command-line utility in Linux systems that allows users to query and view logs collected by systemd's logging service, known as the journal.
This logging service captures a wide range of system events, including kernel messages, service status changes, user logins, and more, providing a complete view of system activity.
Users can use journalctl to filter logs based on various standards such as time range, severity level, specific units (system services), or even custom fields.
This enables users to quickly identify and troubleshoot issues within their Linux systems. journalctl provides options for formatting output, navigating through logs efficiently, and exporting logs for further analysis, making it a valuable tool for anyone responsible for managing Linux-based systems.
In this blog, we will learn the basic journalctl commands and their usage, allowing beginners to effectively advantage of this tool for monitoring and troubleshooting tasks in Linux environments.
- What is journalctl?
- How journalctl works?
- Why do we use journalctl?
- Viewing Logs using journalctl
- Advanced Filtering using journalctl
- Formatting Output of journalctl
- Real-time Monitoring
What is journalctl?
journalctl is a command-line utility used in Unix-like operating systems, particularly those using systemd as their init system, to access and handle system log data stored by the systemd journal service.
The systemd journal service, introduced as part of the systemd system and service manager, provides a centralized logging system for capturing and managing log messages generated by the operating system, kernel, and user-level processes.
How journalctl works?
- Centralized Logging System: journalctl interacts with the systemd journal service, which serves as a centralized logging system. Unlike traditional logging systems that depend on text files scattered across various locations, the systemd journal consolidates log data into a structured binary format stored in a central location.
- Structured Log Entries: The systemd journal stores log entries in a structured format that includes metadata such as timestamps, hostnames, process IDs (PIDs), unit names (e.g., service names), log levels, and other relevant information. This structured format provides efficient storage, retrieval, and analysis of log data.
- Real-time Access: journalctl provides real-time access to log data, allowing users to view log entries as they are generated. This capability is especially useful for monitoring system activity, diagnosing issues, and responding to events in real-time.
- Effective Filtering and Querying: journalctl offers effective filtering and querying capabilities, allowing users to retrieve specific subsets of log data based on various criteria. Users can filter logs by time range, log levels (e.g., errors, warnings), specific units (e.g., systemd services), process IDs (PIDs), and more.
- Flexible Output Formatting: journalctl supports flexible output formatting options, allowing users to customize the display of log entries according to their preferences. Users can adjust the output format to include or exclude specific fields, choose between different timestamp formats, and control output redundancy.
- Integration with systemd Services: As part of the systemd, journalctl integrates with other systemd utilities and services. It can retrieve log data associated with systemd units (e.g., services, timers, sockets), making it easier to correlate log messages with specific system components and events managed by systemd.
- Administrative and Debugging Tool: journalctl is an essential administrative and debugging tool for system administrators, developers, and users of Unix-like operating systems. It facilitates troubleshooting, performance analysis, security monitoring, and auditing tasks by providing comprehensive access to system log data.
Why do we use journalctl?
Logging systems mostly store logs in plain text files spread across various directories. This can make it difficult to search, filter, and analyze logs. Systemd's journal service also stores logs in a binary format indexed by time and metadata, providing faster and more effective access to log data.
journalctl provides a user-friendly interface to query and retrieve logs from the journal, allowing system administrators and developers to:
- View Logs: Display logs in real time.
- Filter Logs: Filter logs based on various criteria such as time, units (system services), priorities, and more.
- Search Logs: Search for specific keywords or patterns within log messages.
- Format Output: Customize the output format to suit specific needs.
- Monitor Logs: Monitor logs in real-time for ongoing system activity.
Viewing Logs using journalctl
journalctl allows users to query and view logs from the systemd journal, which is a centralized logging system. A brief explanation of how to use journalctl to view logs:
1. Displaying Logs
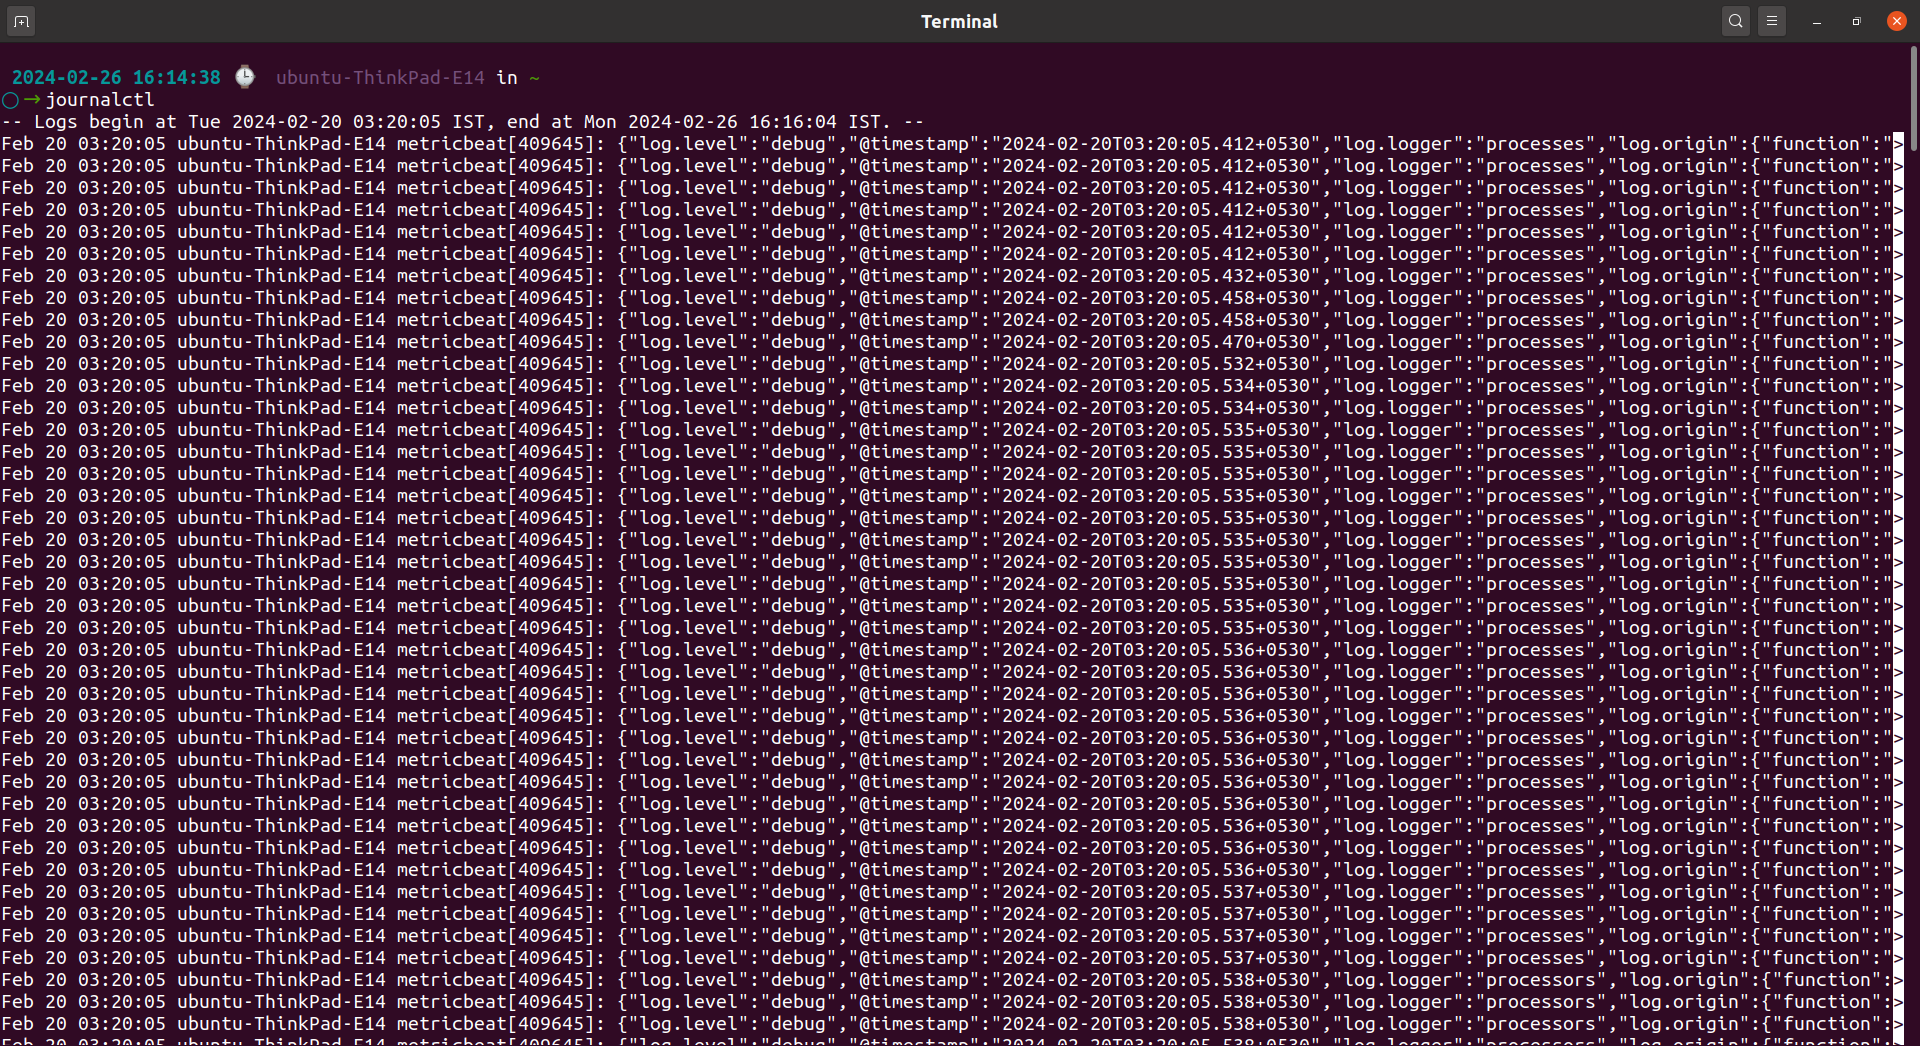
To display logs using journalctl, simply run the command without any additional options:
journalctlThis will display logs from the current boot session by default.
Output:
2. Filtering Logs by Time
You can filter logs based on time using various options. Some examples are:
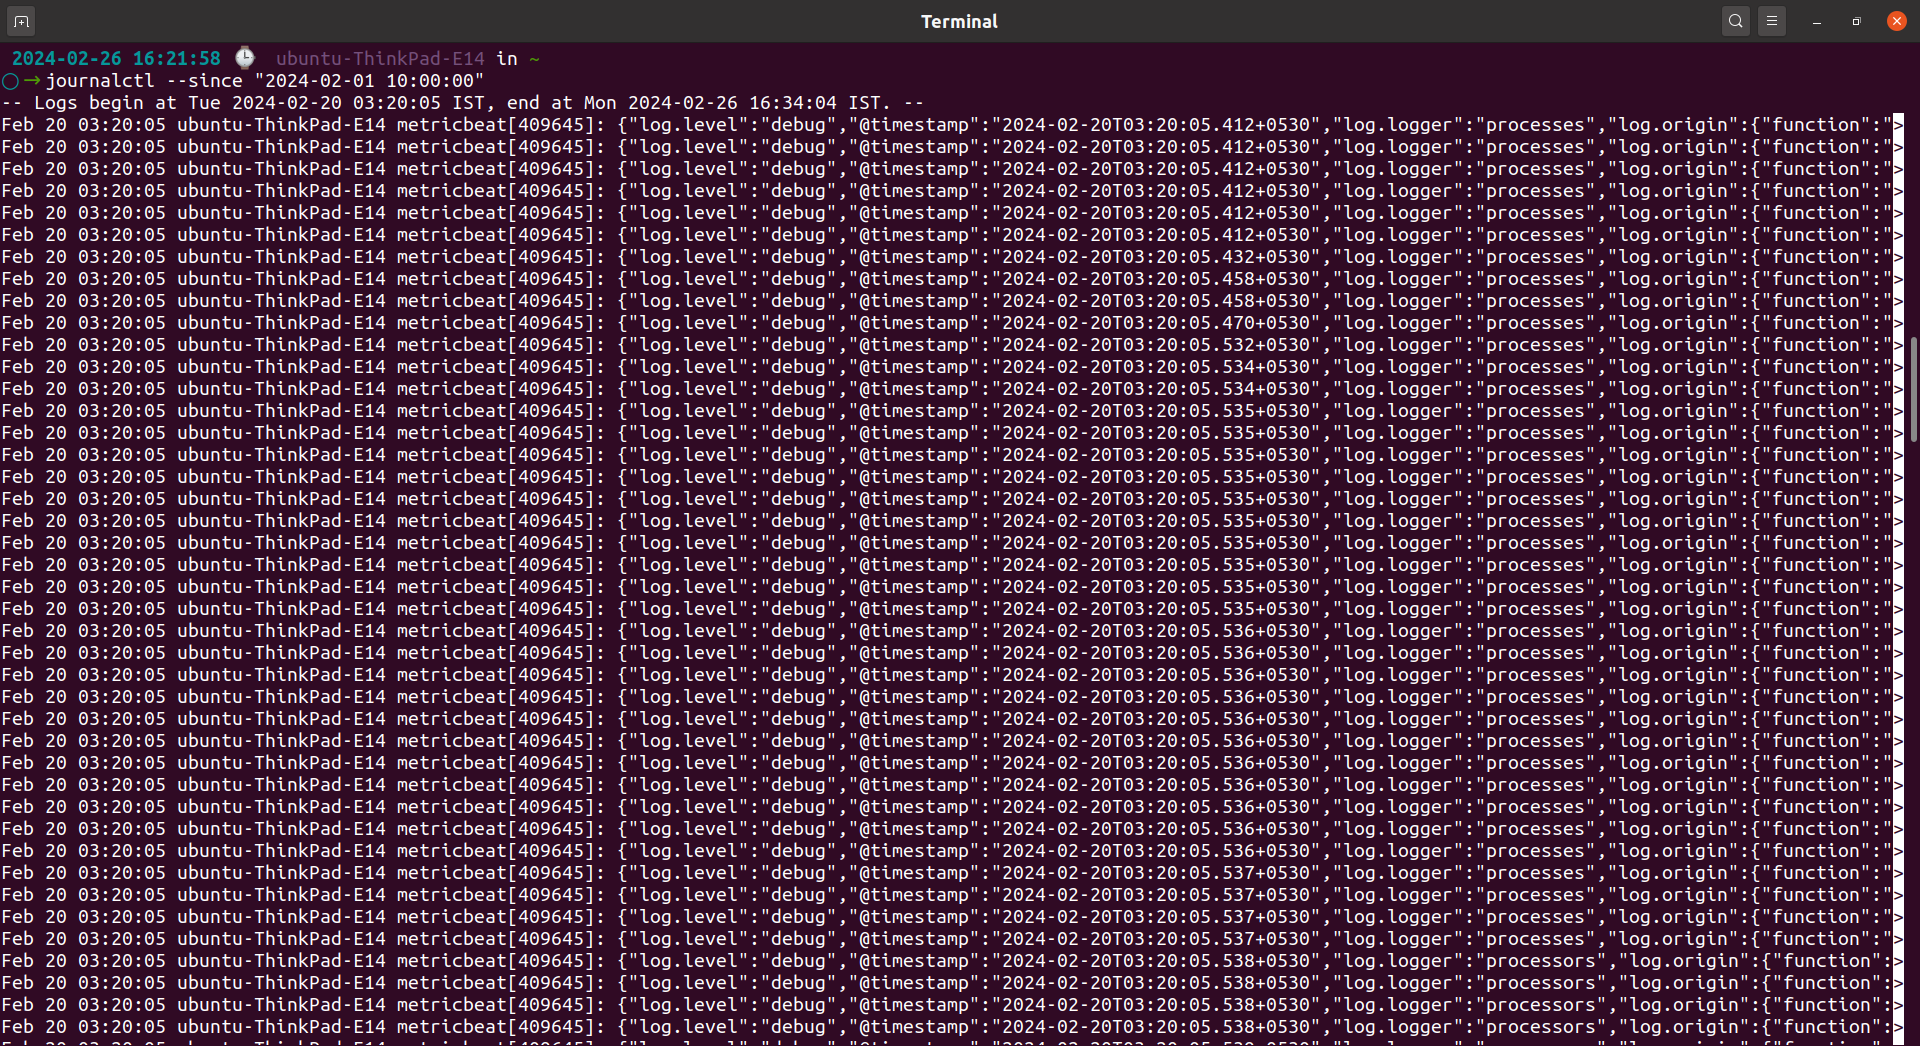
Display logs since a specific time:
journalctl --since "2024-02-01 10:00:00"Output:
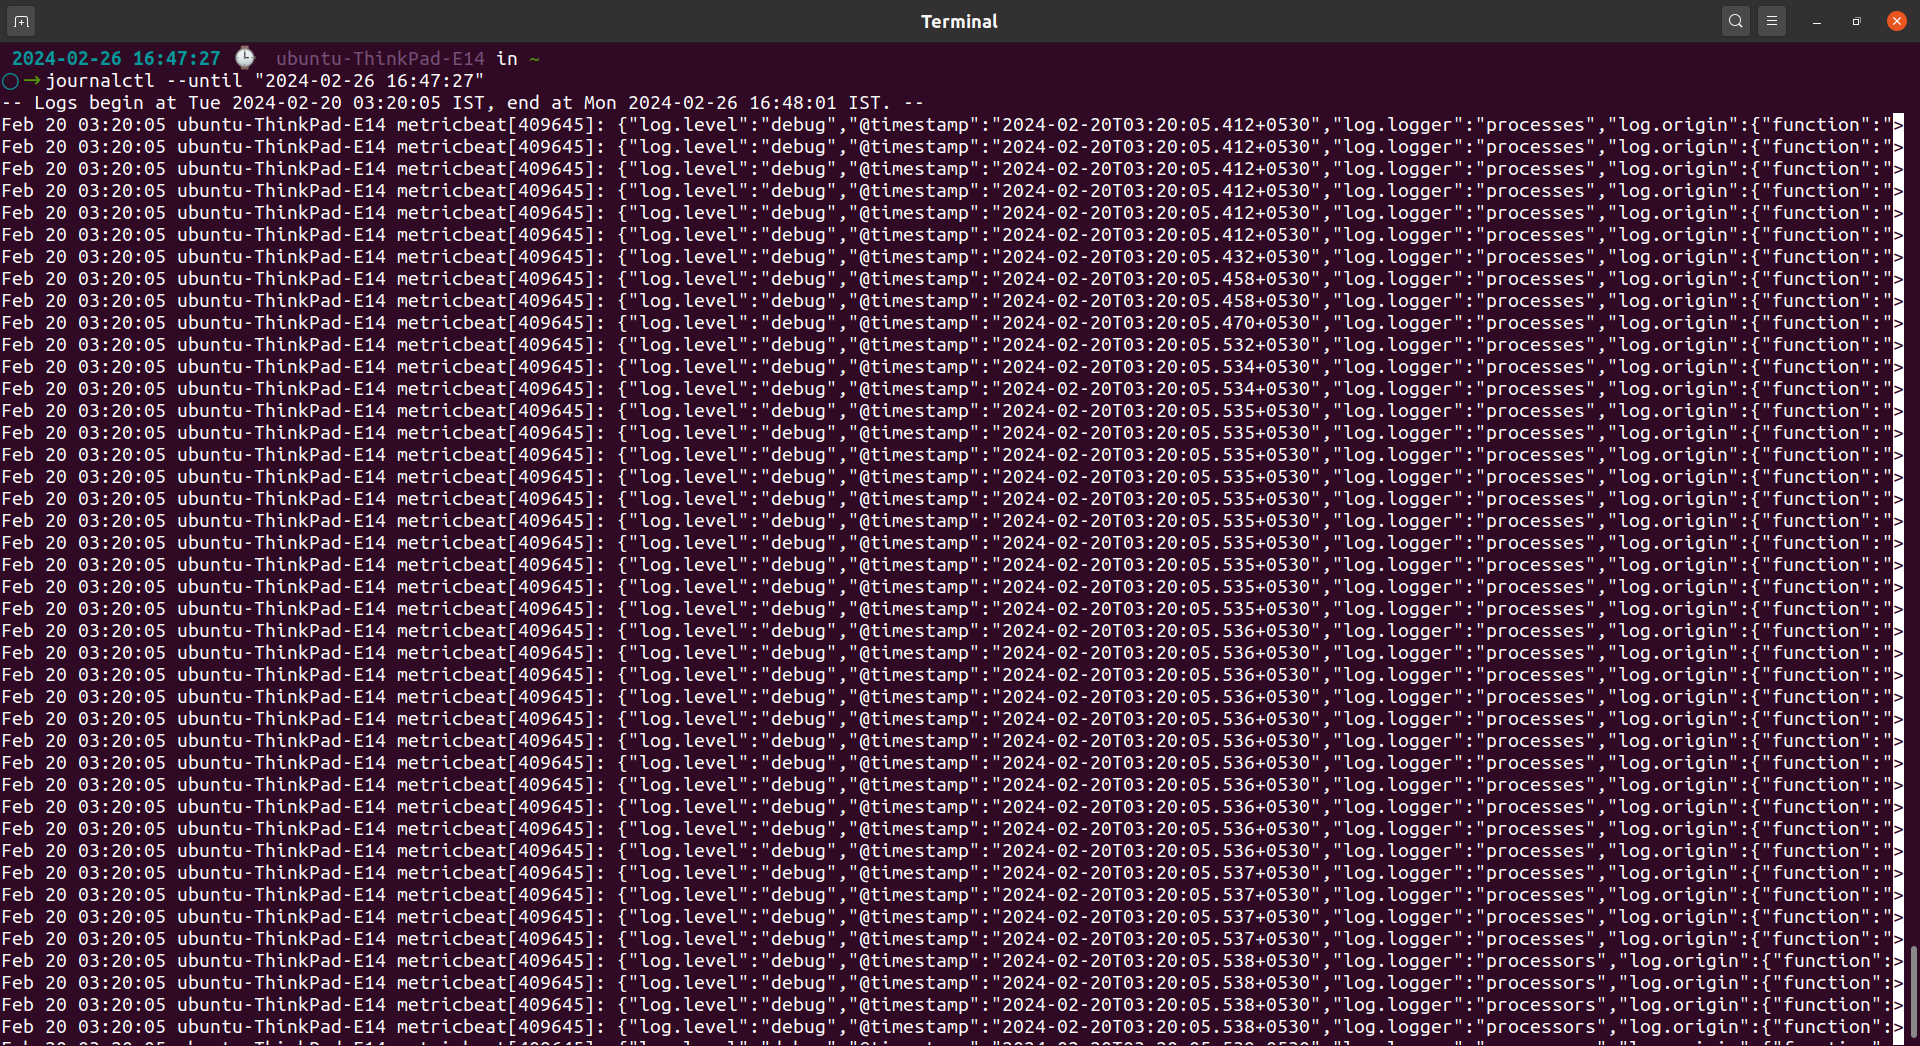
Display logs until a specific time:
journalctl --until "2024-02-26 16:47:27"
Output:
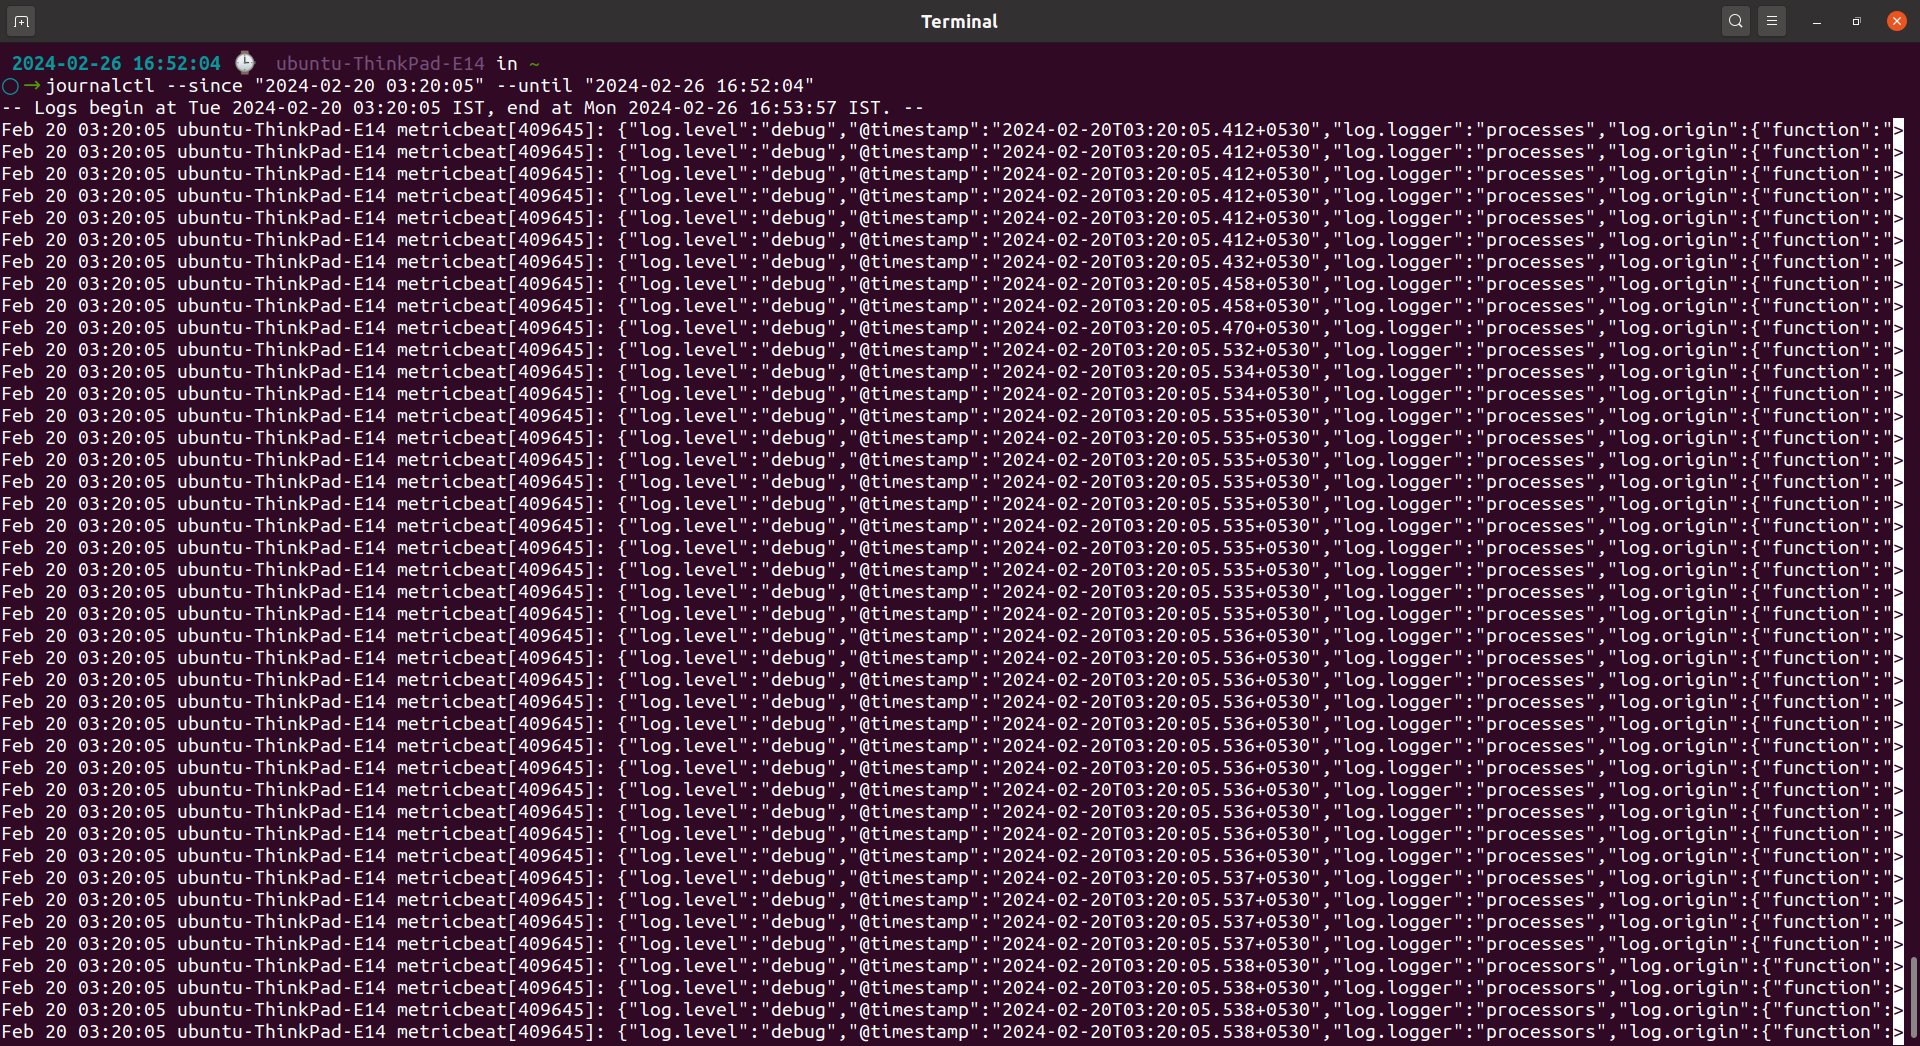
Display logs within a time range:
journalctl --since "2024-02-20 03:20:05" --until "2024-02-26 16:52:04"Output:
3. Filtering Logs by Unit
You can filter logs by specific systemd units (system services) using the `-u` or `--unit` option. For example:
journalctl -u systemd-resolved.service
Output:
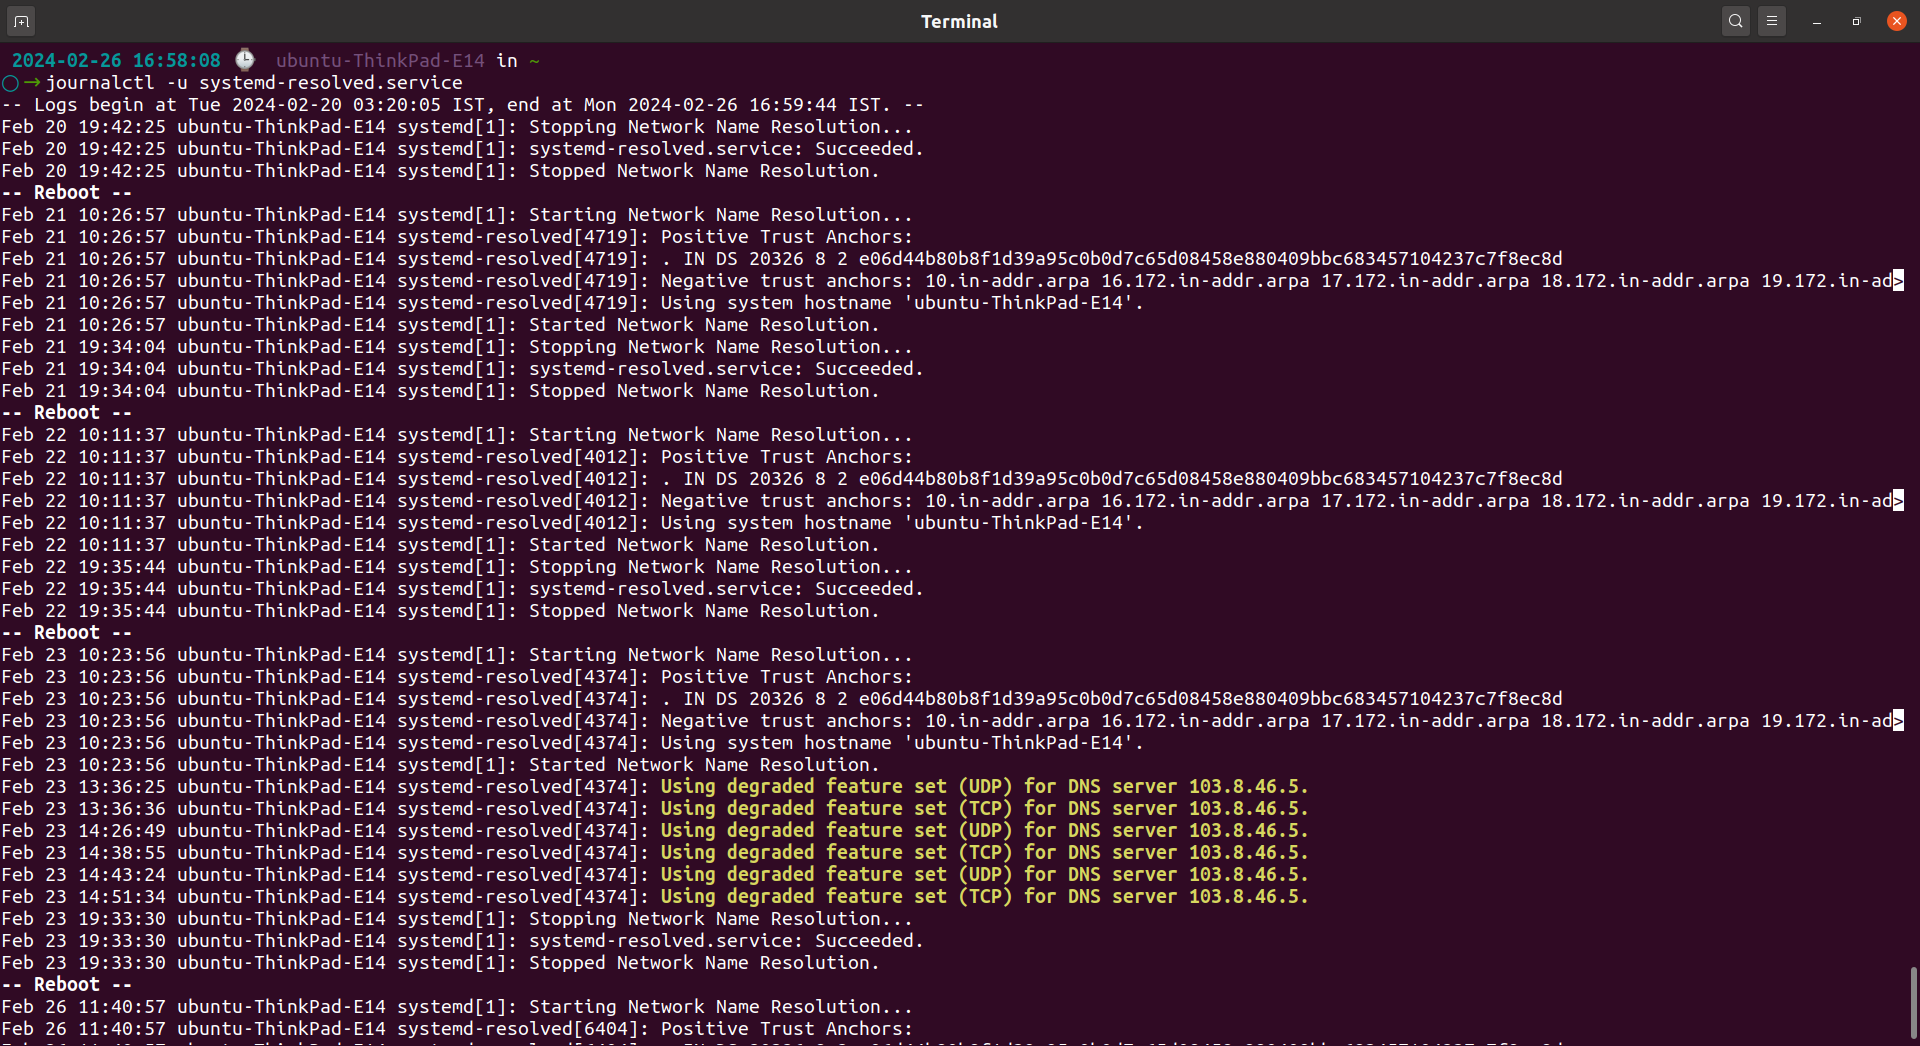
This command retrieves log entries related to the systemd-resolved.service unit, which manages DNS resolution using systemd's integrated DNS resolver (systemd-resolved).
It allows you to view logs specific to DNS resolution activities, DNS caching, and related events, which can be useful for troubleshooting network-related issues or monitoring DNS resolution behavior.
4. Filtering Logs by Priority
Using the `-p` or `--priority` option, you can filter logs by priority levels. Priority levels range from 0 (emergency) to 7 (debug). For example:
journalctl -p errOutput:
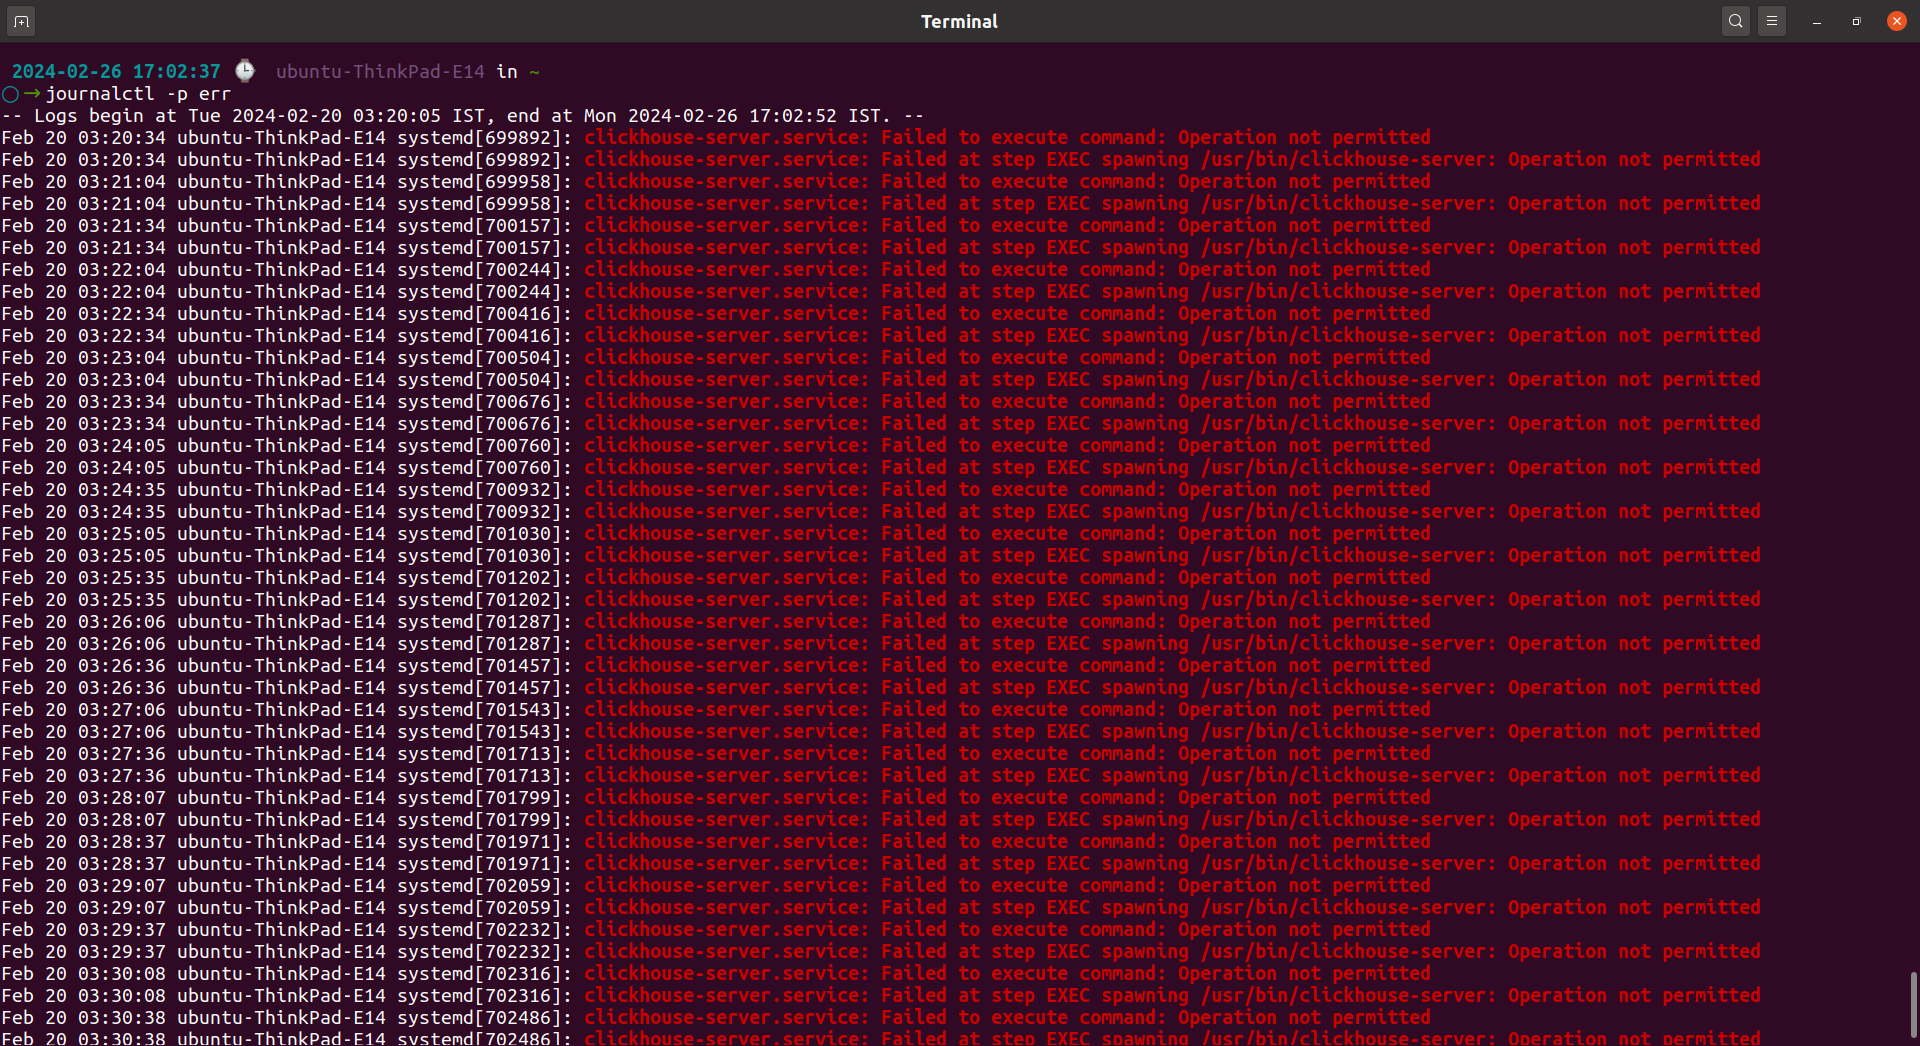
This will display logs with the priority level "err" (error) or higher.
Advanced Filtering using journalctl
Advanced filtering with journalctl allows you to narrow down log entries based on specific criteria, providing a more targeted view of system activity and supporting in troubleshooting. Here are some techniques for advanced filtering:
1. Filtering by Boot
Filtering logs by boot sessions allows you to isolate logs from specific system boots, which is useful for diagnosing issues that occur during particular boot sessions. Each boot session in the journal is allocated a unique identifier, which can be used for filtering.
To display logs from a specific boot session, use the `-b` or `--boot` option followed by the boot identifier. For example:
journalctl -b 0Output:
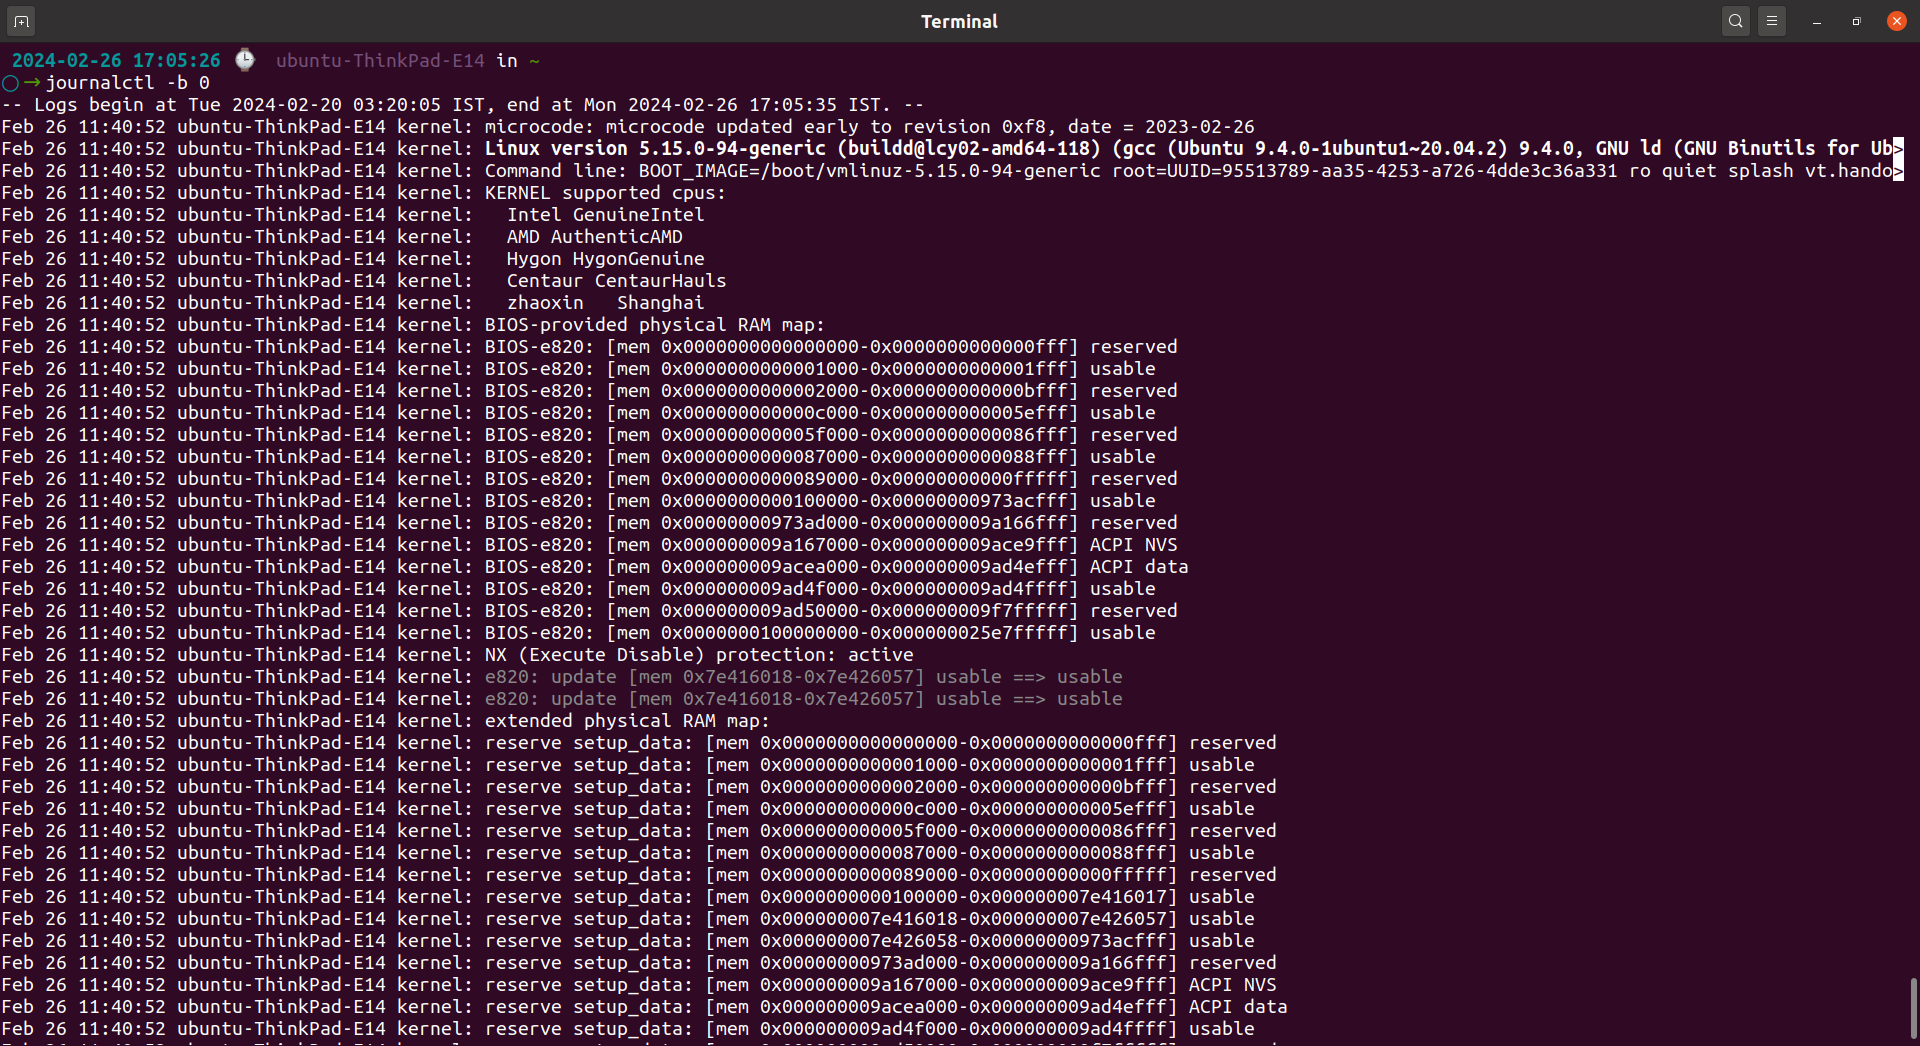
This command displays logs from the current boot session.
2. Filtering by Process ID (PID)
Filtering logs by Process ID (PID) lets you focus on logs related to specific processes running on the system. This can be helpful when troubleshooting issues related to particular processes.
To filter logs by PID, use the `-P` or `--pid` option followed by the PID. For example:
journalctl _PID=1Output:
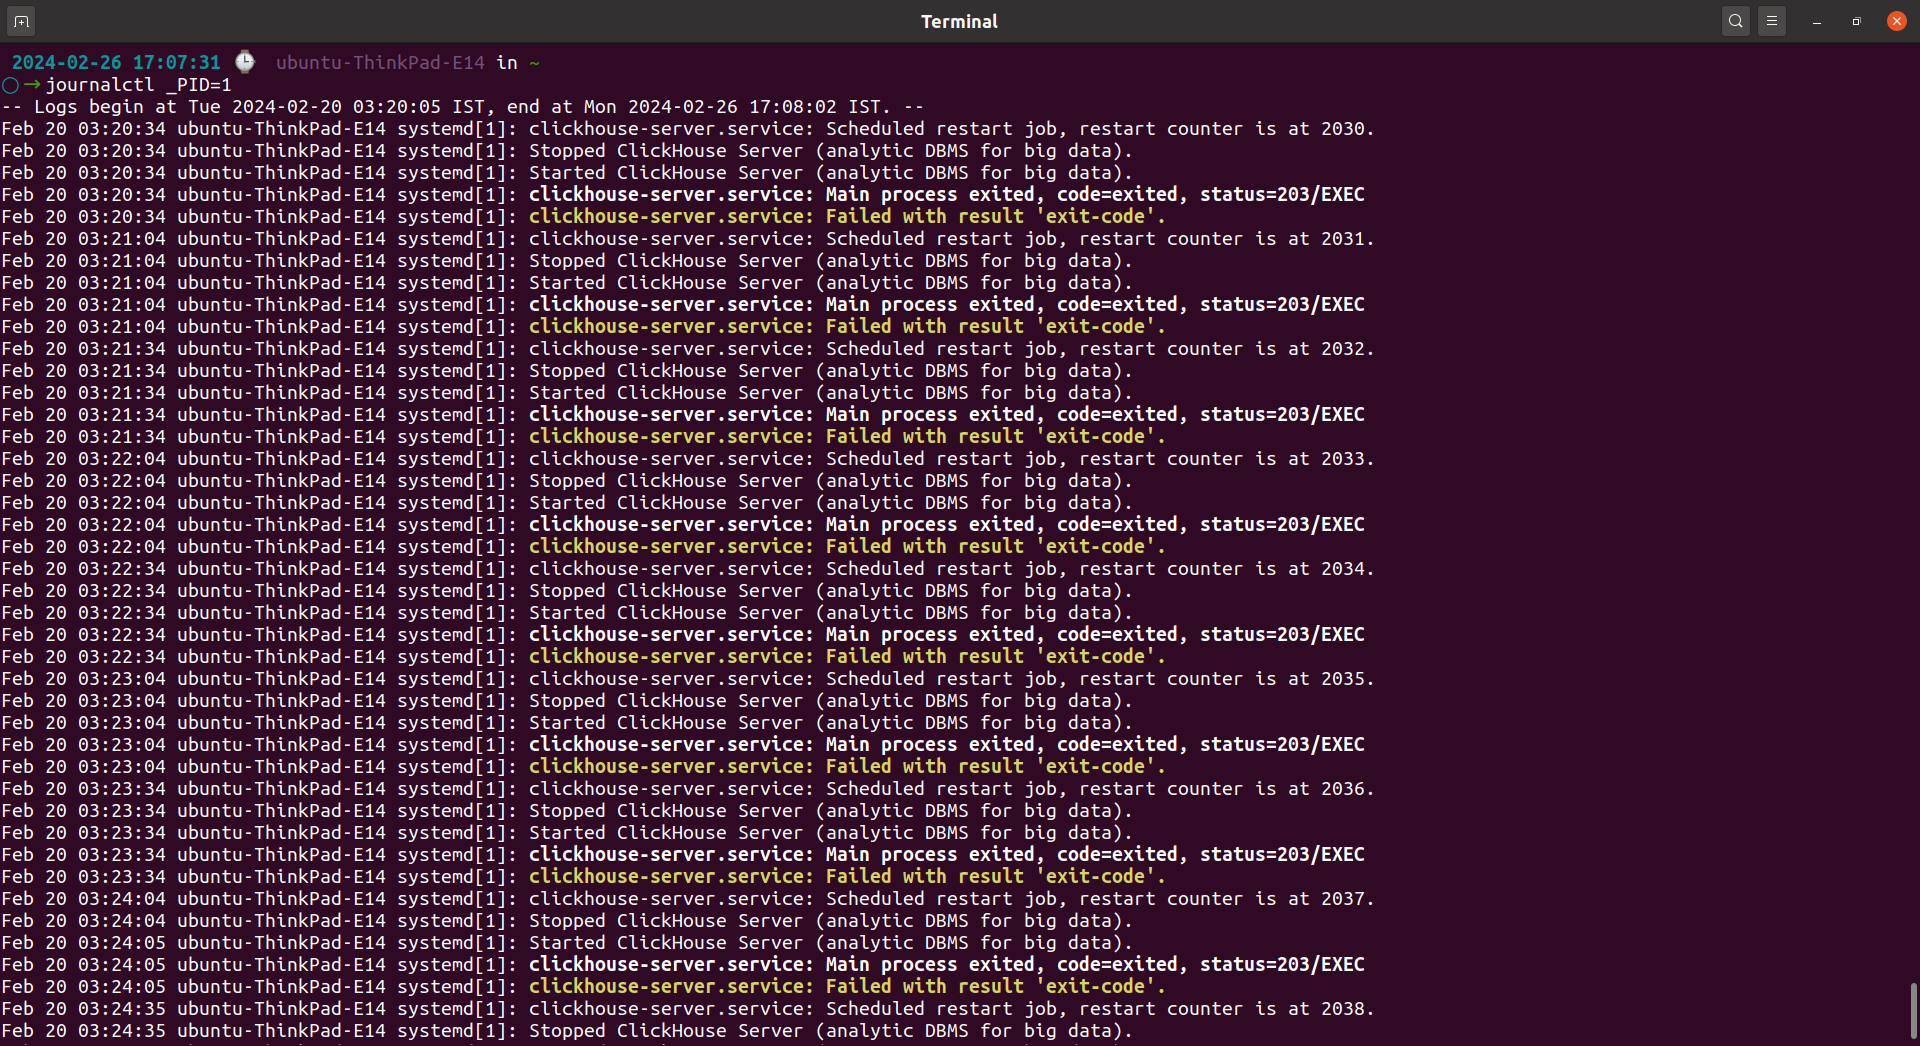
This command retrieves log entries associated with process ID 1, which is typically the PID of the systemd init process. Viewing logs for the systemd init process can provide perception into system initialization, service management, and other essential system events captured by systemd.
By mastering these advanced filtering techniques with journalctl, you can efficiently navigate through system logs and pinpoint relevant information for troubleshooting and analysis.
Formatting Output of journalctl
Formatting the output of `journalctl` can improve readability and facilitate analysis of system logs. Let’s take a look at customization and exporting logs.
1. Customizing Output Format
Customizing the output format of `journalctl` allows you to adjust the display of log entries to suit your preferences and requirements. Some common customization options include:
-
Time Format: Adjusting the format of timestamps to show date and time in a specific format, such as ISO 8601 (
--output-short) or human-readable format (--output=short-iso). -
Field Selection: Choosing which fields to include in the output, such as timestamp, priority, message, or specific metadata fields like unit name (
--output-fields=). -
Output Style: Selecting the style of output, such as terse (
--output terse), short (--output short), short with full timestamps (--output short-precise), or full (--output verbose). -
Filtering Column: Specifying which columns to display and in what order, allowing you to focus on relevant information and declutter the output (
--output-fields=). -
Colorization: Enabling or disabling colorized output for improved readability (
--output-color=).
2. Exporting Logs
Exporting logs from `journalctl` allows you to save log entries to external files for archival, sharing, or further analysis. `journalctl` provides several methods for exporting logs, including:
-
Save to File: Redirecting the output of
journalctlto a file using standard shell redirection (>or>>), allowing you to save logs in plain text format for future reference (journalctl > logs.txt). -
Export to JSON: Outputting log entries in JSON format (
--output=json), which can be useful for processing logs programmatically or integrating with other tools and systems. -
Export to Syslog Format: Converting journal entries to Syslog format (
--output=syslog), which may be required for compatibility with certain log analysis tools or systems. -
Remote Export: Exporting logs remotely to another system or server using the
-oor--output=option combined with SSH or other remote access methods.
Real-time Monitoring
Real-time monitoring is an essential factor of system administration, allowing administrators to stay informed about system activity and promptly respond to issues as they arise. journalctl provides powerful tools for real-time monitoring of system logs, enabling administrators to observe and analyze log entries as they are generated.
1. Continuous Output
Continuous output mode in journalctl allows administrators to continuously monitor system logs in real-time by displaying a live stream of log messages. This mode is particularly useful for monitoring system events and diagnosing issues as they occur.
To initiate continuous output mode with journalctl, simply use the -f or --follow option:
journalctl -fOutput:
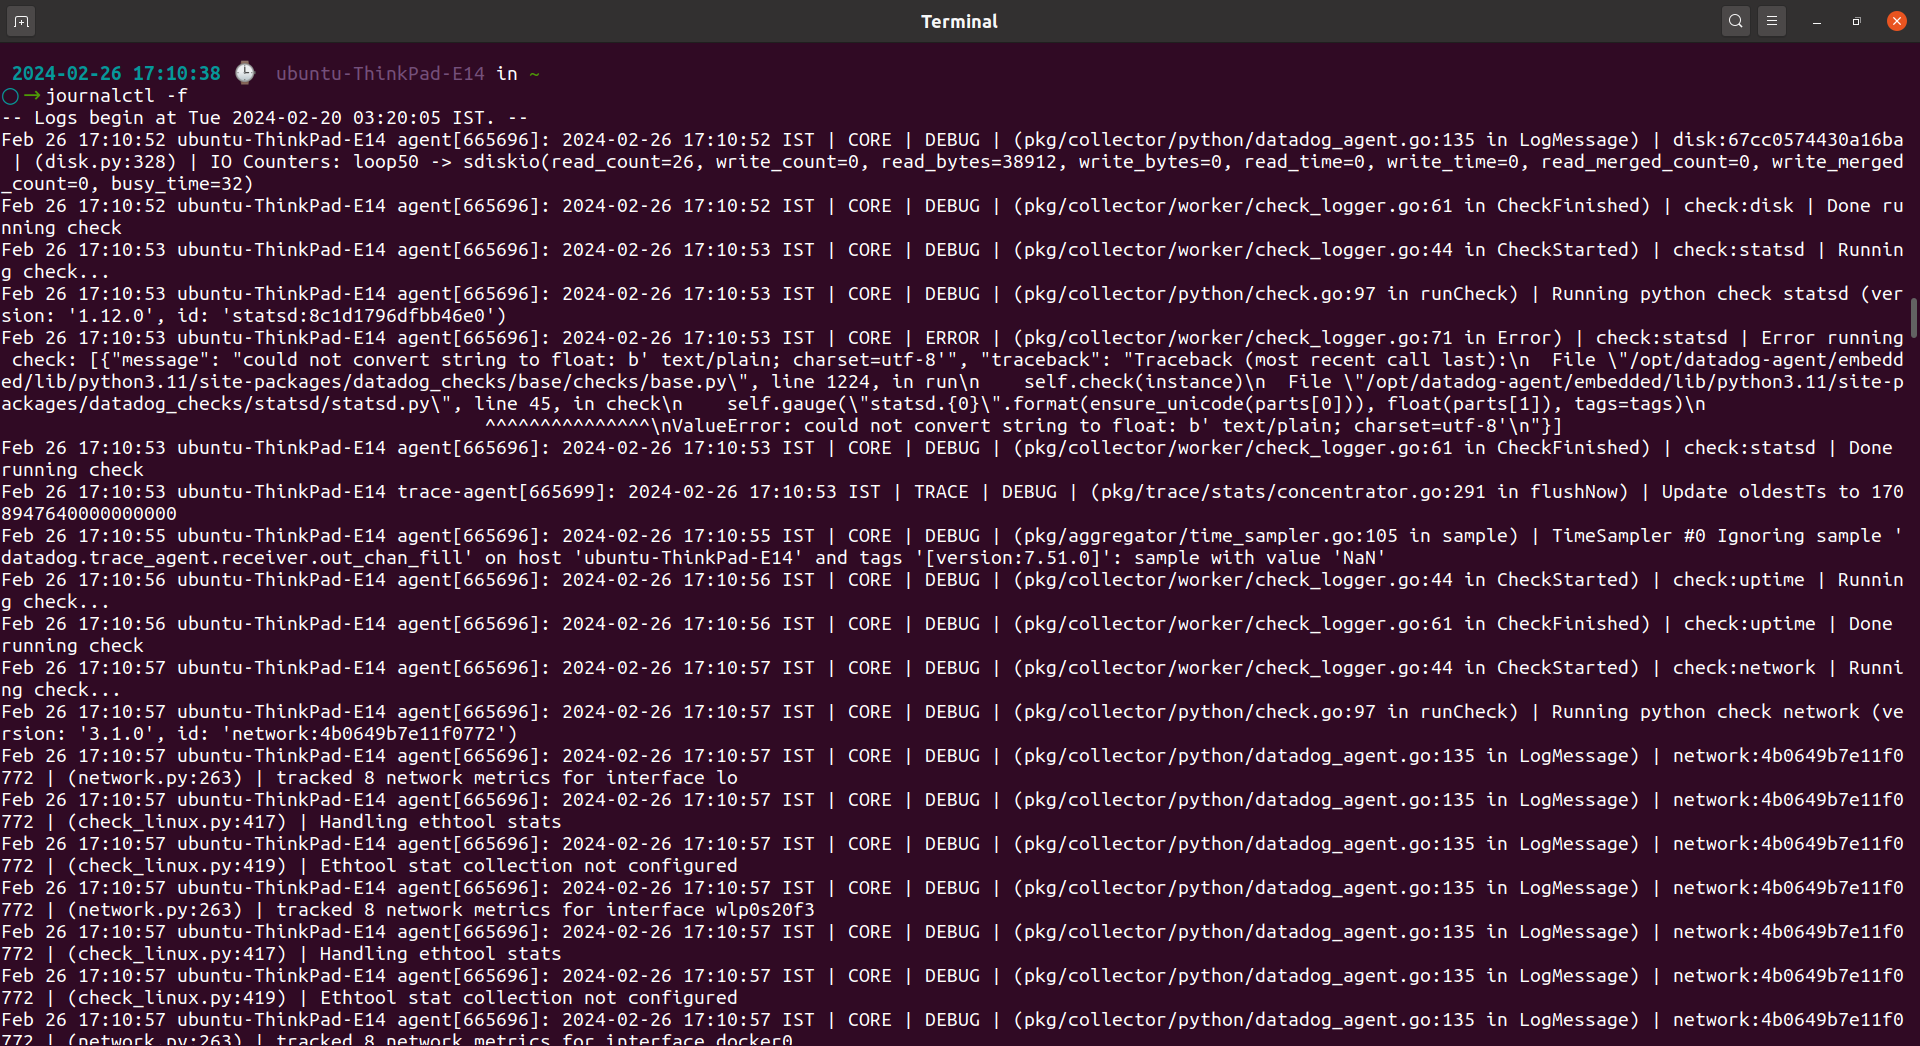
This command continuously displays new log entries as they are appended to the journal, allowing administrators to monitor system activity in real time.
Continuous output mode is invaluable for monitoring system health, detecting exceptions, and responding promptly to important events such as service failures, resource shortages, or security incidents.
2. Following Logs
Following logs with journalctl is another method of real-time monitoring that automatically updates the display as new log entries are added to the journal. This feature is particularly useful when analyzing logs over an extended period or tracking changes in system behavior.
To follow logs with journalctl, use the -f or --follow option along with the --output option to specify the desired output format. For example:
journalctl -f --output=shortOutput:
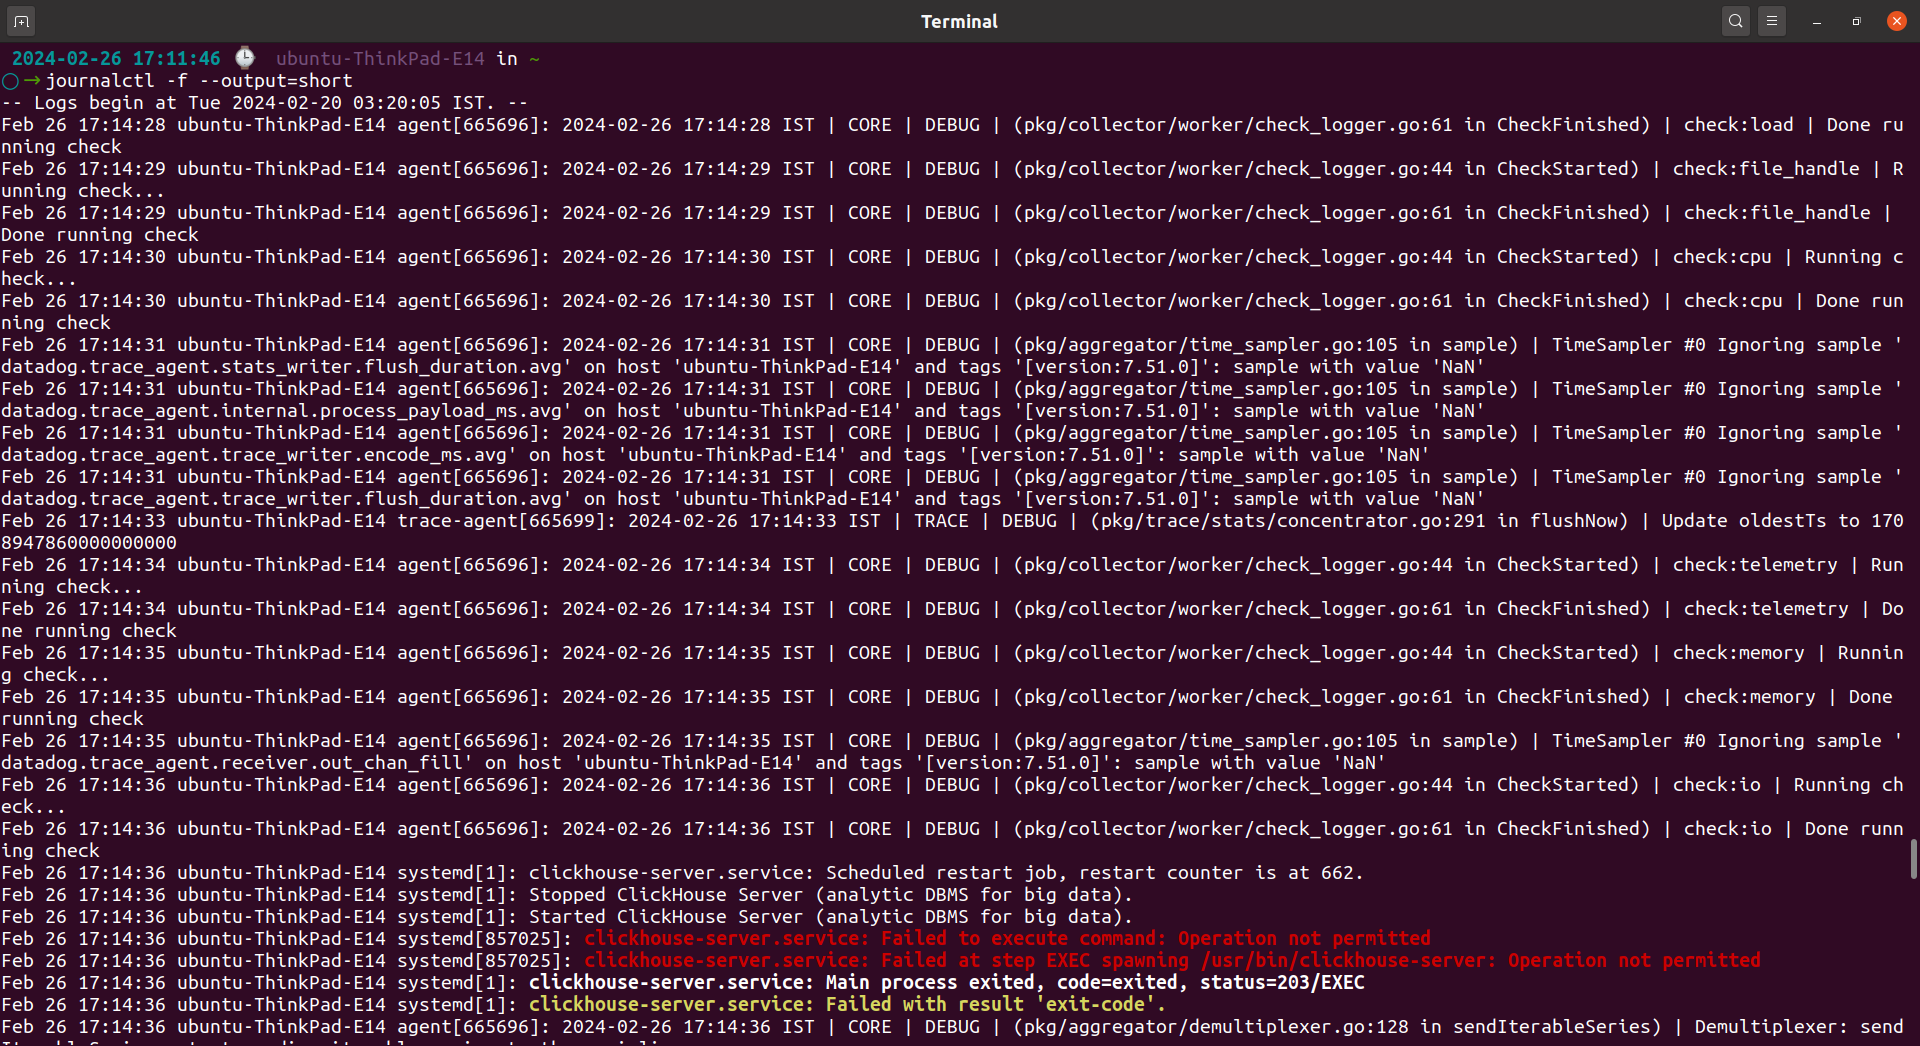
This command follows the journal in real-time and displays log entries in a concise format, to track changes and identify patterns.
Following logs with journalctl is beneficial for monitoring system events, tracking the progress of system tasks, and diagnosing issues that may occur over time. By observing log entries as they are generated, administrators can gain a perception of system behavior and identify potential issues before they escalate.
Conclusion
This beginner's guide is a foundational resource for users starting with journalctl commands. By learning the techniques covered in this blog, users can easily navigate system logs, troubleshoot issues, monitor system activity in real time, and extract valuable perceptions from system logs for effective system administration and maintenance.
As you continue to explore journalctl commands and gain experience, you'll discover its flexibility and utility in managing system logs, diagnosing issues, and providing the smooth operation of Unix-like operating systems.
Practicing and experimenting are key to mastering journalctl commands, so do not hesitate to explore further and apply what you've learned.
Happy logging with journalctl!
Atatus Logs Monitoring and Management
Atatus offers a Logs Monitoring solution which is delivered as a fully managed cloud service with minimal setup at any scale that requires no maintenance. It monitors logs from all of your systems and applications into a centralized and easy-to-navigate user interface, allowing you to troubleshoot faster.

We give a cost-effective, scalable method to centralized logging, so you can obtain total insight across your complex architecture. To cut through the noise and focus on the key events that matter, you can search the logs by hostname, service, source, messages, and more. When you can correlate log events with APM slow traces and errors, troubleshooting becomes easy.
#1 Solution for Logs, Traces & Metrics
![]() APM
APM
![]() Kubernetes
Kubernetes
![]() Logs
Logs
![]() Synthetics
Synthetics
![]() RUM
RUM
![]() Serverless
Serverless
![]() Security
Security
![]() More
More