If you work as a software developer, you know how important application logging is, and logging levels are an essential part of that. A timestamp, a message, and sometimes additional information, such as an exception's stack trace, are typically included in log entries. Those details are useful because they help someone reading the log entry to figure out how the application performed in the production.
We will go over the following:
- What are Log Levels?
- Log Levels History
- Log Levels Explained
- How does Log Levels Work?
- Why Log Levels are Important?
What are Log Levels?
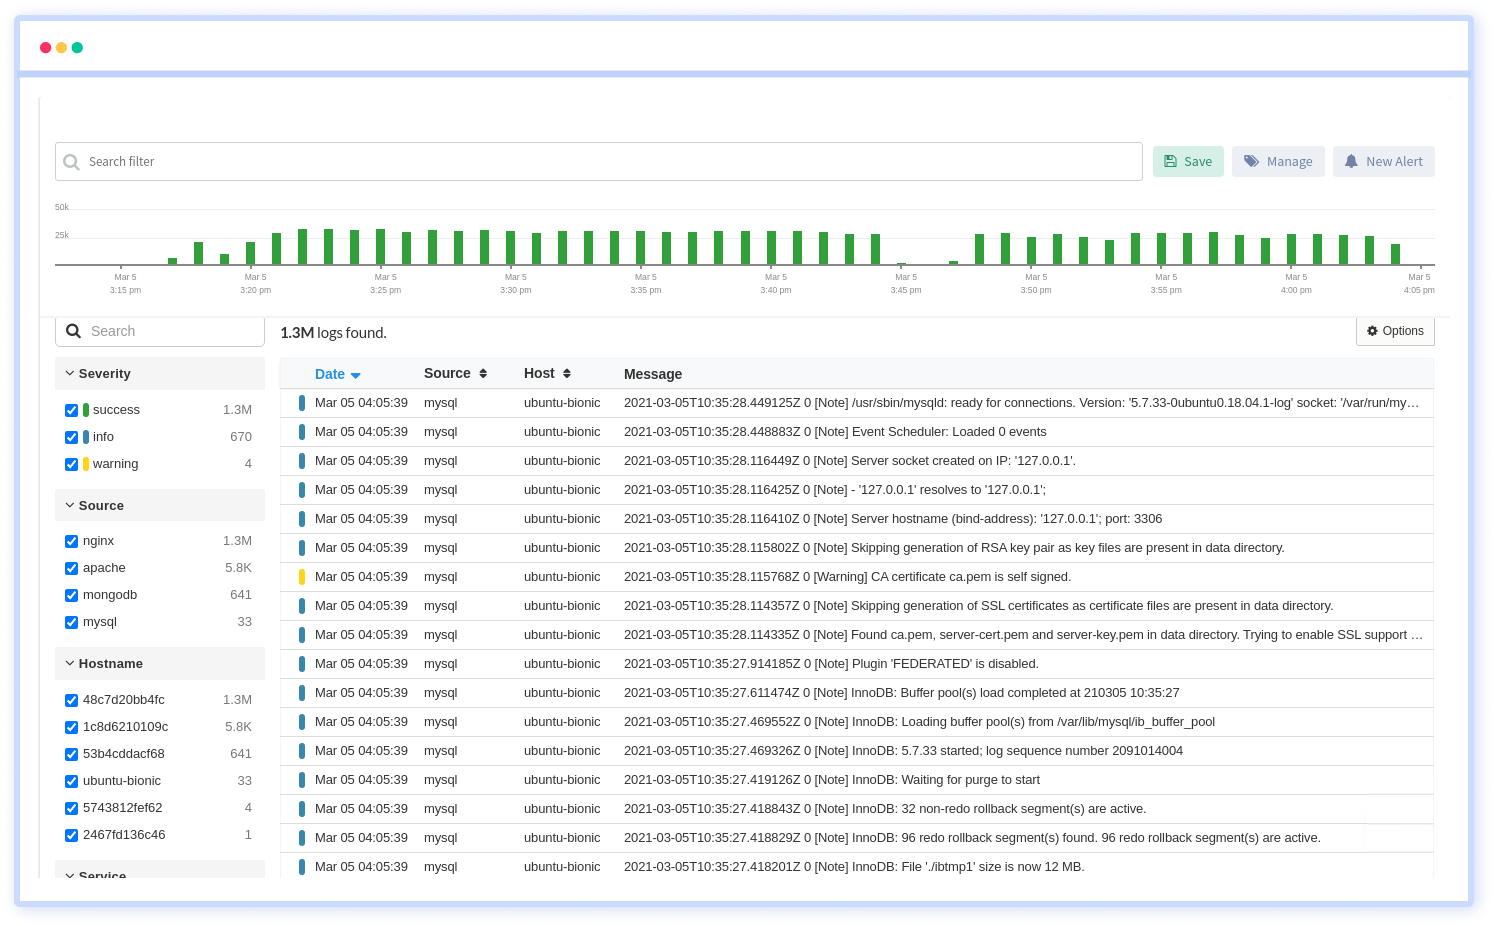
A log level, often known as a log severity, is a piece of data that indicates the importance of a particular log message. Within your log management system, a log level is set up as an indicator that captures the importance and urgency of all entries in the logs. They can tell you whether some events require immediate attention or if you can go about your day as usual.
The IT team can also utilise logging levels as a filter to swiftly sort through all log events and focus on the most essential ones.
Log management can be difficult for businesses to implement properly and successfully. In the log management process, it's crucial to set up relevant log levels. Team members who access and read logs can grasp the relevance of the message they see in the log or observability tools they're using due to logging levels.
It's a simple yet effective method of identifying log events from one another. If your application uses log levels correctly, all you have to do now is a glance at the severity.
You might think of log levels as a technique to distinguish between important and just informative information about your system's condition. The log levels can aid in the reduction of information noise and the alleviation of alert fatigue.
Log Levels History
In the 1980s, a project called Sendmail introduced log levels. The Sendmail project was created by Eric Allman. The owners of the project required a logging solution, which led to the development of a System Logging Protocol (Syslog) server and the concept of severity levels.
Syslog was eventually adopted by a variety of applications and has since evolved into a standard protocol for transmitting system logs and event notifications to the Syslog server.
Programming languages have changed throughout time. The development of logging into application frameworks like log4net achieved the same. Log4net allows programmers to send log messages to a variety of destinations without having to change the application's code.
Severity levels were also introduced, and are still used in logging levels today. Emergency, critical, alert, error, warning, debug, informational, and notice are the severity levels.
For storing data in multiple formats, each programming language has its own logging structure. You can send the data to a variety of locations, including text files, in this manner. Aside from the numerous destinations and formats, it's vital to recognise the significance of the logging event level in this process.
Log Levels Explained
FATAL, ERROR, WARN, INFO, DEBUG, TRACE, ALL, and OFF are the most common logging levels. Some are significant, while others are secondary, and yet others are meta-considerations.
The following is the standard logging level ranking:

ALL
Any logging levels that have been configured are logged at this log level. It logs everything and allows you to set custom logging levels. It's the result of adding all of the other logging levels together.
TRACE
The TRACE log level records all of the application's behaviour details. Its purpose is primarily diagnostic, and it is more granular and finer than the DEBUG log level. When you need to know what happened in your application or the third-party libraries you're using, utilise this log level. The TRACE log level can be used to query code parameters or analyse algorithm steps.
DEBUG
You are providing diagnostic information in a thorough manner with DEBUG. It's long and contains more information than you'll need when using the application. The DEBUG logging level is used to retrieve data that is required to debug, troubleshoot, or test an application. This guarantees that the application runs smoothly.
INFO
INFO messages are similar to how applications normally behave. They describe what occurred. For example, if a specific service was stopped or started, or if something was added to the database. During normal operations, these entries are unimportant. The information written in the INFO log is usually useful, and you don't have to do anything with it.
WARN
When an unexpected application issue has been identified, the WARN log level is used. This indicates that you are unsure if the issue will recur or not. At this time, you may not notice any negative effects on your application. This is frequently an issue that prevents some processes from operating. However, this does not necessarily imply that the application has been affected. The code should, in fact, continue to function normally. If the issue recurs, you should examine these warnings at some point.
ERROR
This ERROR indicates that something critical in your application has failed. This log level is used when a serious issue is preventing the application's functionalities from functioning properly. The application will continue to run for the most part, but it will need to be handled at some point.
FATAL
FATAL indicates that the application is about to prevent a major problem or corruption. The FATAL level of logging indicates that the application's situation is critical, such as when a critical function fails. If the application is unable to connect to the data store, for example, you can utilise the FATAL log level.
OFF
Nothing is logged at this log level. This OFF level is the highest possible rating and is used to switch off logging. Nothing is logged at this level of logging.
How does Log Levels Work?
They don't work on their own, to be sure. They are labels with an aim of providing information. They're in the log message to give you information. The log levels indicate the significance of a certain event.
Should you get out of bed straight away to deal with a major issue, or should you wait until the morning? When the patch will be ready and distributed? And the world isn't going to end in a couple of hours?
You may simply limit the data written to the log destination of your choice when used in conjunction with a logging framework. You effectively limit all less important log levels to be disregarded when you set the log level that you are interested in in your logging framework.
If you set the root logging level to WARN in your logging framework, you'll only get log events with the WARN, ERROR, and FATAL levels.
Why Log Levels are Important?
The thing that comes to mind first is filtration. Finding the information you require can be like looking for a needle in a haystack once you have a large number of log entries. However, this does not have to be the way and it won't be if you've set up logging levels that let you quickly filter and distinguish between a fatal error that caused your application to crash and a routine use statistic.
Logging levels also allow you to customise your logging process to react differently depending on the level you're on. Some of the things you can alter are as follows:
- Granularity
Depending on the level, it might make sense to reduce or enhance logging granularity. - Retention Policy
This has something to do with granularity. If the granularity of a level is larger, it may make sense to delete the log entries in that level more frequently, for example, to save disk space. - Target
Level X entries might be saved to files, while level Y entries might be saved to a database.
Conclusion
When designing an application, it is critical to select the appropriate logging level. This is useful for anyone who uses logs to look for problems, create alarms, troubleshoot, or check the application on a regular basis.
It may not appear to be a significant factor to consider while coding. When dealing with the massive log messages that the systems generate, it is still necessary to make information search, alerting, and filtering as simple as possible. Make sure you select the appropriate logging levels to make your logs helpful.
Atatus Log Monitoring and Management
Atatus is delivered as a fully managed cloud service with minimal setup at any scale that requires no maintenance. It monitors logs from all of your systems and applications into a centralized and easy-to-navigate user interface, allowing you to troubleshoot faster.

We give a cost-effective, scalable method to centralized logging, so you can obtain total insight across your complex architecture. To cut through the noise and focus on the key events that matter, you can search the logs by hostname, service, source, messages, and more. When you can correlate log events with APM slow traces and errors, troubleshooting becomes easy.


