Syslog Tutorial: Everything You Need to Know
Syslog is a protocol that allows you to transmit and receive notifications in a predefined format from various network devices. Timestamps, event messages, severity, host IP addresses, diagnostics, and other information are included in the messages.
It may transmit a range of severity levels, including level 0, which is an emergency, level 5, which is a warning, System Unstable, critical, and levels 6 and 7, which are Informational and Debugging.
Furthermore, Syslog is an open-ended protocol. Syslog was created to monitor network devices and systems and give out notifications if there are any problems. It also sends out alerts for pre-notified events and monitors suspicious behaviour through the change log/event log of participating network devices.
We will go over the following:
- Introduction
- Components of Syslog
- Syslog Format
- Messages from Syslog
- Advantages of Syslog
- Limitations of Syslog
- Best Practices for Log Messages
- Tools
Introduction
Eric Allman created the Syslog protocol, which is documented in RFC 3164. The messages are transmitted to event message collectors or Syslog servers across IP networks.
Syslog communicates using the User Datagram Protocol (UDP), port 514. Syslog servers, on the other hand, do not acknowledge receipt of the messages. The IETF has standardised Syslog in RFC 5424 since 2009.
Syslog is a protocol that enables a host to transmit event notification messages to event message collectors, commonly known as Syslog Servers or Syslog Daemons, over IP networks. To put it another way, a host or a device can be configured to generate a Syslog Message and send it to a specific Syslog Daemon (Server).
A Syslog Daemon or Server is a program that monitors and responds to Syslog notifications. A Syslog Daemon cannot be configured to request Syslog Messages from a specified device. In other words, if a device lacks the ability to generate Syslog Messages, a Syslog Daemon will be powerless to help. In the actual world, Syslog capturing is usually done with monitoring software.
The data packets in Syslog are unsequenced and unacknowledged since the underlying transport mechanism is User Datagram Protocol (UDP). Since UDP lacks the overhead of TCP, some packets may be dropped on a busy network, resulting in the loss of logging data.
Simply put, Syslog performs a critical function—it collects events—and is found in practically all systems and peripherals. It's the industry standard for gathering data from an ever-increasing number of devices.
Syslog is frequently associated with Ubuntu and servers, but it is much more. Your printer, router, phone, and *nix OS all use this protocol. If you can name a device, it almost certainly utilises Syslog or one of its derivatives.
More than just recording events, being able to check the messages is a vital aspect of "logging," because visibility is what makes them valuable. This topic is about Syslog, and I'll go over all you need to know about it later in this article.
Components of Syslog
A Syslog server and a Syslog client are the two major components of a Syslog solution. In the network diagram below, these components are depicted:

Message Components
The Syslog client in the figure above uses UDP as the Transport Layer protocol and a destination port of 514 to send Syslog messages to the Syslog server. The maximum size of a Syslog message is 1,024 bytes; however, there is no minimum length requirement.
There are three distinct parts to all Syslog messages:
- Priority
The priority of a Syslog message denotes the message's Facility and Severity. This is an 8-bit number. The first 3 bits are the least significant and represent the message's Severity (3 bits can represent 8 different levels of severity), while the remaining 5 bits represent the message's Facility. The Facility and Severity values can be used to apply filters to events in the Syslog Daemon. - Header
The timestamp and the device's hostname or IP address are included in the header of a Syslog message. The message's timestamp is the date and time it was created. Routers can be configured to use Network Time Protocol (NTP) to sync their internal clocks, or administrators can use the clock set hh:mm:ss privileged EXEC command to manually set the clocks on the devices. - Message
The message will take up the rest of the Syslog packet. This normally includes some extra information about the process that generated the message, followed by the message's text. The TAG field and the CONTENT field are the two fields. The name of the application or process that created the message is stored in the TAG field. The CONTENT field provides the message's details.
Syslog Servers Components
You now see how Syslog serves as a centralised repository for logs from many sources. Syslog servers have various components that help them achieve this goal, including:
- Syslog Listener
The listener collects and analyses data sent over UDP port 514 from the Syslog server. There is no guarantee that messages will arrive because there is no acknowledgement receipt. - Database
Databases are required by Syslog servers to store enormous volumes of data for easy access. - Management and Filtering Software
Finding specific log entries can take an unnecessary amount of time due to the large volume of data. The Syslog server needs help in automating tasks as well as filtering log messages to examine specific ones. It can, for example, extract messages based on certain parameters like a critical event or the name of a device. Through the Negative Filter rule, you may also utilise the filter to avoid seeing certain types of entries. You could display all of a firewall's critical log messages if you wanted to.
Syslog Format
RFC 5424 defines a standard log message definition and format for Syslog. As a result, it's made up of three parts: a header, structured data (SD), and a message. You'll find a description of the type in the header, such as:
- Priority
- Version
- Timestamp
- Hostname
- Application
- Process id
- Message id
Then you'll see structured data with data blocks enclosed in square brackets in the "key=value" format. Following the SD, you'll see a detailed log message encoded in UTF-8.
For instance, consider the following message:
<34>1 2003-10-11T22:14:15.003Z mymachine.example.com su - ID47 - BOM'su root' failed for lonvick on /dev/pts/8This format corresponds to the following:
<priority>VERSION ISOTIMESTAMP HOSTNAME APPLICATION PID MESSAGEID STRUCTURED-DATA MSGMessages from Syslog
In the case of software or hardware issues, Syslog messages are used to report levels of Emergency and Warnings. A system restart, for example, will be sent through the Notice level. Through the Informational level, system reloads will be delivered. If debug commands are sent, they are sent via the Debug level.
It's important to remember that these numbers are generated by the applications that trigger the event, not by the Syslog server. The following table (Level/Name/Description) lists and describes the values sent by devices:
- 0 - Emergencies - This level is reserved for the most serious errors that render the system unusable.
- 1 - Alerts - This level is intended to signify situations that require administrators' immediate attention.
- 2 - Crucial - This level is intended to signify critical problems that aren't quite as serious as Alerts, but still need administrator intervention.
- 3 - Errors - This level is used to signal system issues; however, these errors do not prevent the system from being used.
- 4 - Warnings - This level is used to express warning conditions about failed system operations.
- 5 - Notifications - This level is used to indicate changes in the system's state, such as a routing protocol adjacency going down.
- 6 - Informational - This level is used to communicate information about the system's usual operation.
- 7 - Debugging - This level denotes real-time (debugging) information, which is often utilised for troubleshooting.
If an administrator uses the logging buffered notifications command to set up a router, the router will log notifications as well as warnings, errors, critical messages, alarms, and emergencies.
Similarly, if an administrator uses the logging buffered notifications command to configure a router, the router will log ALL messages to the local buffer, including levels 0 through 7.
Here are some additional TechZone samples. This is the error notice from the system:
May 11 10:40:48 scrooge disk-health-nurse[26783]: [ID 702911 user.error] m:SY-mon-full-500 c:H : partition health measures for /var did not suffice - still using 96% of partition spaceIt's possible to divide it into the following columns:
Column 1 = "May 11 10:40:48"               > Timestamp
Column 2 = "scrooge"                       > Loghost
Column 3 = "disk-health-nurse[26783]:"     > Application/Process
Column 4 = "[ID 702911 user.error]"        > Syslog facility.level
Column 5 = "m:SY-mon-full-500"             > Message ID
Column 6 = "c:H : partition health..."     > Message [possibly including rid, sid, ip]
Here's an illustration of a summary message:
May 11 10:00:39 scrooge SG_child[808]: [ID 748625 user.info] m:WR-SG-SUMMARY c:X vhost:iscrooge61.seclutions.com:80 (http) GET / => http://bali/ , status:200 , redirection URL:<n/a> , referer:<n/a> , mapping:bali , request size: 421 , backend response size: 12960 , audit token:- , time statistics (microseconds): [request total 16617 , allow/deny filters 1290 , backend responsiveness 11845 , response processing 1643 , ICAP reqmod <n/a> , ICAP respmod <n/a> ] timestamp: [2012-05-11 10:00:39] [ rid:T6zHJ38AAAEAAAo2BCwAAAMk sid:910e5dd02df49434d0db9b445ebba975 ip:172.18.61.2 ]This table contains the following columns:
Column 1 = "May 11 10:00:39"               > Timestamp
Column 2 = "scrooge"                       > Loghost
Column 3 = "SG_child[808]:"                > Application/Process
Column 4 = "[ID 748625 user.info]"         > Syslog facility.level
Column 5 = "m:WR-SG-SUMMARY"               > Message ID
Column 6 = "c:X  vhost:..."                > Message [including time statistics and rid, sid, ip]
Advantages of Syslog
Syslog helps to isolate the software that creates messages from the software that records messages, as well as the software that reports and analyses messages. As a result, it ensures that crucial events are documented and stored away from the original server. After gaining access to a system, an attacker's first priority is usually to hide their tracks in the logs. Syslog-forwarded logs are unreachable.
It's time-consuming and impractical to monitor many logs from multiple systems. Syslog aids in the resolution of this problem by transmitting events to a centralised Syslog server, which consolidates logs from several sources into a single location.
While Syslog isn't the ideal tool to keep track of networked devices, it can be useful for keeping track of network equipment's general health. Sudden increases in event volume, for example, could signal unexpected traffic increases. Learning about this at the system's edge allows you to anticipate the problem before it occurs.
Without having to install and set up a full monitoring agent, Syslog can be configured to relay login events to a Syslog server.
Limitations of Syslog
Since Syslog lacks an authentication mechanism, it is security-vulnerable. As a result, it is possible for one machine to pretend to be another and transmit false log events. Replay attacks can also be used against it.
Due to Syslog's dependency on UDP transport, it is possible to lose messages. Because UDP is connectionless and unreliable, messages may be lost as a result of network congestion or packet loss.
Another limitation of the Syslog protocol is that in order to generate and transmit a message, the device being monitored must be up and operating and connected to the network. If the system goes down, a critical error from a server may never deliver an error at all. As a result, Syslog isn't an effective tool to keep track of device uptime and downtime.
Finally, while there are standards for the components of a message, there is inconsistency in the formatting of the content. The protocol doesn't specify how messages should be formatted. Some communications may be readable by humans, while others may not. The only thing Syslog does is provide a way to convey the message.
Best Practices for Log Messages
Follow these best practices to help you create the most useful Syslog messages possible:
- Standardized Formats
Set the operating standards, such as the message format or schema, for all users to follow. By standardising the formats, the logs will be less cluttered and easier to find. Use common abbreviations instead of long statements, such as 'ms' for 'milliseconds'. - Parsable Log Formats
For log messages, there is no universal structure. If you don't have a means to automatically analyse log entries to discover what you're looking for, working with massive quantities of logs is nearly difficult. A parseable format is significantly more likely to be used by tools. - Logging Library or Framework
For programming languages and runtime environments, there are numerous logging libraries. Use a suitable framework to send logs from your application or service to a Syslog server, regardless of the language in which it was written. - Add Syslog Severity Levels
When delivering a message, choosing the correct logging Severity Level might make future troubleshooting easier. Allowing logging to be configured at an incorrect level might lead to monitoring concerns, resulting in false alarms or disguising serious problems. - Add Identifiers
The best practice of utilising identifiers in the messages is closely related to using a format to properly specify the log format. Identifiers are used to determine where a communication originated and how several messages are related. You can relate two separate problems to the same user session by specifying a transaction or session ID in your log message. - Add the Right Amount of Context
All of the information needed to reconstruct the status of your application at the moment of the logging call is included in good Syslog messages. This entails including the source of the problem in error messages as well as providing concise explanations for issuing emergency log messages. - Don’t Log Sensitive Data
Passwords should never be written to log files. The same is true for sensitive information such as credit card numbers, bank account numbers, and personal information. At rest, Syslog messages are rarely encrypted. They will be easily readable by a hostile attacker. - Avoid Multi-line Log Messages
Multiple lines can be contained within a single log message according to the Syslog protocol specification, although this can cause parsing issues. Line breaks in log lines aren't always compatible with log analysis software.
Tools
The demand for log management products and services has never been greater as an increasing number of businesses migrate to the cloud. It's great to have centralised logs, but you'll need the correct tools to properly examine them. Going through files one by one will drive you insane. Here are some tools:
- Atatus - This tool combines APM, errors, metrics, and monitoring with logging to give you application performance superpowers in a fully integrated, multi-environment tool.
- Loggly - This is a cloud-based management and analytics service that offers both a free and a premium plan that starts at $49 per month. You can get a complete view of your logs using their dynamic field explorer.
- logz.io - This tool offers both free and paid plans starting at $89 a month. It offers a Kibana-powered interface that allows you to quickly search across millions of entries.
- Splunk - It is also available in both free and paid versions. The cost of the paid plan is determined by the volume of work you do. It also includes strong drill-downs that allow you to perform ad-hoc queries and travel back in time.
- Logstash - This is an open-source tool for organising and collecting events and logs that is free to use. You can also use it in conjunction with Kibana.
- Deep Log Analyzer - This tool can parse IIS log files as well as log files generated by the Apache webserver. You can create custom reports using a user-friendly interface. Parsed data can also be exported in HTML or Excel format.
Summary
Many applications support sending data to Syslog because it is a standard protocol. You can quickly audit security, monitor application behaviour, and keep track of other vital server information by centralising this data.
Since most programming tools and runtime environments accept the Syslog log message format, it's a convenient way to send and receive log messages. Users must consider the scenarios and adapt the messages correctly when creating log messages with the correct data. Using best practices makes the job go more smoothly.
Syslog is an important tool in network monitoring since it ensures that events that don't have a big impact don't slip through the cracks. The ideal practice is to use software that integrates all of the tools so that you can always see what's going on in your network.
Atatus Logs Monitoring and Management
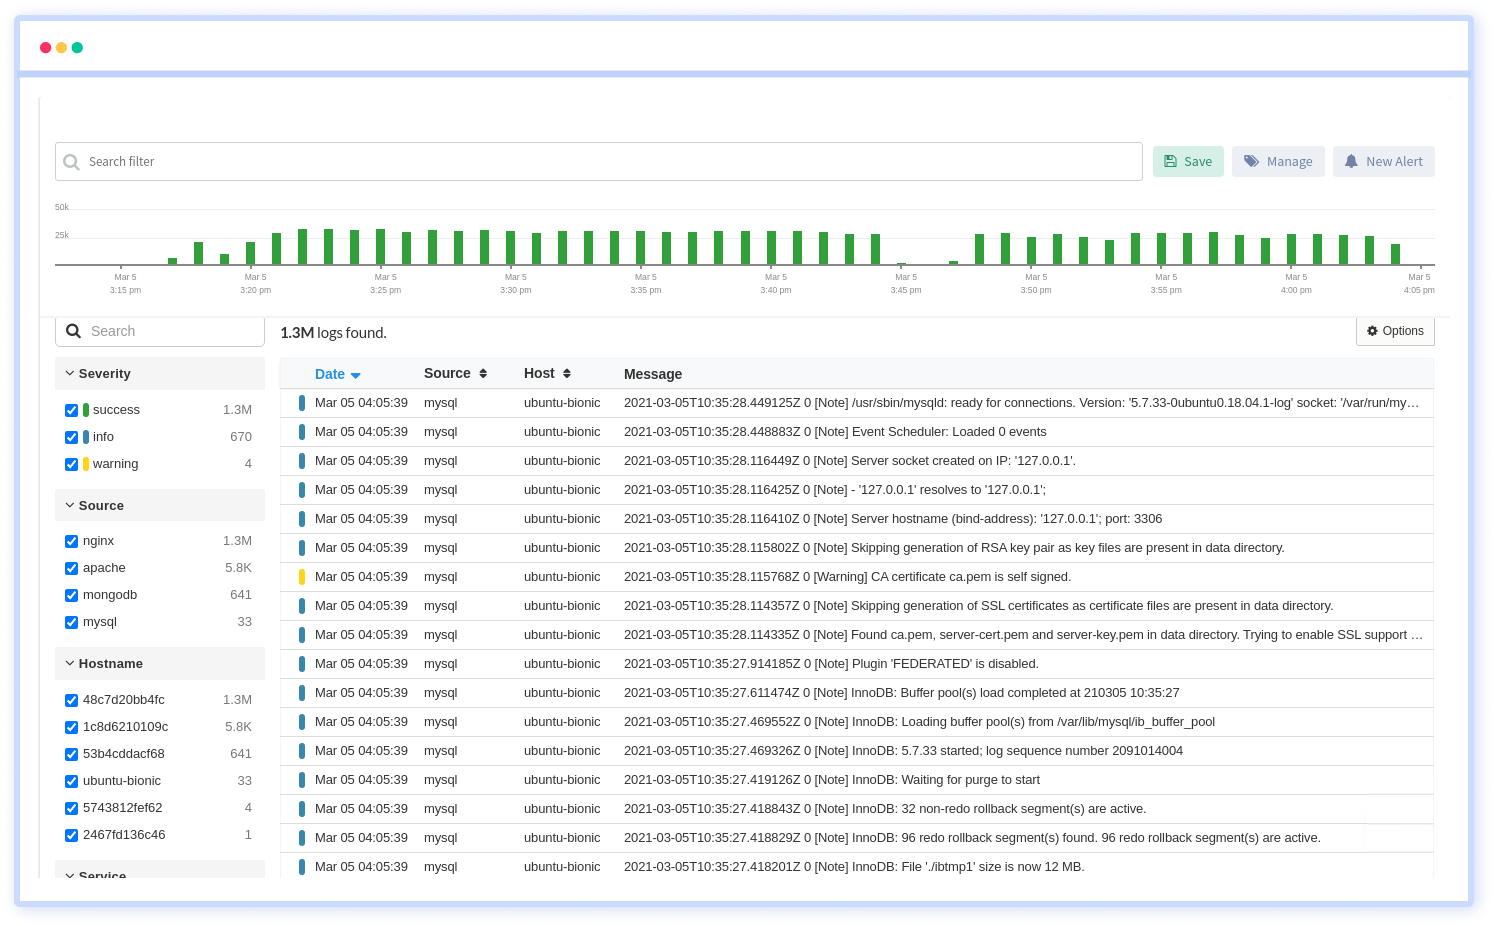
Atatus offers a Logs Monitoring solution which is delivered as a fully managed cloud service with minimal setup at any scale that requires no maintenance. It monitors logs from all of your systems and applications into a centralized and easy-to-navigate user interface, allowing you to troubleshoot faster.

We give a cost-effective, scalable method to centralized logging, so you can obtain total insight across your complex architecture. To cut through the noise and focus on the key events that matter, you can search the logs by hostname, service, source, messages, and more. When you can correlate log events with APM slow traces and errors, troubleshooting becomes easy.
#1 Solution for Logs, Traces & Metrics
APM
Kubernetes
Logs
Synthetics
RUM
Serverless
Security
More


![Splunk vs Prometheus: A Side-by-Side Comparison [2025 Guide]](/blog/content/images/size/w960/2024/08/Datadog-vs-sentry--13-.png)

