MTTR vs. MTBF vs. MTTF: Understanding Failure Metrics
In the dynamic landscape of software and web applications, failures can have severe consequences, impacting user experience, business continuity, and overall performance.
To proactively address these challenges, organizations rely on robust monitoring practices supported by failure metrics. Failure metrics, specifically tailored to software and web application monitoring, provide crucial insights into system health, reliability, and optimization opportunities.
This blog aims to provide a comprehensive understanding of key concepts and terminology related to failure metrics in the context of software and web application monitoring.
We will delve into various metrics, such as Mean Time to Repair (MTTR), Mean Time Between Failures (MTBF), Error Rate (ER), and more, that are fundamental in assessing and managing failures in the software realm.
Throughout this blog, we will explore the purpose and significance of each metric, their relevance in monitoring software and web applications, and how they contribute to ensuring optimal performance and user satisfaction.
By enhancing our understanding of these failure metrics and their application to software and web application monitoring, readers will be equipped with the knowledge to proactively identify, mitigate, and resolve failures, ultimately leading to more resilient and high-performing software and web applications.
So, let's embark on this journey to comprehend the key concepts and terminology that empower us in effectively monitoring and managing failures in the digital realm.
Lets get started!
Table of Contents
- Understanding Failure
- Mean Time Between Failures (MTBF)
- Mean Time to Failure (MTTF)
- Mean Time to Repair (MTTR)
- Relationship between MTTR, MTBF, and MTTF
- Comparison: MTTR vs. MTBF vs. MTTF
- Challenges and Limitations
- Terminology for Understanding Failure Metrics
Understanding Failure
Failure in software refers to the occurrence of unexpected events or conditions that deviate from the intended behaviour of a program or system. It encompasses a wide range of issues, including crashes, errors, bugs, incorrect outputs, data corruption, or any instance where the software does not meet its expected objectives.
Imagine a messaging application that crashes every time a user tries to send a message, preventing any successful communication. In this case, the crash is a clear indication of a failure. Another example could be an e-commerce website that miscalculates prices during checkout, leading to incorrect billing amounts for customers. This incorrect calculation is a failure as it violates the expected behaviour of the system.
Failure metrics provide a quantitative means to assess and measure failures in software. They allow us to track and evaluate the reliability, stability, and performance of applications.
By regularly monitoring and analysing failure metrics, development teams can drive enhancements, prioritize bug fixes, and implement preventive measures to reduce failures in future iterations.
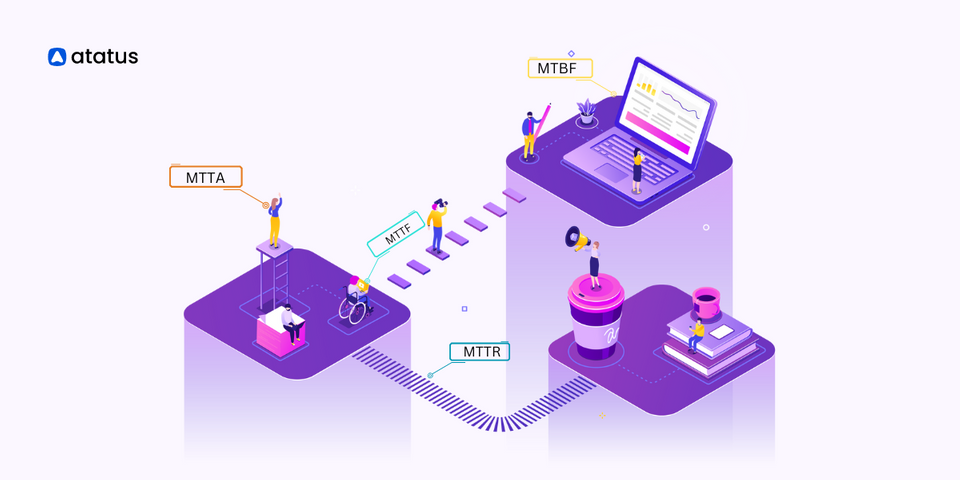
Talking about the failure metrics, here are some of the common failure metrics that helps to evaluate the reliability, stability, and performance of the applications.
- Mean Time Between Failures (MTBF)
- Mean Time to Failure (MTTF)
- Mean Time to Repair (MTTR)
Let's discuss about each failure metric in detail.
Mean Time Between Failures (MTBF)
Mean Time Between Failures (MTBF) is a reliability metric used to measure the average time elapsed between two consecutive failures of a system or component. It provides insights into the expected time a system can operate before encountering a failure.
is a reliability metric that measures the average expected time between two consecutive failures of a system or component under normal operating conditions. It represents the average operating time of a system or component before it fails.
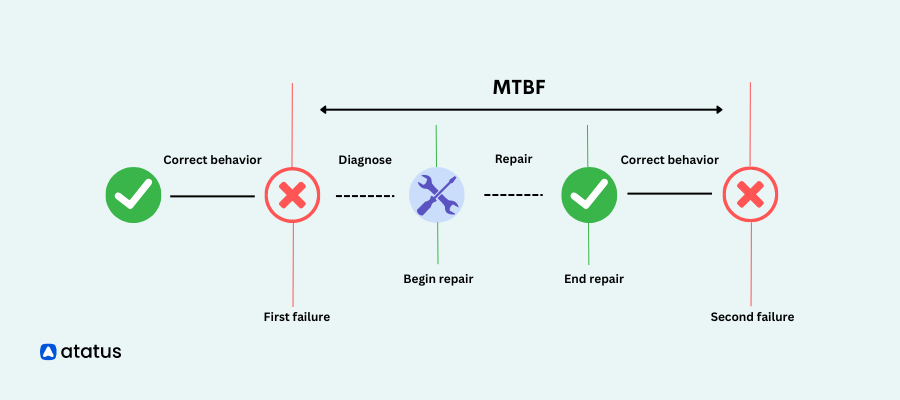
- Purpose: It measures the average time between consecutive failures of the web application or its components.
- Focus: MTBF is used to evaluate the reliability and availability of the application. By monitoring MTBF, IT teams can identify patterns of failures, proactively address potential issues, and optimize the infrastructure, ensuring a robust and stable web application environment.
Calculation
The Mean Time Between Failures (MTBF) is calculated using the following formula:

The formula consists of two key components:
- Total Operating Time: This represents the cumulative amount of time that a system or component has been in operation without any failures. It is typically measured in hours or any other relevant time unit.
- Number of Failures: This refers to the total count of failures that have occurred during the given operating time. It represents the instances when the system or component did not function as intended or encountered a fault.
For example, let's consider a manufacturing plant that has been in operation for 10,000 hours, and during this time, it experienced 5 failures.
To calculate the MTBF, you would divide the total operating time (10,000 hours) by the number of failures (5). In this case, the MTBF would be 2,000 hours (10,000 hours / 5 failures).
How to improve MTBF
- Implement proactive maintenance strategies, such as preventive maintenance and condition-based monitoring, to detect and address potential failures before they occur.
- Continuously analyse failure data and metrics to identify patterns, common failure modes, and opportunities for improvement.
- Conduct thorough testing and quality control measures during the development phase to identify and address potential issues before deployment.
Mean Time to Failure (MTTF)
Mean Time to Failure (MTTF) is a reliability metric that measures the average expected time between two consecutive failures of a system or component under normal operating conditions. It represents the average operating time of a system or component before it fails.
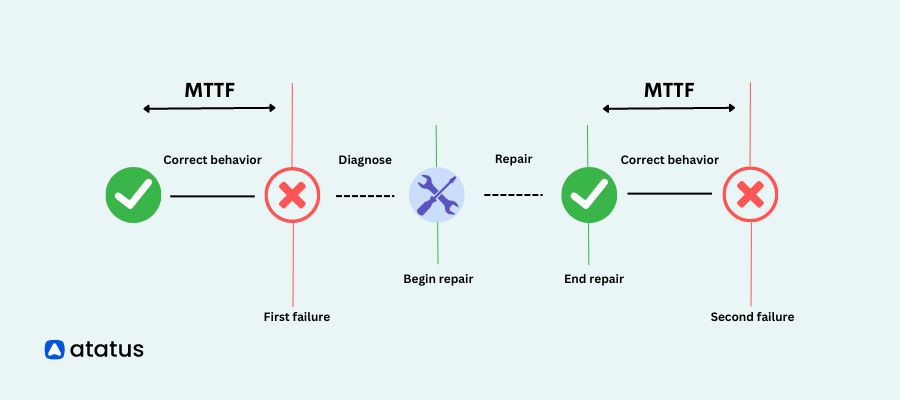
- Purpose: MTTF measures the average time until the first failure of non-repairable components or equipment within the web application ecosystem.
- Focus: MTTF assists in assessing the reliability of critical components, such as servers, databases, or third-party services. By monitoring MTTF, IT teams can anticipate potential failures, plan for redundancies, and ensure the availability and performance of the web application.
Calculation
The Mean Time to Failure (MTTF) is calculated using the following formula:
How to Improve MTTF
- Quickly detect failures, diagnose the root causes, and implement efficient fault recovery processes to minimize downtime and mitigate the impact of failures.
- Mitigate significant disruptions to business operations by implementing routine inspections for components associated with vital assets.
- Focus on designing the system or component with reliability in mind. Use robust design principles, such as redundancy, fault tolerance, and error handling mechanisms, to minimize the likelihood of failures.
MTBF and MTTF
The formula for Mean Time Between Failures (MTBF) and Mean Time To Failure (MTTF) is the same because they both measure the average time between failures. However, they are used in different contexts.
MTBF is commonly used for repairable systems, where failures can be addressed through repairs or replacements. It calculates the average time between two consecutive failures, including the time taken for repairs.
MTTF, on the other hand, is used for non-repairable systems, where failure leads to a complete loss of functionality. It calculates the average operating time before the first failure occurs and does not consider repair time.
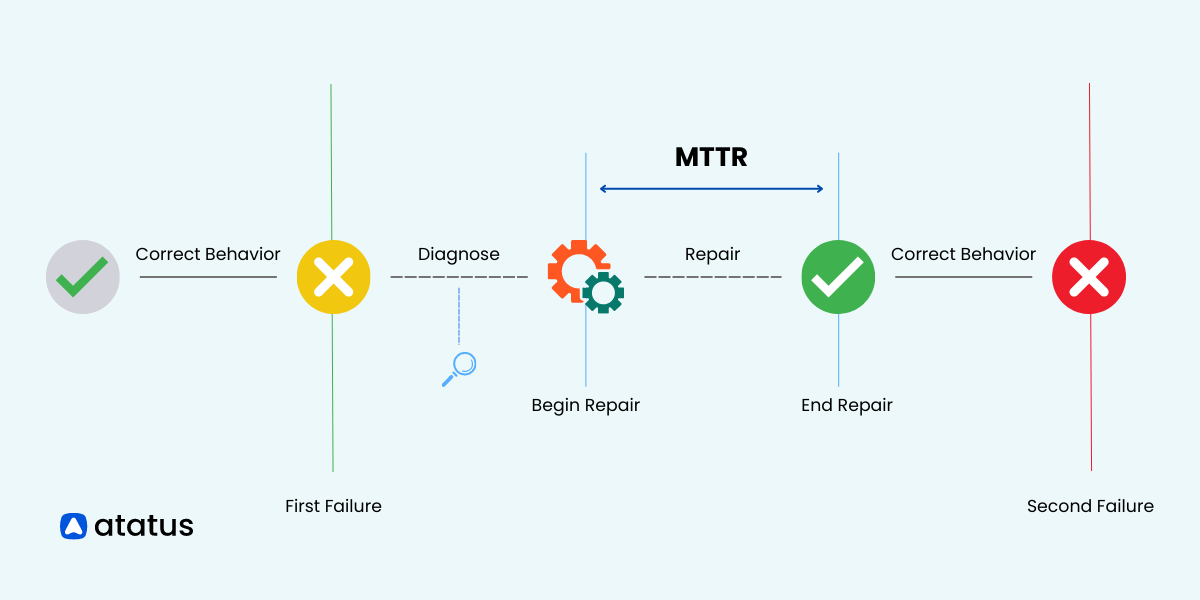
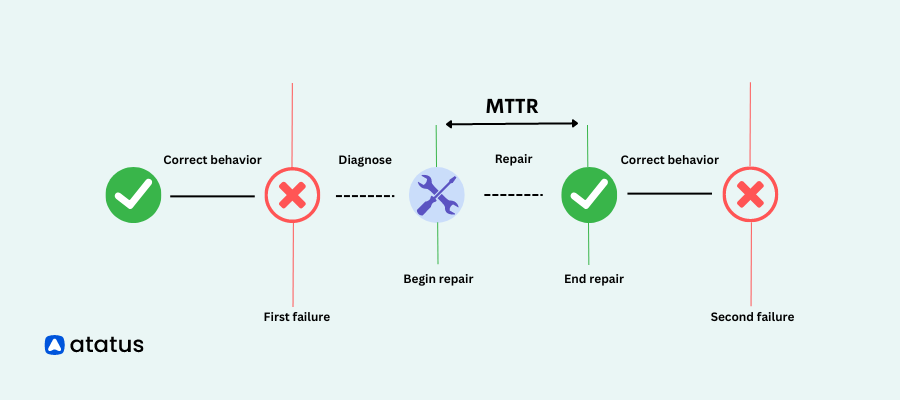
Mean Time to Repair(MTTR)
MTTR stands for Mean Time To Repair. It is a metric used to measure the average time taken to repair a failed system or component and restore it to normal functioning. MTTR is typically calculated by dividing the total downtime caused by failures by the number of repair incidents.
Click the link to know more about MTTR.
- Purpose: It measures the average time taken to repair a failed component or restore a web application to normal operation.
- Focus: MTTR helps assess repair efficiency and provides insights into the duration required to resolve issues. By tracking MTTR during web application monitoring, IT teams can identify bottlenecks, optimize troubleshooting processes, and minimize downtime, ensuring optimal user experience and business continuity.
Understanding the relationship between MTTR, MTBF, and MTTF
The relationship between these metrics can be understood as follows:
1. MTBF = MTTF + MTTR
MTBF is the sum of MTTF and MTTR because it includes the time until the first failure (MTTF) as well as the time required to repair the system after a failure occurs (MTTR).
2. MTBF and MTTR affect system availability
System availability is inversely related to MTBF and MTTR. A higher MTBF indicates longer periods of uninterrupted operation, resulting in higher availability. Conversely, a higher MTTR leads to increased downtime and lower availability.
3. MTTR impacts the frequency of failures
Longer MTTR values can result in a higher frequency of failures since the system or component is out of operation for a longer duration. A shorter MTTR reduces the time spent in the repair process, leading to fewer failures and better system performance.
4. MTBF and MTTF provide different perspectives
MTBF focuses on operational reliability and system uptime by considering the time between consecutive failures. On the other hand, MTTF concentrates on the expected lifetime of a component or system before the first failure, regardless of repair or replacement.
5. MTBF and MTTF can be used together for different purposes
MTBF and MTTF complement each other in assessing system or component reliability. While MTBF provides an overall measure of system performance, MTTF is useful for non-repairable components or systems where the focus is on the expected lifespan before the initial failure.
Comparison: MTTR vs. MTBF vs. MTTF
| Difference | MTTR | MTBF | MTTF |
|---|---|---|---|
| Scope | Focuses on the time required to repair a web application after a failure | Focuses on the average time between consecutive failures of the web application | Focuses on the average time until the first failure of the web application |
| Response Time Optimization | Helps identify bottlenecks and improve the speed of issue resolution | Helps identify recurring patterns and optimize the system to reduce the frequency of failures | Helps estimate the expected lifespan before the first failure of the web application |
| Impact on User Experience | A lower MTTR indicates a quicker resolution and minimizes user impact | A higher MTBF suggests a more reliable web application with fewer disruptions for users | An estimated MTTF helps assess the overall stability and expected availability of the web application |
| Incident Management | Focuses on incident response and minimizing downtime through efficient troubleshooting and resolution | Supports proactive maintenance and planning based on historical failure patterns | Assists in capacity planning and system design for ensuring desired MTTF |
| Debugging and Diagnostics | Emphasizes the efficiency of debugging and diagnostic processes to identify and resolve issues | Less focused on diagnostic activities as it measures the time between failures | Less focused on diagnostic activities as it measures the time until the first failure |
| Optimization of Monitoring System | Helps identify areas for improvement in monitoring tools, alert systems, and incident management processes | Helps optimize monitoring systems to detect and alert for potential failures, reducing MTBF | Helps optimize monitoring systems to detect and predict failures, improving overall MTTF |
| Continuous Improvement | Facilitates a continuous improvement cycle by reducing MTTR and enhancing incident response processes | Supports continuous improvement by analyzing and addressing frequent failure patterns to increase MTBF | Supports continuous improvement by analyzing and addressing factors impacting the lifespan to increase MTTF |
Challenges and Limitations
To effectively overcome these challenges and limitations, it is essential to approach them with careful consideration, a commitment to continuous improvement, and a thorough understanding of the particular application and context in which failure metrics are being utilized.
Here are some challenges and limitations associated with failure metrics:
- Data availability and quality: Acquiring precise and dependable data for failure metrics poses a significant challenge. Limited availability or incomplete failure data can impede effective failure analysis. Furthermore, variations in data quality can introduce potential inaccuracies during failure metric calculations.
- Subjectivity and bias: Qualitative failure metrics, such as user satisfaction surveys or expert assessments, are susceptible to subjectivity and bias. Diverse interpretations or evaluations of failures among individuals can lead to inconsistent data. It is crucial to address biases and strive for objectivity when formulating failure metrics.
- Interpreting failure metrics: Grasping the implications of failure metric values can be intricate. For instance, a high failure rate could indicate poor system reliability, but it may also result from rigorous testing or deliberate stress conditions. Accurate interpretation of failure metrics necessitates considering the context, system characteristics, and other relevant factors.
- Contextual considerations: Tailoring failure metrics to the specific domain and system under study is essential. Different industries and applications exhibit unique requirements and failure modes. Neglecting contextual factors may yield irrelevant or misleading failure metrics. Customization of metrics is important to capture critical failures within the given context.
- Complexity and scope: Systems with intricate interconnections and subsystems present challenges in defining failure metrics that accurately capture system behavior and performance. Failure metrics should encompass overall system behavior while focusing on critical components or failure modes.
- Predictive limitations: Although failure metrics provide valuable insights into past failures, their predictive capabilities have limitations. Accurately predicting future failures, especially in complex systems or emerging failure modes, is challenging. Complementing failure metrics with other techniques such as predictive modeling and analysis enhances failure prediction effectiveness.
- Evolving systems and technologies: Constant technological advancements lead to evolving systems. Failure metrics designed for older systems may not be directly applicable to newer systems or emerging technologies. Regular evaluation and adaptation of failure metrics become necessary to account for changes in system designs, operating conditions, and failure mechanisms.
Terminology for Understanding Failure Metrics
- Failure: The inability of a system or component to perform its intended function.
- Reliability: The probability that a system or component will perform its intended function without failure over a specified period of time.
- Availability: The proportion of time that a system or component is operational and able to perform its intended function.
- Uptime: The period during which a system or component is operational and available for use.
- Downtime: The period during which a system or component is not operational due to a failure or scheduled maintenance.
- Failure Rate: The frequency at which failures occur within a system or component, typically measured in failures per unit of time.
- Availability Metrics: Metrics used to measure the overall availability of a system, such as uptime percentage or downtime frequency.
- Failure Analysis: The process of investigating and understanding the root causes of failures to identify areas for improvement and prevent future failures.
- Repairable Systems: Systems or components that can be restored to normal functioning through repairs or replacements.
- Non-repairable Systems: Systems or components that are discarded or replaced entirely after failure.
- Redundancy: The inclusion of extra components or systems to provide backup or duplicate functionality.
Conclusion
Understanding and effectively utilizing failure metrics is crucial for assessing system reliability, optimizing maintenance strategies, and minimizing downtime. By measuring metrics such as MTBF, MTTF, and MTTR, organizations can gain valuable insights into their systems' performance and identify areas for improvement.
Failure metrics provide a quantitative framework for evaluating reliability, enabling informed decision-making and proactive management of failures. By implementing strategies to improve MTBF and MTTF, organizations can enhance system performance, increase customer satisfaction, and drive operational efficiency.
Monitor Your Entire Application with Atatus
Atatus is a Full Stack Observability Platform that lets you review problems as if they happened in your application. Instead of guessing why errors happen or asking users for screenshots and log dumps, Atatus lets you replay the session to quickly understand what went wrong.
We offer Application Performance Monitoring, Real User Monitoring, Server Monitoring, Logs Monitoring, Synthetic Monitoring, Uptime Monitoring and API Analytics. It works perfectly with any application, regardless of framework, and has plugins.

Atatus can be beneficial to your business, which provides a comprehensive view of your application, including how it works, where performance bottlenecks exist, which users are most impacted, and which errors break your code for your frontend, backend, and infrastructure.
If you are not yet a Atatus customer, you can sign up for a 14-day free trial .
#1 Solution for Logs, Traces & Metrics
![]() APM
APM
![]() Kubernetes
Kubernetes
![]() Logs
Logs
![]() Synthetics
Synthetics
![]() RUM
RUM
![]() Serverless
Serverless
![]() Security
Security
![]() More
More