What is MTTR? Calculation and Reduction Strategies
In the fast-paced world of software development, every minute counts. When disruptions occur, whether there are minor or major system failures, organizations need to bounce back to maintain seamless operations. That's where MTTR (Mean Time to Repair) steps onto the stage as a game-changing metric.
Are you ready to unlock the secrets behind reducing downtime, boosting performance, and ensuring software reliability? Brace yourself as we dive into the realm of MTTR, its significance and equipping you with the knowledge to supercharge your incident response.
Get ready for mastering MTTR and unleashing the power of efficiency in this blog that promises to transform the way you approach software resilience. Let's dive in and uncover the secrets to achieve fast recovery times that will leave your competitors in awe.
Table of Contents
- What is MTTR?
- How is MTTR Measured?
- How to Improve MTTR?
- How MTTD Affects MTTR?
- Tools and Technologies for Faster Recovery
- Key Terms
What is MTTR?
MTTR (Mean Time to Resolve) is a key metric used to measure software reliability. It refers to the average time it takes to repair a software system or resolve a failure once it has been detected.
MTTR is an important metric because it provides insights into the efficiency and effectiveness of the software maintenance and repair processes.
In software development and operations, failures and issues are bound to occur, and it is crucial to minimize the impact of these failures on the overall reliability of the system. MTTR helps in assessing how quickly these failures can be addressed and resolved, thus reducing downtime and improving the availability of the software.
How is MTTR Measured?
MTTR (Mean Time to Resolve) is measured by calculating the average time it takes to repair or resolve a software failure or issue.
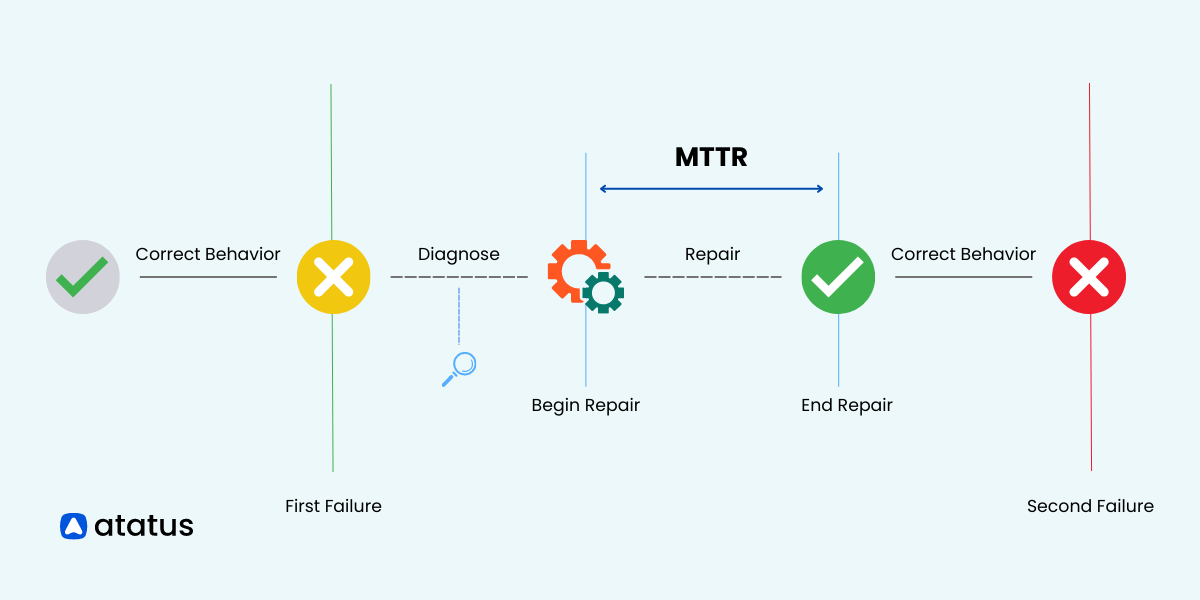
Whenever a software failure or issue occurs, it is important to log and document the details of the event. This includes capturing the time when the failure was detected or reported. Once the failure event is recorded, the clock starts ticking to track the time taken to repair or resolve the issue.
The repair time includes all the activities involved in diagnosing, fixing, and restoring the software system to its normal functioning state.
During a specific period, the total repair time is obtained by summing up the repair times for all reported failures. Additionally, the number of failure events that occurred within the same period is counted, representing the total count of failures that required repair.
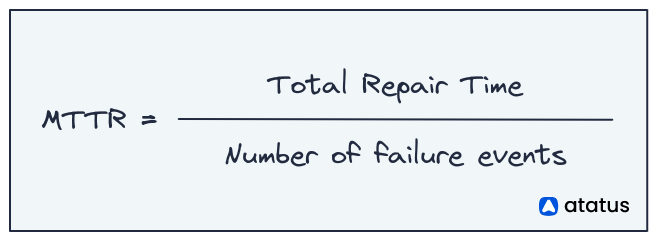
Now MTTR is obtained by dividing the total repair time by the number of failure events. The formula is as follows:
To obtain accurate and meaningful MTTR measurements, it is essential to consistently repeat the measurement process over a substantial timeframe.
Here's an example to illustrate how MTTR is calculated:
Let's consider a manufacturing facility that produces electronic devices. Over the course of a month, the facility experienced several equipment failures that required repair. The time taken to repair each failure was as follows:
- Failure 1: 4 hours
- Failure 2: 2 hours
- Failure 3: 6 hours
- Failure 4: 3 hours
- Failure 5: 5 hours
To calculate the MTTR for this month, we add up the repair times for all the failures and divide it by the total number of failures:
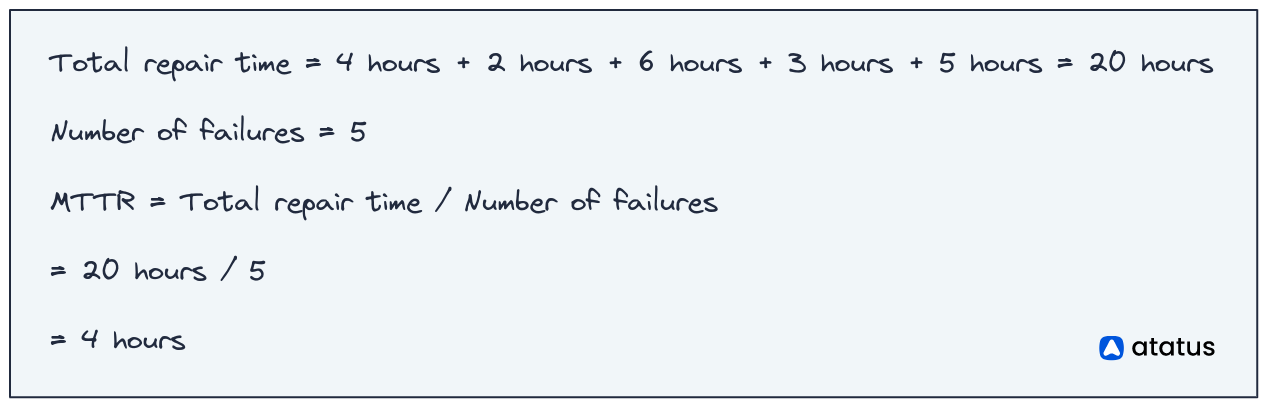
Therefore, the MTTR for this month in the manufacturing facility is 4 hours. This means, on average, it took 4 hours to repair the equipment each time a failure occurred during that period. The lower the MTTR, the faster the system or equipment can be restored to its operational state, indicating better efficiency in handling and resolving failures.
Now that we've discussed how MTTR is measured, let's move on to the next question about what would be considered a good MTTR score for software performance and reliability.
Well! There is no universally defined "good" MTTR score, as the acceptable or desirable MTTR can vary depending on the specific industry, context, and the criticality of the system or process being measured. In general, a lower MTTR is preferred because it signifies that issues are being resolved more quickly and operations can be restored sooner.
Ultimately, the goal is to continuously monitor and improve MTTR over time, to reduce the repair time and minimize the impact of failures on the overall performance and reliability of the software system.
How to Improve MTTR?
Improving MTTR and making the process faster and more efficient involves several steps. First, organizations should have a clear plan in place for how to respond to incidents. This plan outlines everyone's roles and responsibilities and establishes effective communication channels.
Additionally, implementing monitoring and alerting systems helps to quickly detect and notify teams about issues. Automation tools can be used to automate repetitive tasks and speed up the recovery process, while maintaining a knowledge base with common issues and solutions can help support teams diagnose and fix problems faster.
After incidents, analysing them thoroughly to understand their root causes and implementing preventive measures is essential.
Lastly, regularly testing and practicing the recovery process ensures teams are prepared and can handle real incidents more efficiently. By following these steps, organizations can reduce downtime, minimize errors, and improve the overall reliability and performance of their software systems.
How MTTD affects MTTR?
MTTD (Mean Time to Detect) and Mean Time to Repair (MTTR) are interconnected metrics in incident response. The duration it takes to detect an incident (MTTD) has a direct impact on the Mean Time to Repair.
Here's how MTTD affects MTTR:
- Prompt Identification: A shorter MTTD enables incidents to be identified promptly. When incidents are detected early, it allows the incident response team to initiate the repair process sooner. This reduces the overall MTTR because the time between incident detection and repair commencement is minimized.
- Timely Response: With a shorter MTTD, the incident response team can respond more swiftly to the identified incident. By promptly addressing the incident, the repair process can be initiated sooner, leading to a reduction in MTTR. Timely response ensures that the necessary resources and actions are allocated promptly, accelerating the repair timeline.
- Faster Root Cause Analysis: MTTD impacts the speed at which root cause analysis (RCA) can be conducted. When incidents are detected early, there is more accurate and timely data available for analysis. This facilitates a quicker and more effective identification of the root cause, which in turn expedites the repair process, leading to a shorter MTTR.
- Iterative Improvement: Monitoring MTTD and MTTR together allows organizations to identify opportunities for improvement. By analyzing the relationship between MTTD and MTTR, teams can identify areas where reducing MTTD can have a positive impact on MTTR. This iterative improvement approach helps to streamline the repair process and further decrease the MTTR over time.
Tools and Technologies for Faster Recovery
There are various tools and technologies available that can help facilitate faster recovery and minimize MTTR (Mean Time to Repair). Here are some examples:
- Incident Management Systems: Incident management systems like ServiceNow, Jira Service Management, and Freshservice offer a centralized platform for logging, tracking, and handling incidents. These tools streamline the incident resolution process by facilitating efficient communication, collaboration, and documentation.
- Monitoring and Alerting Tools: Monitoring tools such as Atatus, Nagios, Zabbix, and Datadog continuously monitor system health, performance metrics, and log files. They generate alerts and notifications when predefined thresholds are exceeded or anomalies are detected, enabling quick issue identification and faster response times.
- Log Management and Analysis: Tools like ELK Stack (Elasticsearch, Logstash, and Kibana), Atatus Logs Monitoring, Splunk, and Graylog collect, store, and analyze logs from various systems and applications. They simplify log searching, real-time analysis, and event correlation, aiding in faster troubleshooting and issue resolution.
- Configuration Management Tools: Configuration management tools like Puppet, Chef, and Ansible automate the management and deployment of infrastructure and software configurations. They facilitate rapid provisioning, configuration consistency, and speedy recovery by automating system setup and configuration.
- Orchestration and Automation Platforms: Kubernetes, Docker Swarm, and Apache Mesos are examples of tools that provide container orchestration and deployment capabilities. They enable automatic scaling, failover, and recovery of applications and services, minimizing downtime and reducing MTTR.
- Incident Response Collaboration Tools: Collaboration tools like Slack, Microsoft Teams, and Atlassian Confluence facilitate real-time communication and collaboration among teams during incident response. These tools provide dedicated channels, document sharing, and integration with other systems, enabling efficient coordination and faster resolution.
- Cloud-based Disaster Recovery: Cloud service providers like Amazon Web Services (AWS), Microsoft Azure, and Google Cloud Platform (GCP) offer disaster recovery services and tools. These services enable automatic replication and failover of critical systems and data to secondary regions or data centers, ensuring faster recovery in the event of a disaster.
- Network Monitoring and Troubleshooting Tools: Tools like Wireshark, SolarWinds Network Performance Monitor, and Cisco Network Assurance Engine help monitor and troubleshoot network-related issues. They provide insights into network traffic, performance bottlenecks, and connectivity problems, expediting the diagnosis and resolution of network-related incidents.
- Performance Testing and Load Balancing Tools: Tools such as Apache JMeter, LoadRunner, and NGINX provide performance testing and load balancing capabilities. They help identify performance bottlenecks, simulate high load scenarios, and distribute traffic efficiently, reducing the risk of failures and improving overall system resilience.
- Backup and Recovery Solutions: Implementing robust backup and recovery solutions such as Veeam, Commvault, or Backup Exec ensures regular data backups and facilitates faster recovery in case of data loss or system failures. These solutions provide mechanisms for incremental backups, data deduplication, and rapid data restoration.
Key Terms
- Failure: A failure refers to an unexpected event or malfunction that causes a system or process to stop functioning as intended.
- Downtime: Downtime is the period during which a system or process is unavailable or not operating at its normal capacity due to a failure or disruption.
- Incident: An incident is an event that interrupts or degrades the normal operation of a system, often resulting in downtime.
- Response Time: Response time is the time it takes for an organization to acknowledge and respond to an incident once it has been identified or reported.
- Repair Time: Repair time, also known as resolution time, is the duration it takes to fix the underlying issue causing the failure and restore the system to its normal state.
Conclusion
Mastering MTTR is the key to unlock a world of software success. By understanding the importance of MTTR and implementing strategies to reduce downtime, you can elevate your incident response and bring your organization forward.
Throughout this blog, we have explored the fundamental concepts of MTTR, learned how it affects software reliability, and discovered practical techniques to improve it.
From developing a robust incident response plan to leveraging automation and fostering a culture of collaboration, each step brings you closer to achieving faster recovery times and enhanced software performance.
Remember, every minute saved in the recovery process adds up to improved customer satisfaction, increased productivity, and a competitive edge in the market. Embrace efficiency by finding faster ways to fix problems and get your software back on track.
Keep improving how you respond to incidents and make sure you are always learning from them. As you do this, you will see that MTTR becomes a powerful force that helps your software succeed.
Monitor Website Uptime with Atatus Synthetic Monitoring
Atatus Synthetic Monitoring ensures uptime, identifies regional issues, tracks application performance, and manages SLAs and SLOs by monitoring your applications, API endpoints, and critical business flows via simulated user requests.
Synthetic monitoring transactions can be executed from various geographical locations to simulate user interactions from different regions. This helps identify any performance discrepancies or regional variations.
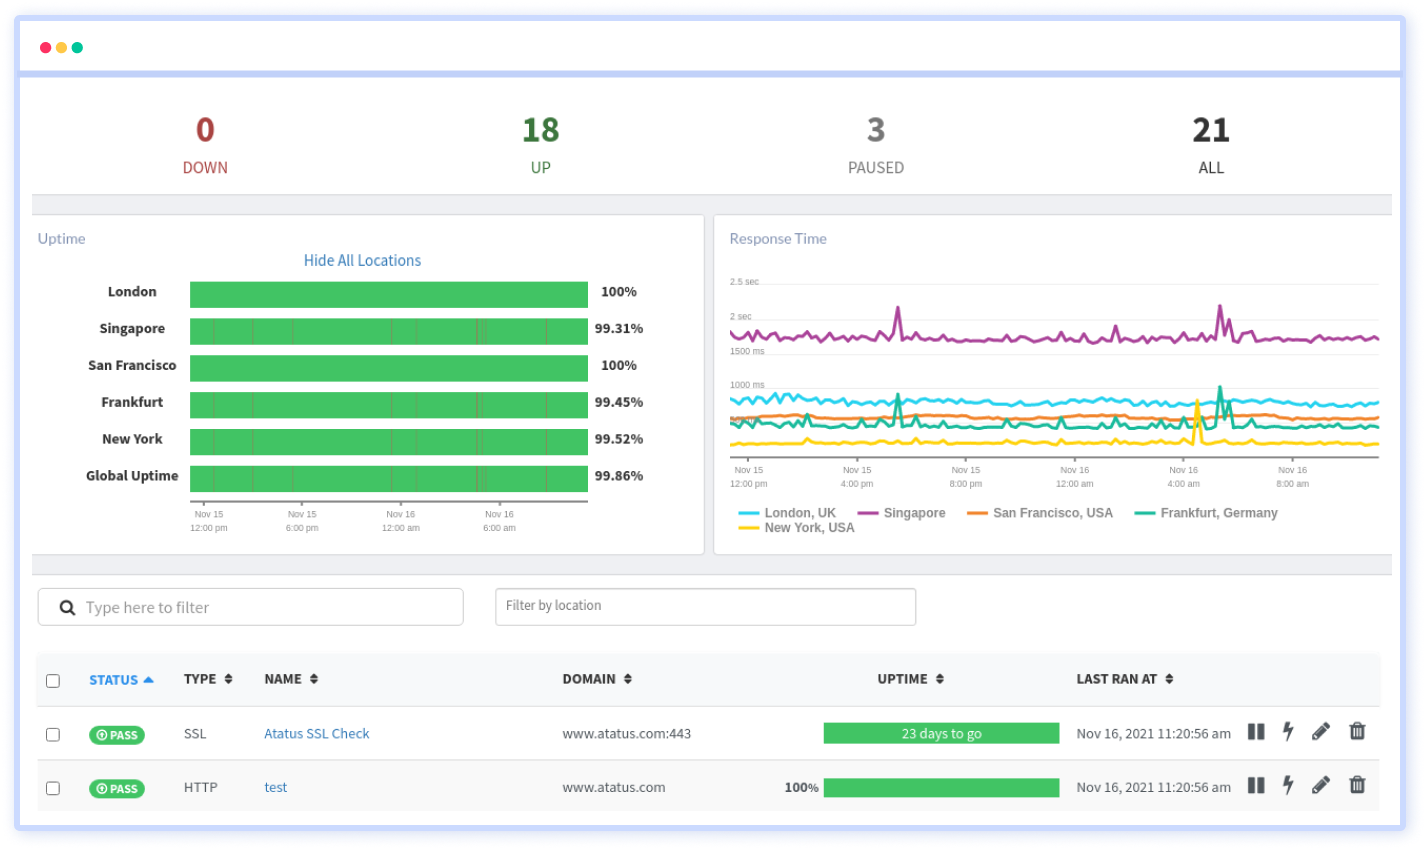
Atatus monitors the performance of your webpages and APIs in a regulated and steady manner, from the backend to the frontend, and at multiple network levels, warning you in the event of erroneous behavior such as regression, broken feature, high response time, unexpected status code, and so on.
#1 Solution for Logs, Traces & Metrics
![]() APM
APM
![]() Kubernetes
Kubernetes
![]() Logs
Logs
![]() Synthetics
Synthetics
![]() RUM
RUM
![]() Serverless
Serverless
![]() Security
Security
![]() More
More