Monitoring Next.js with Opentelemetry
NestJS is a popular and powerful open-source framework for building scalable and maintainable server-side applications with Node.js. It was developed by Kamil Myśliwiec and first released in 2017.
NestJS is inspired by Angular, which brings familiarity and a structured approach to building back-end applications. It follows the principles of Object-Oriented Programming (OOP), Dependency Injection (DI), and Functional Programming (FP), making it an excellent choice for developers who prefer a modular and organized codebase.
OpenTelemetry is an open-source observability framework that allows you to collect, process, and export telemetry data, such as traces and metrics, from your applications. Monitoring a Next.js application with OpenTelemetry is a great way to gain insights into the performance, errors, and behavior of your application.
Analyzing telemetry data allows you to gain a deep understanding of your Next.js application's behavior and performance, making it easier to troubleshoot problems, optimize your code, and ensure a smooth user experience. It's a critical part of maintaining a healthy and performant application.
Table Of Contents:-
- Opentelemetry and Monitoring
- Setting up Opentelemetry in Next.js
- Instrumenting Next.js code for Metrics and Tracing
- Analysing Telemetry data in Next.js
- Benefits of Opentelemetric Monitoring
Opentelemetry and Monitoring
OpenTelemetry is an open-source observability framework that allows you to collect, process, and export telemetry data, such as traces and metrics, from your applications.
Opentelemetry primarily focuses on three main types of telemetry data:
- Traces
- Metrics
- Logs
If you want to know more about what Opentelemtry exactly is, we have covered everything about it in this blog - A beginner’s Guide to Opentelemetry
The entire article talks about fixing your Next.js application with Opentelemetry, so I am pretty sure you must be already having an application ready to be analyzed. However, if you have not set up one yet, you can create one using the command given below:
npx create-next-app my-nextjs-app
cd my-nextjs-app
At Atatus, we have made the process very simple for you with our Next.js Monitoring Package. Atatus keeps track of your NestJS application to give you a complete picture of your clients' end-user experience. You can determine the source of delayed response times, database queries, and other issues by identifying backend performance bottlenecks for each API request.
To know more about what our Next.js Monitoring is all about, you can check this link out - Nest.js Monitoring with Atatus
Setting up Opentelemetry in Next.js
Here's a step-by-step guide on how to monitor a Next.js application using OpenTelemetry:
i.) Install Required Packages:
First, you need to install the necessary OpenTelemetry packages. Open your command line and navigate to your Next.js application's root directory. Run the following command to install the required packages:
npm install @opentelemetry/api @opentelemetry/node @opentelemetry/exporter-otlp @opentelemetry/plugin-httpThese packages include the OpenTelemetry API, Node.js instrumentation, the OTLP (OpenTelemetry Protocol) exporter for data export, and an HTTP plugin for automatic instrumentation of HTTP requests.
ii.) Create an OpenTelemetry Configuration File:
Create a JavaScript file, such as opentelemetry.js, in your project's root directory to configure OpenTelemetry. In this file, you'll set up and initialize the OpenTelemetry provider. Here's an example of what this file might look like:
const { NodeTracerProvider } = require("@opentelemetry/node");
const { CollectorTraceExporter } = require("@opentelemetry/exporter-otlp");
const { SimpleSpanProcessor } = require("@opentelemetry/tracing");
const { HttpInstrumentation } = require("@opentelemetry/plugin-http");
const { registerInstrumentations } = require("@opentelemetry/instrumentation");
const provider = new NodeTracerProvider();

const collectorOptions = {
  url: "http://your-otel-collector:55681/v1/trace",
};

const exporter = new CollectorTraceExporter(collectorOptions);

provider.addSpanProcessor(new SimpleSpanProcessor(exporter));
provider.register();

// Automatically instrument HTTP requests

registerInstrumentations({
  instrumentations: [HttpInstrumentation],
});
In this example, NodeTracerProvider and CollectorTraceExporter are used to set up the OpenTelemetry provider and define the exporter's configuration. You should replace http://your-otel-collector:55681/v1/trace with the actual URL of your OpenTelemetry Collector. The Http Instrumentation automatically instruments HTTP requests.
iii.) Import OpenTelemetry Configuration in Your Application:
Import the OpenTelemetry configuration file you created (e.g., opentelemetry.js) at the entry point of your Next.js application. This ensures that OpenTelemetry is initialized when your application starts. For example, you can import it in your pages/_app.js or pages/api files, depending on your use case.
import '../path/to/opentelemetry.js';

// Your Next.js application code here
With these steps, you've successfully set up OpenTelemetry in your Next.js application, and it's ready to start capturing telemetry data. In the next part of the process, you can begin instrumenting your code to collect traces and metrics.
Instrumenting Next.js code for tracing and metrics
Instrumenting your Next.js code for tracing and metrics with OpenTelemetry involves adding trace spans to specific parts of your application. These spans will capture data on the performance and behavior of your code.
Make sure you've already created and configured the OpenTelemetry provider, as described in the previous steps. You should have a file (e.g., opentelemetry.js) that initializes OpenTelemetry.
Server-Side Code:
For server-side code, you can use the @opentelemetry/api package to create trace spans around specific parts of your Next.js application. For example, you can instrument an API route as follows:
// Import necessary OpenTelemetry modules
const { trace } = require("@opentelemetry/api");

// Instrument an API route
export default async (req, res) => {

// Create a trace span for this API route
  await trace("api-route-trace", async (span) => {
    // Your API route code here
    // Add attributes or events to the span if needed
    span.setAttribute("route", "/api/myroute");
    // Ensure the span ends when your processing is complete
    span.end();
  });
};
In this example, we use the trace function from @opentelemetry/api to create a new trace span with the name api-route-trace. Within the span, you can add attributes or events to provide additional context.
Testing:
It's important to test and validate your instrumentation to ensure it's capturing the desired telemetry data accurately. You can use observability tools compatible with OpenTelemetry, such as Jaeger or other tracing and monitoring solutions, to visualize and analyze the captured data.
Analysing telemetry data in Next.js
To analyze telemetry data, you'll need to select an observability stack that is compatible with OpenTelemetry. Some popular choices include Jaeger, Prometheus, Grafana, and ELK (Elasticsearch, Logstash, Kibana). Choose a stack that best fits your monitoring and analysis requirements.
Depending on the stack you've chosen, you'll need to set up and configure the respective tools. Here's a brief overview of the setup for a few common observability tools:
- Jaeger: If you're using Jaeger for tracing, you'll need to deploy the Jaeger backend component, usually known as the Jaeger Collector, and configure it to receive trace data from your Next.js application. You may also set up the Jaeger UI for viewing traces.
- Prometheus and Grafana: For metrics and visualization, Prometheus can be used to collect and store metric data, while Grafana provides a dashboard for visualizing metrics.
- ELK Stack: If you want to analyze logs and trace data, you can use the ELK (Elasticsearch, Logstash, Kibana) stack. You'll need to configure Logstash to collect logs, Elasticsearch to store data, and Kibana to create dashboards and visualizations.
Configure Exporters:
In your OpenTelemetry configuration (e.g., opentelemetry.js), ensure that you've set up the exporters to send telemetry data to the chosen observability tools. The configuration should match the endpoint and protocol expected by your observability stack. For example, for Jaeger, the exporter configuration will be different from that for Prometheus.
Monitor and Analyze:
With your observability stack and OpenTelemetry properly configured, your Next.js application will start sending telemetry data, including traces and metrics, to the observability tools. Now, you can:
If you're using Prometheus and Grafana, consider setting up alerting rules to proactively detect and address issues. You can configure alerts to trigger when specific thresholds are exceeded, such as when error rates are too high or response times are too slow.
Analyzing telemetry data allows you to gain a deep understanding of your Next.js application's behavior and performance, making it easier to troubleshoot problems, optimize your code, and ensure a smooth user experience. It's a critical part of maintaining a healthy and performant application.
Use cases and benefits of Opentelemetric monitoring of Next.js
Integrating Opentelemetry to your Next.js application has a lot of undeniable benefits. It is prominently useful for the below-listed cases:
1. Real-Time Monitoring
OpenTelemetry enables real-time monitoring of your Next.js application. You can track requests as they flow through your system, analyze bottlenecks, and quickly respond to issues.
2. Microservices Observability
If your Next.js application is part of a larger microservices architecture, OpenTelemetry can provide end-to-end visibility, allowing you to trace requests across different services and understand the entire transaction flow.
3. A/B Testing and Feature Flagging
OpenTelemetry helps monitor the impact of A/B tests and feature flag changes by tracking user interactions and measuring the performance of different application versions.
4. Release and Deployment Validation
Before and after deploying new code or updates, OpenTelemetry can help you validate the performance, identify potential regressions, and ensure that releases meet your performance standards.
5. User Behavior Analysis
By tracking client-side interactions and performance data, you can gain insights into how users engage with your application. This can inform user experience improvements and content optimization.
6. Predictive Maintenance
OpenTelemetry can provide data for predictive maintenance by monitoring resource consumption and identifying patterns that indicate potential issues or the need for system maintenance.
7. Cost Optimization
Understanding the resource consumption of your application allows you to optimize your infrastructure costs by right-sizing and scaling resources based on actual demand.
8. Compliance and Audit Trails
OpenTelemetry can help you maintain audit trails, which are essential for compliance with various industry standards and regulations, such as GDPR, HIPAA, and SOC 2.
Benefits of having OpenTelemetry integrated with your application:
- Performance Optimization
- Error Detection and Troubleshooting
- Improved User Experience
- Optimizing Resource Utilization
- Scalability
- Security and Compliance
- Customizing Metrics
Conclusion
Integrating Opentelemetry to your application enhances the possibilities of keeping an eye on your program round the clock.
Open Telemetry is flexible in terms of the specific metrics you can collect, as it allows custom instrumentation and metrics creation based on your application's needs. So, it is easier to collect only the data that you have doubts on. This gives us the leverage of storing significantly lesser amounts of data than ending up in a myriad of unwanted data clouds.
In summary, OpenTelemetry monitoring of a Next.js application provides a wealth of benefits, from improving performance and user experience to enhancing security and cost efficiency. Its flexibility and extensive use cases make it a valuable tool for modern application monitoring and observability.
Monitor Your NextJS Applications with Atatus
Atatus keeps track of your NextJS application to give you a complete picture of your clients' end-user experience. You can determine the source of delayed response times, database queries, and other issues by identifying backend performance bottlenecks for each API request.
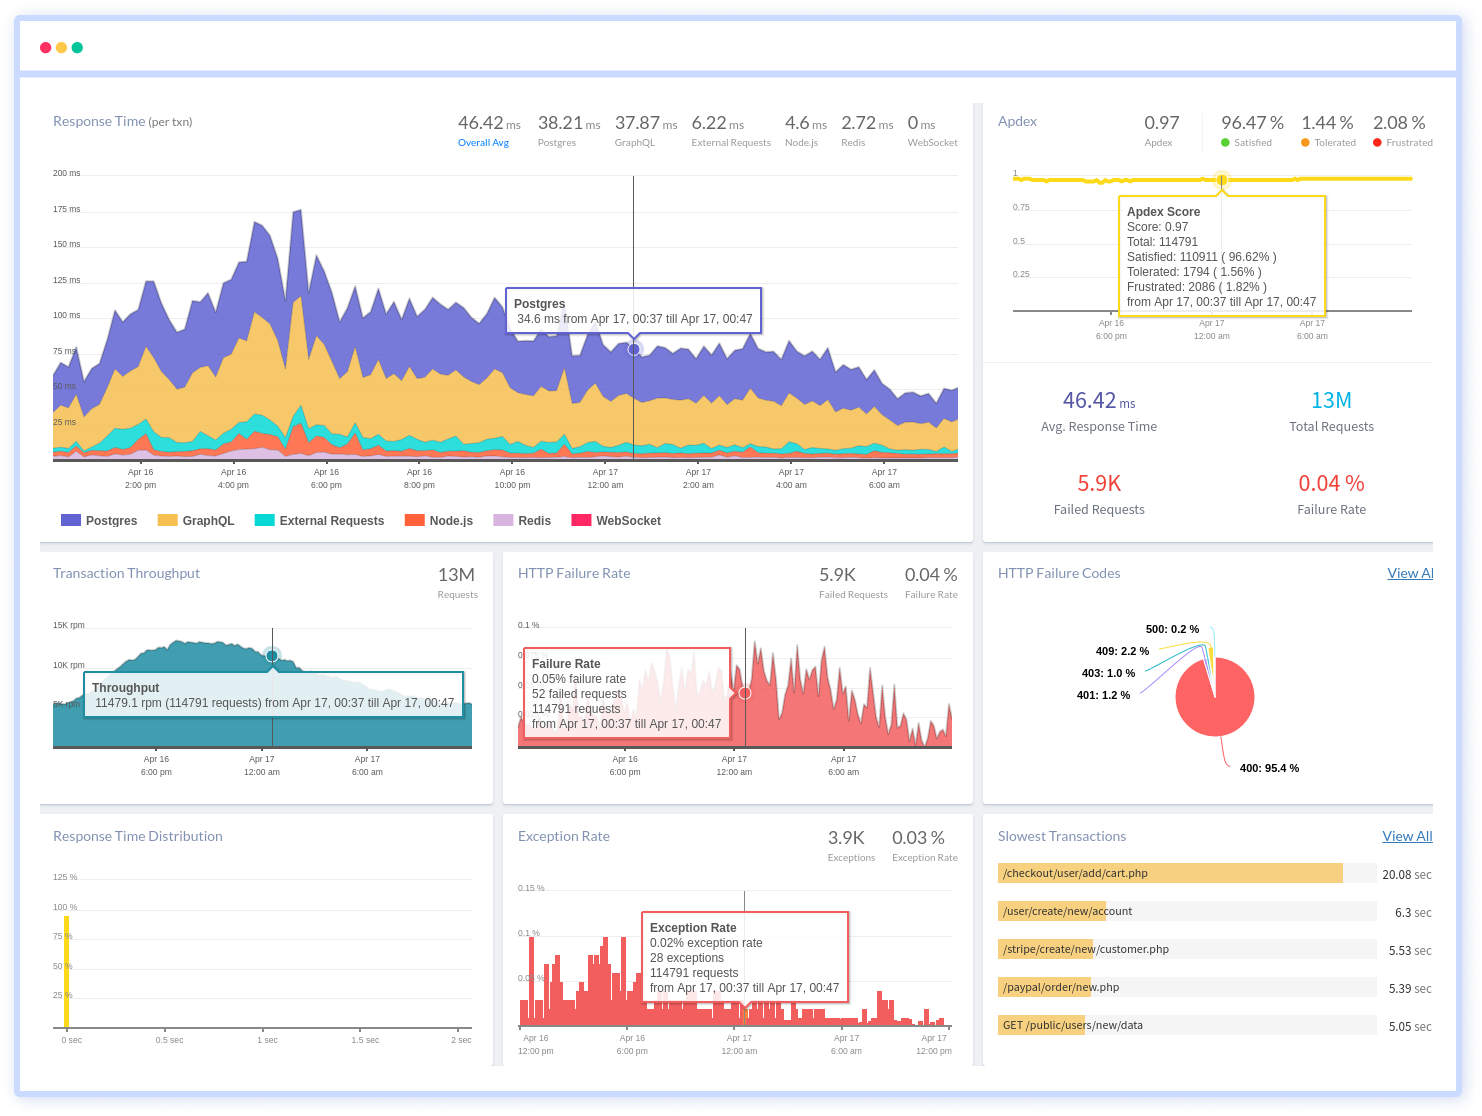
NextJS performance monitoring made bug fixing easier, every NestJS error is captured with a full stack trace and the specific line of source code marked. To assist you in resolving the NextJS error, look at the user activities, console logs, and all NextJS requests that occurred at the moment. Error and exception alerts can be sent by email, Slack, PagerDuty, or webhooks.
#1 Solution for Logs, Traces & Metrics
![]() APM
APM
![]() Kubernetes
Kubernetes
![]() Logs
Logs
![]() Synthetics
Synthetics
![]() RUM
RUM
![]() Serverless
Serverless
![]() Security
Security
![]() More
More