NestJS Monitoring with Atatus
NestJS is a popular and powerful open-source framework for building scalable and maintainable server-side applications with Node.js.
It follows the principles of Object-Oriented Programming (OOP), Dependency Injection (DI), and Functional Programming (FP), making it an excellent choice for developers who prefer a modular and organized codebase.
NestJs facilitates the creation of reliable, efficient, and scalable server-side applications using Node.js. Its combination of TypeScript, dependency injection, and modularity results in a clean and maintainable codebase.
Whether you are building RESTful APIs, real-time applications, or microservices, NestJS provides the tools and patterns needed to create scalable and efficient server-side solutions.
Here, I'll show you how to set up Atatus in your NestJS application and how to use it to monitor your application.
Table Of Contents:-
- Why Monitor your NestJS Application?
- Atatus - An Introduction
- Getting Started with NestJS and Atatus
- API Analytics for NestJS app using Atatus
- Customizing APM agent
- NestJS Performance Monitoring Metrics
- Other NestJS Monitoring Tools
- Benefits of monitoring NestJS application with Atatus
Why monitor your NestJS application?
Monitoring any application, including those built with NestJS, is crucial for a variety of reasons. These reasons pertain to both the performance and the reliability of your application, and some of the questions that help you reason out if you are in need of an APM tool are these:
- Does your application give out wrong responses even after a long wait time?
- Do you think performance bottlenecks have something to do with Database health?
- Is your third-party integrations or API buggy?
- Do you know which HTTP request has failed this time?
If your answers to these questions are not affirmative enough, i think you might be in need of an NestJS monitoring tool. plus, its an extra layer of safety if at all anything starts falling apart later. You get alerted previously and can avoid a deep fall.
Your Node.js performance monitoring tools should be easy to use, offer actionable insights, and be able to:
- Track performance at the code level
- Keep an eye on end-user experiences
- Monitor overall page load times and user interactions to ensure a seamless user experience.
- Keep track of XMLHttpRequest (XHR) timings to identify slow API calls and optimize frontend-backend communication.
- Analyze resource loading times (CSS, images, scripts) for quicker rendering and improved performance.
- Gain insights into API backend latency, usage patterns, popular endpoints, and user behaviors to inform development decisions.
- Monitor database query execution times to optimize queries and reduce database load, improving overall performance.
Without further ado, let’s see an introduction about Atatus and how to monitor your NestJS application with Atatus.
Atatus - An Introduction
Atatus is a fullstack observability platform that provides an impressive suite of monitoring tools designed for developers, DevOps, and IT operations. Harnessing the power of real-time data, Atatus enables teams to gain comprehensive visibility into their software applications, quickly identifying and resolving performance issues, errors, and bottlenecks.
Through its rich set of features, including detailed transaction tracing, application and server metrics, error tracking, and user monitoring, Atatus transforms the way organizations understand and optimize their software.
The ability to proactively spot anomalies, coupled with its insightful alerts and reporting, ensures teams can maintain optimal performance, maximize uptime, and deliver an exceptional user experience.
By empowering businesses to react swiftly and intelligently to their ever-evolving technological environment, Atatus stands as a game-changer in the realm of application performance management.
Say hello to a smoother development journey with Atatus by your side.
Getting Started with NestJS and Atatus
Let’s begin by installing Atatus for setting up NestJS:
npm install --save atatus-nodejsFor NestJS, you have to import like import * as atatus from 'atatus-nodejs' in your NestJS app and invoke start with your License key and App name:
// It must be placed above all other 'require' statements

import * as atatus from 'atatus-nodejs';

atatus.start({
    licenseKey: "YOUR_LICENSE_KEY",
    appName: "YOUR_APP_NAME",
});
Once you restart the server, you can visualize your application metrics in NestJS within few minutes.
API Analytics for NestJS app using Atatus
API analytics involves tracking and recording of various measurements pertaining to API requests and their corresponding responses. These measurements encompass factors such as how often requests are made, the time it takes to receive responses, the rate of errors, the sizes of the data being transferred, and more.
By capturing and processing API data, it becomes possible to identify patterns in how the APIs are being used. This, in turn, facilitates the detection of areas where performance might be constrained and anomalies might arise.
- Offer real-time, current insights into API usage and performance.
- Analyze data traffic patterns over time to identify hours of highest usage.
- Evaluate response times for various API endpoints.
- Keep a watchful eye on request and response payloads for third-party APIs.
- Develop a personalized dashboard to display crucial API metrics.
- Monitor API usage and implement charges for surpassing call limits, driving additional revenue through upselling.
i) Configuring Atatus API Analytics
Atatus APM Analytics systematically captures and logs every API request on an individual level, complete with relevant contextual information. This thorough process enables thorough scrutiny and evaluation of API request performance along with its associated elements.
To enable Analytics in your Nest.js application, you have the flexibility to configure it using both the atatus-config.js file and within the provided start function. Integrate the following configuration to activate Analytics functionality:
Option 1: In atatus-config.js
module.exports = {
    licenseKey: "YOUR_LICENSE_KEY",
    appName: "YOUR_APP_NAME",
    analytics: true
};
Option 2: In start function
atatus.start({
licenseKey: "YOUR_LICENSE_KEY",
appName: "YOUR_APP_NAME",
analytics: true
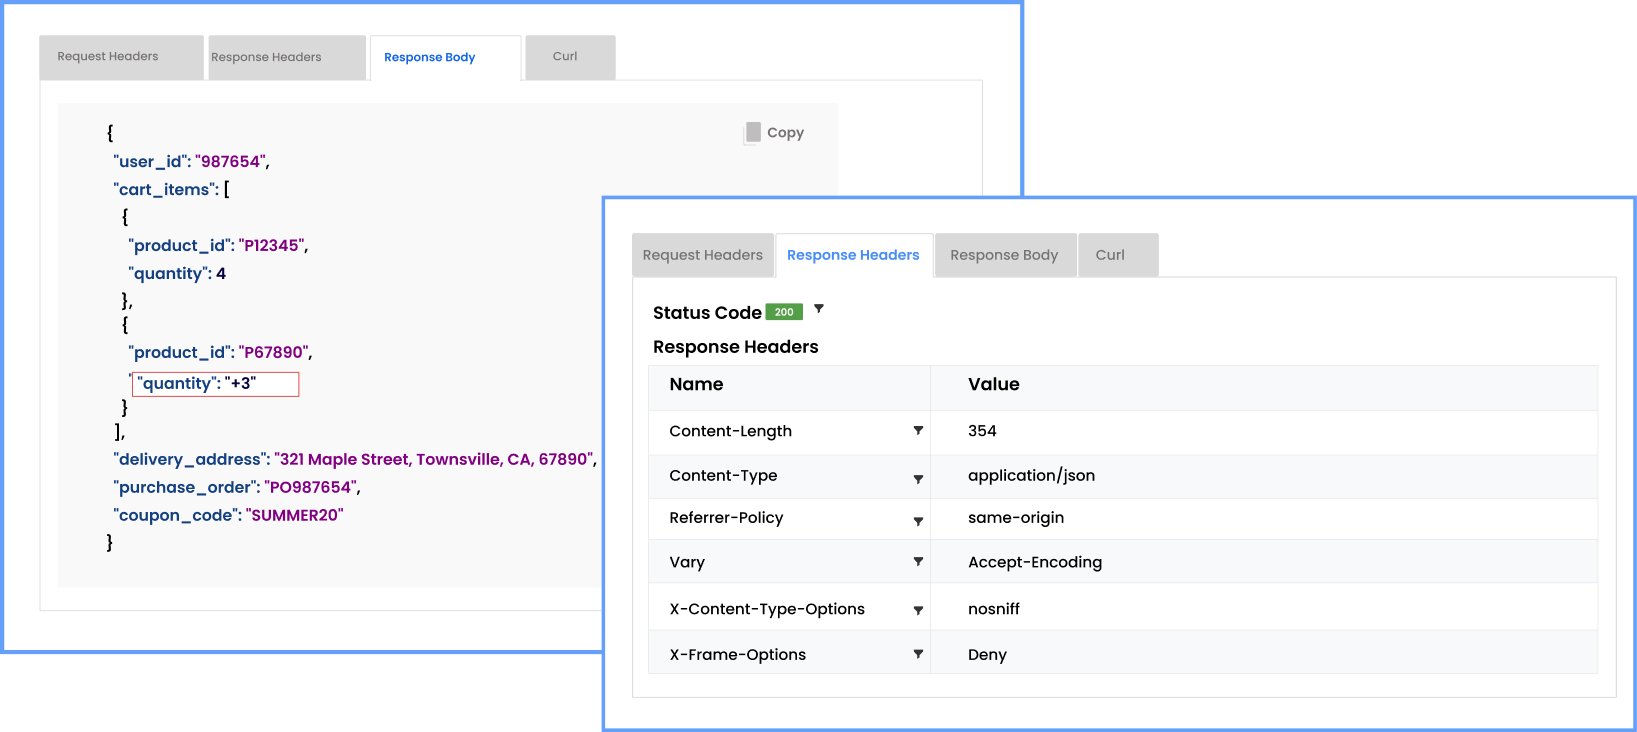
});ii.) Enable Request and Response Bodies
By default, Atatus Analytics doesn't capture request and response bodies. However, if you intend to collect them, you can enable the corresponding options during Atatus initialization. Please note that this choice is specific to Analytics and doesn't extend to APM.
request- Only the request body is captured in analytics.response- Only the response body is captured in analytics.all- Both the request and response bodies are captured in analytics.
Option 1: In atatus-config.js
module.exports = {
    licenseKey: "YOUR_LICENSE_KEY",
    appName: "YOUR_APP_NAME",
    analytics: true,
    logBody: 'all', // 'all' (or) 'request' (or) 'response'
};
Option 2: In start function
atatus.start({
    licenseKey: "YOUR_LICENSE_KEY",
    appName: "YOUR_APP_NAME",
    analytics: true,
    logBody: 'all', // 'all' (or) 'request' (or) 'response'
});
iii.) Enabling Outgoing Request Capture in Atatus Analytics
Outgoing requests are not captured by default in Atatus Analytics. Yet, if you wish to capture them, you can activate the relevant settings during the initialization of Atatus. It's important to recognize that this choice pertains exclusively to Analytics and does not extend to APM functionalities.
Option 1: In atatus-config.js
module.exports = {
    licenseKey: "YOUR_LICENSE_KEY",
    appName: "YOUR_APP_NAME",

    analytics: true,
    logBody: 'all', // 'all' (or) 'request' (or) 'response',
    analyticsCaptureOutgoing: true,
};
Option 2: In start function
atatus.start({
    licenseKey: "YOUR_LICENSE_KEY",
    appName: "YOUR_APP_NAME",

    analytics: true,
    logBody: 'all', // 'all' (or) 'request' (or) 'response'
    analyticsCaptureOutgoing: true,
});
With API analytics,
- Gain insights into users' step-by-step interactions with your APIs, helping you enhance their experience and tailor your offerings to their preferences.
- Understand how users utilize your APIs, pinpointing popular endpoints and behaviors, leading to informed decisions for optimizing API performance.
- Identify valuable features through API usage patterns, enabling you to develop premium offerings and revenue strategies based on user demands.
- Create personalized visual dashboards that showcase API metrics, fostering customer satisfaction and enabling effective communication with stakeholders.
- Segment requests based on user attributes, enabling targeted API insights for troubleshooting, trend analysis, and performance optimization across different user groups.
Customizing NestJS APM agent
Customizing gives a unique character to your application. It can be seen as an extension of what you visualized for your app to be like.
This is a sample Atatus Nest.js agent configuration:
module.exports = {

    licenseKey: "YOUR_LICENSE_KEY",
    appName: "YOUR_APP_NAME",
    analytics: true,
    logBody: 'all',
    analyticsCaptureOutgoing: true,

    tags: [
        'new-user',
        'signup'
    ],

    ignoreUrls: [
        "/v1/admin",
        /health/i
    ],

    ignoreStatusCodes: [400, 404, 500],
};
You can pass above configurations in two ways:
atatus.startfunctionatatus-config.jsfile
You can create atatus-config.js file in the root directory of your app. If the agent could not find atatus-config.js file, you can set config file path in the environment variable ATATUS_CONFIG_FILE.
export ATATUS_CONFIG_FILE="/path/to/atatus-config.jsNow let's discuss setting up each of these configurations:
i.) Add custom data
To debug errors effectively, you can send some meta data along with errors. To do this, you can set the customData:
Option 1: In atatus-config.js
module.exports = {
    licenseKey: "YOUR_LICENSE_KEY",
    appName: "YOUR_APP_NAME"

    customData: {
        plan: "premium",
        customer: "John Doe"
    }
};
Option 2: In start function
atatus.start({
    licenseKey: "YOUR_LICENSE_KEY",
    appName: "YOUR_APP_NAME"

    customData: {
        plan: "premium",
        customer: "John Doe"
    }
});
ii.) Ignore URLs
Using this option, you can define list of URLs that Atatus agent will ignore. Ignore URLs accepts array of string or Regex.
Option 1: In atatus-config.js
module.exports = {
    licenseKey: "YOUR_LICENSE_KEY",
    appName: "YOUR_APP_NAME",

    ignoreUrls: ["/v1/admin", /health/i]
};
Option 2: In start function
atatus.start({
    licenseKey: "YOUR_LICENSE_KEY",
    appName: "YOUR_APP_NAME",

    ignoreUrls: ["/v1/admin", /health/i]
});
iii.) Ignore status codes
If you want to ignore certain status codes from HTTP failures, you can use this option. Ignore status codes accepts array of integer.
Option 1: In atatus-config.js
module.exports = {
    licenseKey: "YOUR_LICENSE_KEY",
    appName: "YOUR_APP_NAME",

    ignoreStatusCodes: [400, 404, 500]
};
Option 2: In start function
atatus.start({
    licenseKey: "YOUR_LICENSE_KEY",
    appName: "YOUR_APP_NAME",

    ignoreStatusCodes: [400, 404, 500]
});
iv.) Proxy configurations
You can use a proxy server by configuring a proxy URL when starting with Atatus.
Option 1: In atatus-config.js
module.exports = {
    licenseKey: "YOUR_LICENSE_KEY",
    appName: "YOUR_APP_NAME",

    proxy: "http://localhost:8080"
};
Option 2: In start function
atatus.start({
licenseKey: "YOUR_LICENSE_KEY",
appName: "YOUR_APP_NAME",
proxy: "http://localhost:8080"
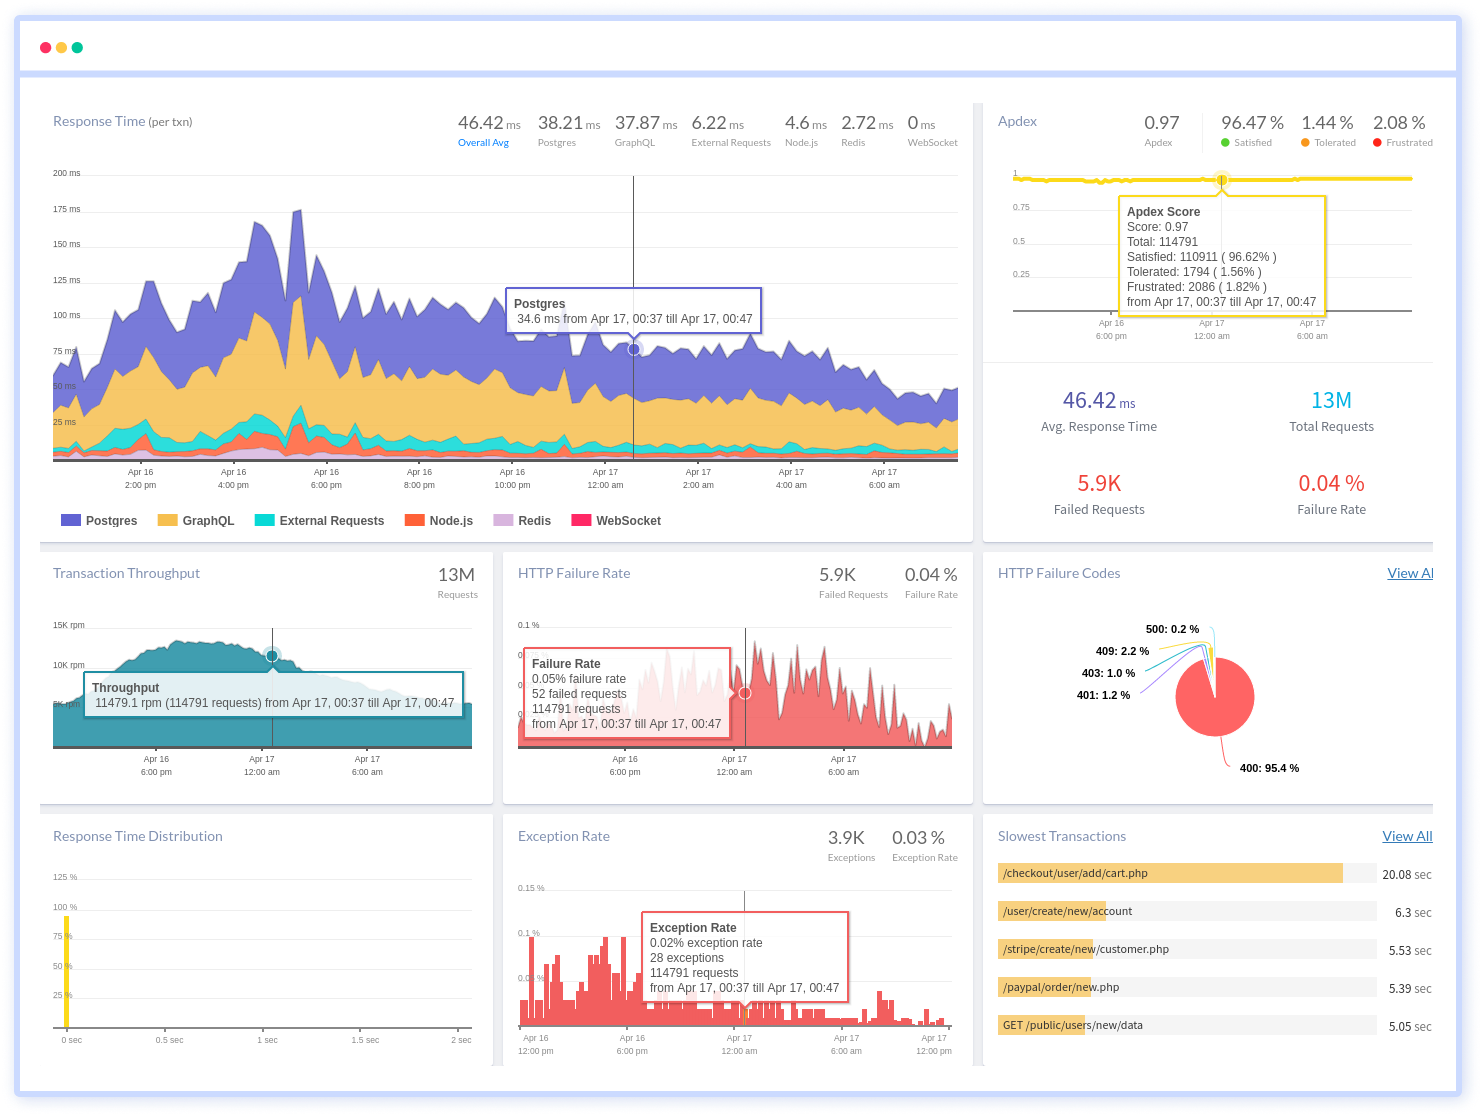
});NestJS Performance Monitoring Metrics
As mentioned earlier, Atatus offers a comprehensive monitoring package for NestJS. mentioned below is a list of features that Atatus provides for a seamless monitoring experience:
- Response Time: This metric gauges the time taken by the server to respond to a request. Elevated response times could suggest potential performance bottlenecks.
- Throughput: Throughput quantifies the count of requests or transactions your application can manage in a specified timeframe. It helps you understand the overall load your application is handling.
- Database Performance: Atatus is capable of overseeing database queries and offering insights into query response times, sluggish queries, and other database-centric matters.
- External Service Calls: If your Nest.js application interacts with external services, Atatus facilitates performance monitoring for these interactions.
- Transaction Traces: Transaction traces furnish comprehensive insights into individual requests, detailing the time allocated to different components and services.
- Distributed Tracing: This feature facilitates the tracking of requests as they traverse diverse services and components, yielding a comprehensive perspective on your application's performance.
- Error Rate: This metric monitors the proportion of requests resulting in errors. Keeping an eye on error rates aids in identifying issues that require attention.
- Apdex Score: The Apdex score is a user satisfaction measure founded on response times and error rates. It numerically assesses how well your application aligns with user expectations.
- CPU Usage: Observing CPU usage aids in recognizing whether your application is making efficient use of the available processing capacity.
- Memory Usage: Monitoring memory usage allows you to uncover memory leaks and ensure optimal memory utilization.
Other NestJS Monitoring Tools
Monitoring a NestJS application is crucial to ensure its performance, stability, and availability. There are several tools and services available that can help you effectively monitor your NestJS application, including Atatus. Here's a list of tools you can use:
- New Relic: New Relic is another popular APM tool that offers monitoring and troubleshooting capabilities for your NestJS application. It provides detailed performance metrics, real-time alerts, and transaction traces to help you identify and resolve performance issues.
- Datadog: Datadog is a monitoring and analytics platform that allows you to monitor the health and performance of your NestJS application. It offers customizable dashboards, alerts, and integrations with various services, enabling you to gain deep insights into your application's behavior.
- Sentry: Sentry specializes in error tracking and monitoring for applications. It captures and reports errors in real-time, helping you identify and fix issues that could affect your NestJS application's reliability.
- ELK Stack (Elasticsearch, Logstash, Kibana): The ELK Stack is commonly used for log management and analysis. You can integrate NestJS application logs with Elasticsearch using Logstash, and then visualize and analyze the log data using Kibana.
Selecting the right monitoring tool depends on your specific requirements, the level of detail you need, the integrations available, and your budget. It's often a good practice to combine multiple tools to cover different aspects of monitoring, such as performance, errors, logs.
Benefits of Monitoring NestJS application with Atatus
While reading through this article, you might have had questions about why chose Atatus for monitoring your NestJS application. Rightfully so, but before making a decision, take a look at this as well!
Monitoring your NestJS application with Atatus offers numerous benefits that significantly enhance your application's performance, reliability, and user experience. Let’s look at what are these:
Technical Benefits:
- Improves application uptime and reduces downtime by increasing the availability of the application
- Identifying and diagnosing code-level problems
- It is important to avoid network outages as much as possible
- Reduces MTTR and thus increases the appeal of the application
- Gives you a comprehensive compilation of metrics including logs, traces and their patterns.
- An alert in the form of a notification will be sent when there is an error in the system
Business Benefits:
- Increased conversion rates for your business
- Improves SEO and adaptability in line switch current trends
- As the application has better uptime and response time ultimately results in better UI for end users.
- Improves productivity of your application, achieves better turnover ratio in the long run
- Since most of the monitoring operations are available under one umbrella, it gets easy on the pockets and reduces operational costs
Conclusion
In summary, overseeing the performance of a NestJS application is paramount to guarantee its efficient operation and the timely resolution of any challenges.
Atatus presents a comprehensive solution tailored for monitoring and analyzing the performance of NestJS applications, empowering developers to swiftly pinpoint and diagnose issues.
Through Atatus, developers can attain profound insights into their application's performance, monitor critical metrics, and receive alerts regarding potential concerns.
Altogether, Atatus stands as an invaluable tool for developers striving to elevate the performance of their NestJS applications and ensure alignment with user expectations.
Monitor Your NestJS Applications with Atatus
Atatus keeps track of your NestJS application to give you a complete picture of your clients' end-user experience. You can determine the source of delayed response times, database queries, and other issues by identifying backend performance bottlenecks for each API request.

NestJS performance monitoring made bug fixing easier, every NestJS error is captured with a full stack trace and the specific line of source code marked. To assist you in resolving the NestJS error, look at the user activities, console logs, and all NestJS requests that occurred at the moment. Error and exception alerts can be sent by email, Slack, PagerDuty, or webhooks.
#1 Solution for Logs, Traces & Metrics
![]() APM
APM
![]() Kubernetes
Kubernetes
![]() Logs
Logs
![]() Synthetics
Synthetics
![]() RUM
RUM
![]() Serverless
Serverless
![]() Security
Security
![]() More
More


![New Relic vs Splunk - In-depth Comparison [2026]](/blog/content/images/size/w960/2024/10/Datadog-vs-sentry--19-.png)
![New Relic vs Sentry - Which Monitoring Tool to Choose? [2026]](/blog/content/images/size/w960/2024/10/VS--1-.png)