How to Reduce Errors and Improve Reliability in High-Traffic Node.js Applications with APM?
Node.js has become the go-to runtime for building modern, high-performance applications. Its event-driven, non-blocking I/O model makes it particularly well-suited for apps that demand speed and scalability, such as real-time chats, gaming backends, streaming platforms, fintech dashboards, and e-commerce systems.
It’s no surprise that some of the world’s largest companies like Netflix, PayPal, LinkedIn, Walmart rely on Node.js to deliver services at scale.
But scaling any application comes with risk, and Node.js is no exception.
What works seamlessly when serving 1,000 requests per minute can crumble under the weight of 100,000 requests per second. Latency grows, errors multiply, and frustrated users leave. Unlike minor bugs in a development environment, errors in production at scale are amplified exponentially.
A 1% error rate in a low-traffic app might be unnoticed.
That same 1% error rate in a high-traffic app could mean tens of thousands of failed transactions every hour.
For DevOps teams, engineers, and SREs, the challenge isn’t just to build fast Node.js applications - it’s to keep them stable and error-free as they scale.
And here’s the truth: Logs and basic monitoring can’t keep up with the complexity of high-traffic systems.
You need real-time visibility into your Node.js apps. You need to know when requests slow down, why errors spike, and what part of your stack is responsible. That’s exactly where Node.js Application Performance Monitoring (APM) tools like Atatus become mission-critical.
What’s in this guide?
- The Hidden Causes of High Error Rates in Node.js Apps
- Why Traditional Debugging Doesn’t Work?
- How Node.js APM Tools Reduce Error Rates?
- Metrics That Actually Matter for Node.js Reliability
- Building a Culture of Error Prevention (Not Just Detection)
- Why Atatus is the Best APM for Node.js Teams?
- Conclusion
- FAQs on Nodejs APM
The Hidden Causes of High Error Rates in Node.js Apps
Most Node.js apps don’t fail because of one catastrophic bug. Instead, error rates creep upward because of hidden inefficiencies that only surface under heavy load.
Let’s break down the most common bottlenecks that DevOps and engineering teams face.
Event Loop Blocking
The single-threaded event loop is the foundation of Node.js. It handles requests asynchronously, allowing the app to scale efficiently.
But here’s the catch: any blocking code like CPU-intensive operations, synchronous loops, stops the loop in its tracks. While one request hogs the event loop, every other request gets stuck waiting.
Example:
A Node.js app parses a massive CSV synchronously on the main thread. Suddenly, response times for all users spike, leading to timeouts and errors.
Database Bottlenecks
Most Node.js apps rely on relational or NoSQL databases. A slow query, missing index, or overloaded database node can cause the entire application to stall.
Example:
A product search query in an e-commerce app runs fine under normal load (200ms). During Black Friday, traffic spikes reveal the query’s inefficiency, it balloons to 2.5 seconds, causing cascading errors in dependent services.
API and Dependency Latency
External APIs (payment gateways, third-party integrations, microservices) are part of almost every Node.js architecture. If one dependency slows down, it delays your entire request chain.
Example:
A payment gateway starts returning responses after 1.5s instead of 200ms. Customers experience failed checkouts and abandoned carts.
Memory Leaks and Garbage Collection Issues
Node.js apps often suffer from memory leaks caused by closures holding references, improper caching, or uncleaned event listeners. Over time, this results in bloated memory usage and eventual crashes when the garbage collector fails to keep up.
Example:
A user session cache grows indefinitely, consuming memory until the process is killed by the container orchestrator.
Unhandled Exceptions and Promise Rejections
Node.js applications depend heavily on asynchronous code and promises. Without proper error handling, a single unhandled rejection can crash the process.
Example:
An API integration fails with a 500 error. The promise rejection is not caught, taking down the entire service.
Scaling Complexity in Distributed Systems
As teams move to Kubernetes, containers, and microservices, debugging issues across distributed systems becomes exponentially harder. One error may appear across multiple services, making root cause analysis nearly impossible with traditional monitoring.
Node.js apps don’t just fail — they fail silently until traffic exposes the cracks.
💡 Before diving in, check out What's Slowing Down Your App? Common Performance Issues APM Tools Detects - a quick guide for DevOps, SREs, and engineers to spot bottlenecks early.
Why Traditional Debugging Doesn’t Work?
When an app starts showing high error rates, most teams reach for the same tools: logs, system metrics, and manual debugging.
But in high-traffic Node.js environments, these approaches quickly fall short.
Logs Are Noisy and Reactive
Logs provide raw information but not context. In high-traffic apps, they can generate gigabytes of data per hour. Finding the root cause of a single issue means digging through endless entries, often after the fact.
Metrics Lack Root Cause Insight
System metrics like CPU, memory, and disk utilization tell you something is wrong but not why. High CPU could mean inefficient code, a memory leak, or a slow database query.
Debugging Slows Teams Down
Manual debugging in production environments is risky and time-consuming. By the time an issue is identified, users have already been affected.
Distributed Systems Multiply Complexity
Modern Node.js apps rarely exist in isolation. They communicate with APIs, databases, caches, and microservices. Logs from one system don’t provide visibility into the entire chain of events.
Result: Teams are stuck in firefighting mode that chasing symptoms instead of solving root causes.
How Node.js APM Tools Reduce Error Rates?
Application Performance Monitoring (APM) tools are purpose-built to solve the challenges of debugging Node.js applications at scale.
Instead of drowning teams in logs, they provide correlated, real-time insights into how your application behaves.
🐞 Tired of rising error rates in high-traffic Node.js apps?
Atatus helps you track errors in real time, so you can fix issues before users even notice.
Start Free TrialHere’s how Node.js APM tools help reduce error rates:
- Request & Transaction Tracing
Nodejs APM tool traces every request, showing exactly how much time was spent in each function, or dependency. This allows engineers to pinpoint hotspots instantly.
- Error Detection with Stack Traces
Every error is captured with detailed stack traces, request parameters, and environment details. Instead of guessing, you know precisely what failed.
- Event Loop Monitoring
Nodejs APM tool monitors event loop delays to catch blocking code before it cripples performance. Teams can proactively fix CPU-heavy operations.
- Database and Dependency Monitoring
Nodejs APM tool tracks slow queries, frequent DB calls, and failing external APIs. This visibility ensures teams fix bottlenecks that would otherwise spike error rates.
Scenario:
During a flash sale, your checkout API suddenly sees a spike in failed transactions. With Nodejs APM tool:
- You see a real-time error spike alert.
- Transaction tracing points to a slow “insert order” query in PostgreSQL.
- Engineers fix the query (adding an index), reducing errors instantly.
Without Nodejs APM tool, that issue would have gone unnoticed until customers complained — costing sales and damaging trust.
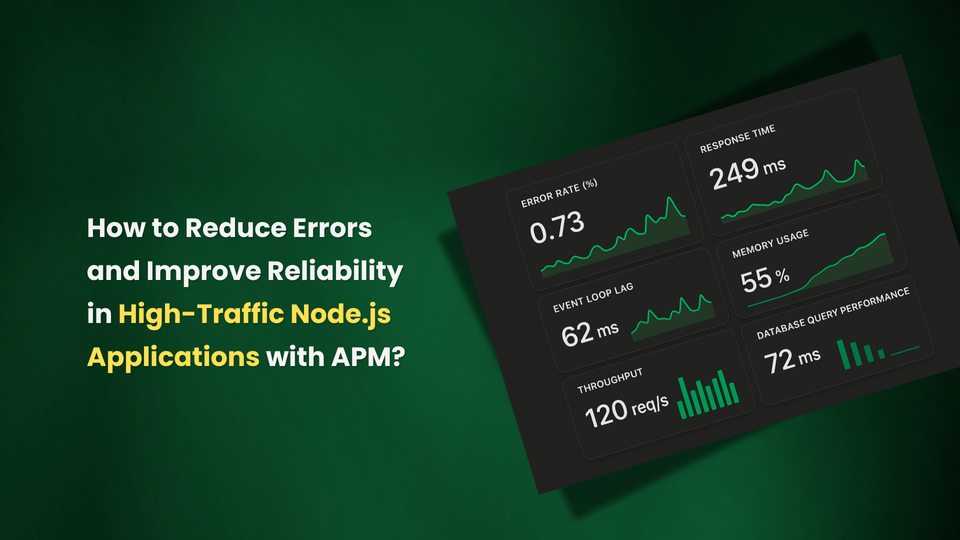
Metrics That Actually Matter for Node.js Reliability
When it comes to reducing error rates, not all metrics matter equally. A good APM helps you focus on the right ones.
Here are the key metrics Atatus tracks for Node.js apps:
- Error Rate (%): The percentage of failed requests broken down by endpoint and transaction.
- Response Time: Average latency for each route, so you know which requests slow down under load.
- Event Loop Lag: Detects blocking code before it becomes a major issue.
- Memory Usage: Identifies leaks and abnormal growth patterns.
- Throughput: Requests per minute/hour — correlated with error spikes.
- Database Query Performance: Highlights slow queries and their frequency.
- External API Failures: Tracks downstream errors to isolate external vs internal issues.
Instead of chasing vanity metrics, Nodejs APM tool surfaces the data that directly impacts reliability and error rates.
Building a Culture of Error Prevention (Not Just Detection)
Reducing error rates isn’t just about fixing problems faster. It’s about creating a culture where errors are anticipated, prevented, and learned from.
Nodejs APM tool enables teams to move from reactive to proactive:
- Pre-Production Testing: By integrating APM tool into your staging environments, teams can run load tests and catch bottlenecks before shipping to production.
- Capacity Planning: Nodejs APM tool help DevOps forecast scaling needs, avoiding last-minute scrambles during traffic spikes.
- Team Collaboration: With shared dashboards and integrations, developers, DevOps, and SREs have access to the same performance insights. No silos, no blind spots.
👉 The result: fewer late-night incidents, faster deployments, and confidence at scale.
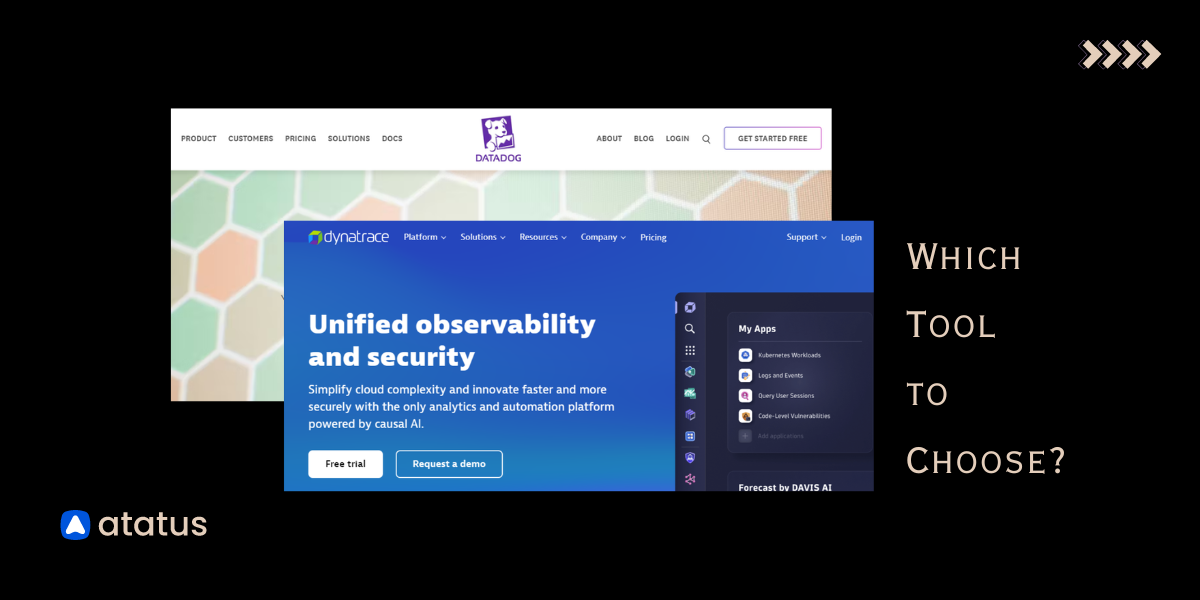
Why Atatus is the Best APM for Node.js Teams?
The Node.js APM market has many players like Datadog, New Relic, and Dynatrace. But many of them are:
- Expensive and complex.
- Data-volume-based (penalizing you for scaling).
- Heavy on setup and instrumentation.
Atatus is different...
- Zero-Instrumentation Setup: Start monitoring Node.js apps in minutes.
- OpenTelemetry Support: Future-proof and standards-compliant.
- Full-Stack Observability: APM, infrastructure, logs, and RUM in one platform.
- High-Resolution Metrics: Real-time, detailed data, not samples.
- Cost-Effective Pricing: Scales with your team, not your traffic volume.
- Developer-Centric: Intuitive dashboards and alerts engineers actually use.
👉 For DevOps teams and engineers under pressure to deliver reliable, high-traffic Node.js apps, Atatus isn’t just another tool. It’s a trusted performance partner.
💡 Choosing an APM tool for your Nodejs Application? Compare Atatus with leading alternatives and find out why we’re the smarter choice
Conclusion
Running a high-traffic Node.js application comes with challenges which rising error rates, unpredictable bottlenecks, and frustrated users if issues go unnoticed. Traditional monitoring can only take you so far; what you need is real-time, full-stack visibility into your Node.js apps.
That’s where Atatus Node.js APM makes the difference. From pinpointing slow queries and memory leaks to tracking distributed traces across microservices, Atatus helps DevOps, engineers, and SREs fix problems before they impact your users. With zero-instrumentation onboarding, intuitive dashboards, and cost-effective pricing, it’s built to grow with your team and your traffic.
If you’re ready to minimize downtime, cut error rates, and scale Node.js apps without guesswork, Atatus is the solution you’ve been searching for.
⚡ Scaling your Node.js application?
Get complete visibility into requests, queries, and microservices with Atatus to grow with your app.
Start Free TrialFAQs on Nodejs APM
What is a Node.js APM tool?
A Node.js Application Performance Monitoring (APM) tool helps you track, analyze, and improve how your Node.js apps run in real time. It does more than just basic server monitoring. It follows each request, keeps an eye on the event loop, checks database queries, and collects detailed error information. This makes it easier for DevOps teams, SREs, and developers to find bottlenecks, unhandled promise rejections, memory leaks, and slow external services.
With a Node.js APM like Atatus, you get full transaction visibility, error root-cause analysis, and actionable insights that reduce downtime and improve reliability.
Why do high-traffic Node.js apps face higher error rates?
Node.js apps are built to handle concurrency efficiently, but as traffic scales, small inefficiencies can turn into critical failures:
- Event loop blocking: A single blocking function can delay thousands of requests.
- Database/API bottlenecks: External dependencies add latency that compounds under load.
- Memory leaks: Issues that may not appear at low traffic become catastrophic at scale.
- Unhandled exceptions & promise rejections: one missed error handler can crash an app.
High traffic amplifies every weakness. What seems negligible in development can snowball into cascading failures during peak loads. Without proactive monitoring, teams often only discover these issues when users are already impacted.
How does Atatus reduce error rates?
Atatus reduces error rates in Node.js applications by giving engineering teams real-time visibility into every layer of the stack:
- Error tracking with full stack traces → instantly identify root causes.
- Event loop monitoring → detect lag before it impacts user experience.
- Request & transaction tracing → pinpoint slow endpoints, services, or queries.
- Database & dependency monitoring → see how external services affect performance.
- Intelligent alerts & anomaly detection → get notified before small issues escalate.
Instead of reactive firefighting, Atatus enables a proactive approach which help DevOps teams prevent downtime, shorten MTTR, and maintain user trust even during peak traffic.
Can Atatus work with microservices?
Yes. Modern Node.js apps often run on distributed microservice architectures, and Atatus is built for that complexity. With distributed tracing, you can follow a request as it travels across multiple services, APIs, and databases. This gives you a single, correlated view of your system, rather than fragmented metrics from individual services.
Atatus integrates seamlessly with containerized and orchestrated environments like Docker and Kubernetes, making it an excellent fit for microservices-based Node.js deployments.
Is Atatus only for Node.js apps?
Not at all. While Atatus provides deep, specialized visibility for Node.js APM, it is a full-stack monitoring platform. That means you can monitor:
- Backend APM → Node.js, Python, Java, PHP, Ruby, .NET and more.
- Frontend performance → Real User Monitoring (RUM) for websites and web apps.
- Infrastructure & containers → servers, Kubernetes, and cloud resources.
- Logs & errors → centralized logging with powerful search and correlation.
This unified approach means DevOps and SRE teams don’t need multiple tools - Atatus gives end-to-end observability across the stack while staying cost-effective.
#1 Solution for Logs, Traces & Metrics
![]() APM
APM
![]() Kubernetes
Kubernetes
![]() Logs
Logs
![]() Synthetics
Synthetics
![]() RUM
RUM
![]() Serverless
Serverless
![]() Security
Security
![]() More
More