What are Core Web Vitals and How to Monitor It

It used to be simple to improve the performance of a website. However, the introduction of client-side JavaScript has opened up a whole new world of ways for websites to be painfully slow. Measuring this increased slowness will require the development of new measurements. They're known as the Core Web Vitals by Google.
Google announced Core Web Vitals in May 2020, a set of three indicators that serve as the gold standard for evaluating a website's user experience. These measurements, which focus on load performance, interaction, and visual stability, make it easier to collect UX metrics by indicating which frontend performance indicators are most important.
Suboptimal ratings will not only lead to greater turnover and lost revenue, but may also make it harder for potential customers to locate your website in the first place when Core Web Vitals is added into Google's PageRank algorithm in May 2021. As a result, collecting and analysing these metrics is critical not only to the usability goals of your frontend engineering team but also to the bottom line of your company.
We will go over the following:
- What are the Core Web Vitals?
- Metrics of Core Web Vitals
- What Makes Core Web Vitals So Important?
- Monitor Core Web Vitals with Atatus RUM
- Field Tools to Measure Core Web Vitals
What are the Core Web Vitals?
Google's Web Vitals initiative aims to provide unified guidelines for quality signals that are critical to providing a great web experience.
Over the years, Google has given a number of tools for measuring and reporting performance. Some developers are excellent at using these tools, while others have struggled to keep up with the quantity of both tools and data.

It should not be necessary for website owners to be performance experts in order to comprehend the level of experience they are providing to their users. The Web Vitals effort strives to simplify the landscape and assist websites in focusing on the Core Web Vitals, which are the most important metrics.
Core Web Vitals are a subset of Web Vitals that apply to all websites and will appear in all Google products. All website owners should keep track of them. Each of the Core Web Vitals represents a distinct part of the user experience, is field measurable, and reflects real-world experience with a significant user-centric outcome.
Over time, the metrics that makeup Core Web Vitals will change. The current settings for 2021 comprise the following metrics that focus on three areas of the user experience: loading, interactivity, and visual stability.
Metrics of Core Web Vitals
Let's take a look at each of the Web Vitals metrics one by one, beginning with the Largest Contentful Paint (LCP).
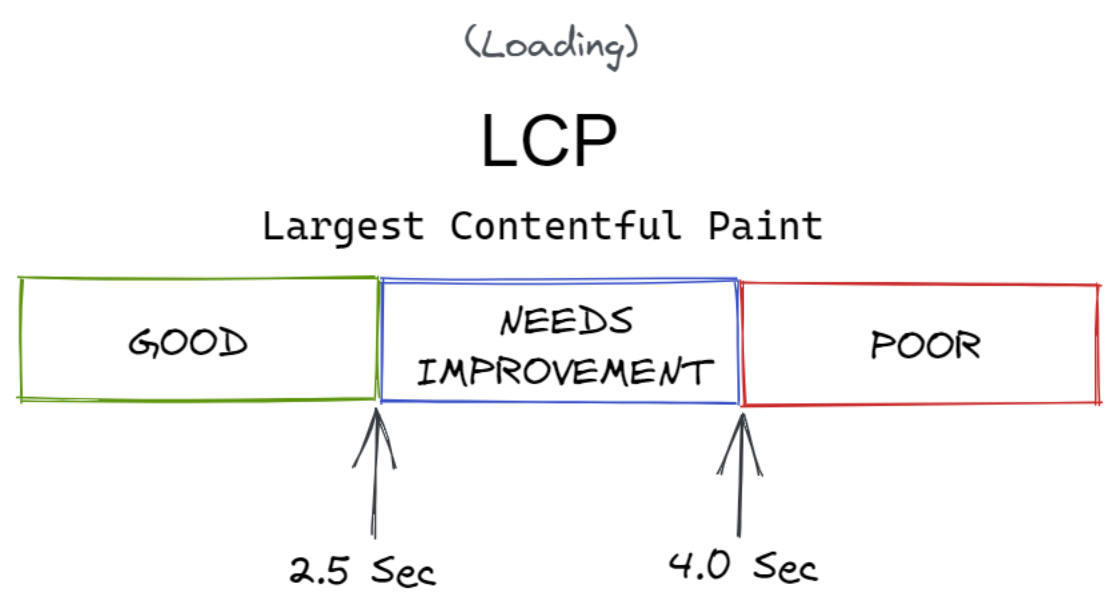
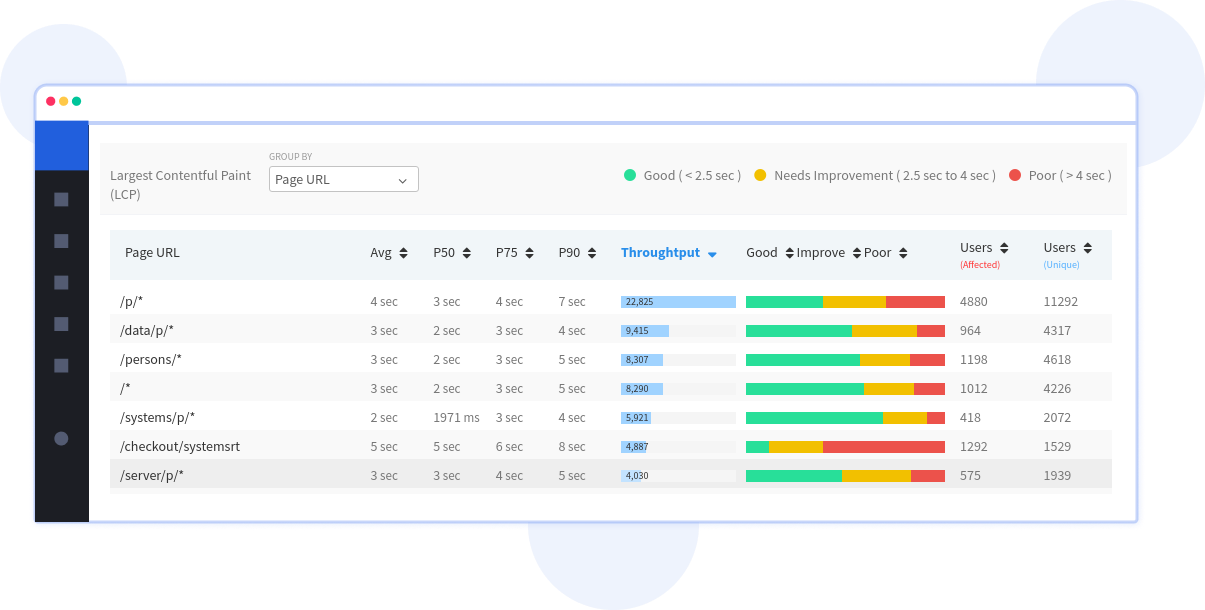
#1 Largest Contentful Paint (LCP)
This is the simplest of the metrics. It counts how quickly you can draw the largest object on the page, which is most likely the piece of content the visitor is interested in. This could be a banner image, text, or anything else. It's obvious that it's the most significant item because it's the largest contentful element on the page. We used to measure the similarly titled First Contentful Paint (FCP), but LCP has been viewed as a superior indicator for when the content that the visitor is most likely looking for is drawn.
LCP is intended to assess loading performance and is a decent proxy for all of the classic performance metrics (e.g., Time to First Byte (TTFB), DOM Content Loaded, Start Render, Speed Index) but from the perspective of the user. It is a simpler, single metric that seeks to offer a good indicator of page load. It does not cover all of the information given by other metrics, but it is a simpler, single metric that attempts to give a good indication of page load.
(To receive the full benefit of any ranking gain, websites must be inside the green measurements for all three Core Web Vitals. Different values of a Core Web Vital measure across two pages could result in different page experience rankings if they are outside of the good range.)
Cause for Poor LCP Score
A low LCP score could be caused by a variety of factors, including slow server response times, render-blocking JavaScript and CSS, and having your greatest content resources be too huge and take too long to load.
How to Improve LCP Score
You may enhance your LCP score by optimizing your crucial rendering path, CSS, and graphics.
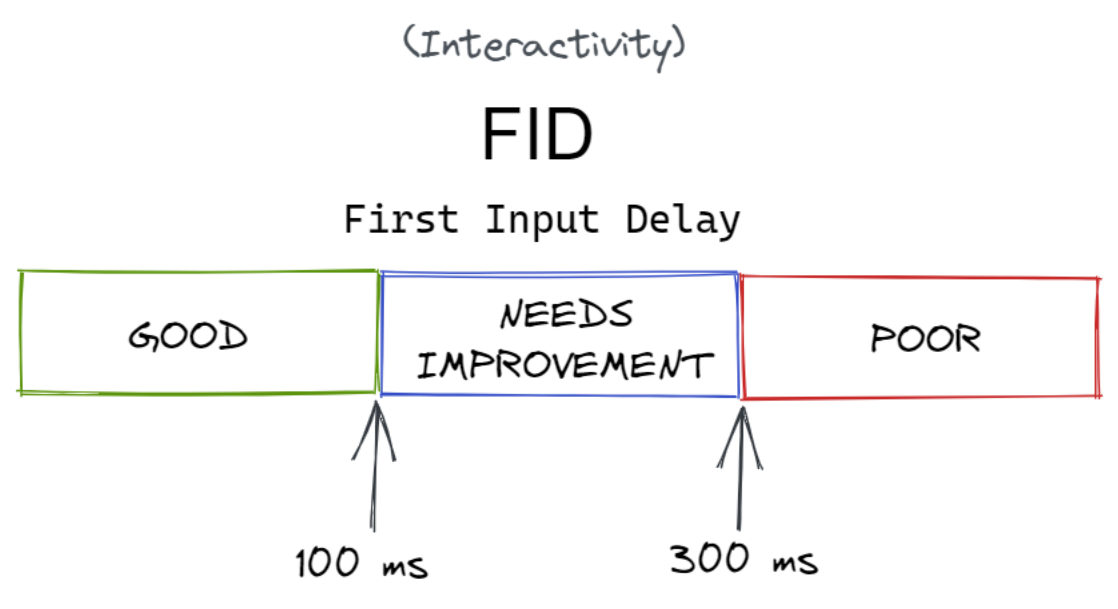
#2 First Input Delay (FID)
The time between when a user interacts with a page, such as clicking on a link or a button, and when the browser processes that click is measured by this second metric. Its purpose is to determine how interactive a page is. It's an unpleasant experience for the user if all of the content is loaded but the page is unresponsive.
This measure cannot be mimicked since it is dependent on when a user clicks or otherwise interacts with a website and how long it takes for that interaction to be completed. When utilizing a testing tool without any direct user contact, Total Blocking Time (TBT) is a decent proxy for FID, but keep an eye on Time to Interactive (TTI) when looking at FID.
Cause for Poor FID Score
A browser's main thread (opens in a new tab) is often busy parsing and executing JavaScript code, which results in a low FID score. The main thread can't reply to a user's interaction while it's busy.
How to Improve FID Score
If you want to improve your FID score, look at what's keeping the browser from being interactive. Reducing JavaScript execution time, decreasing work done in the main thread, and reducing the impact of third-party code are all things you can do to enhance your FID score.
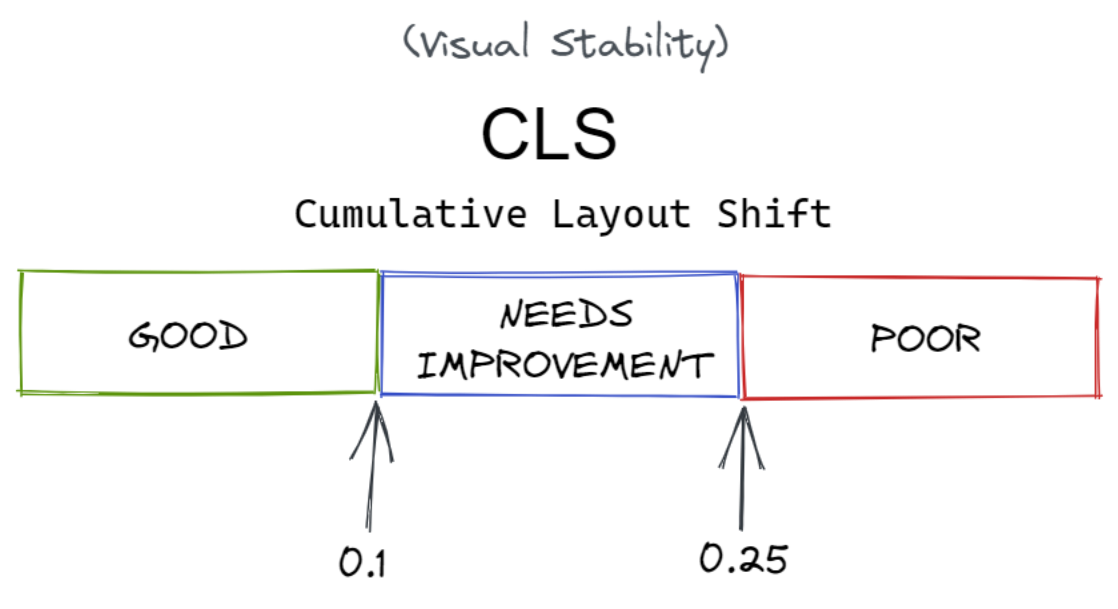
#3 Cumulative Layout Shift (CLS)
For a variety of reasons, this metric is quite unlike any other that has come before it. Its purpose is to determine the page's visual stability, or how much it leaps around as new information is added. I'm sure we've all started reading an article only to have the text move about while graphics, adverts, and other information load.
Users will find this startling and bothersome, therefore it's better to keep it to a minimum. Worse yet, when the button you were about to press moves and you accidentally press another one. CLS makes an attempt to account for these changes in layout.
Cause for Poor CLS Score
Unexpected layout changes are common as a result of an unknown image or ad dimensions, asynchronously loaded resources, and instances where new DOM elements are dynamically added to a page above previously loaded content. As a result, content that has already been loaded gets pushed to the side.
How to Improve CLS Score
You can avoid unexpected layout shifts by specifying size characteristics for your photos and videos, as well as not placing content above already-loaded content.
And the non-core web vitals are:
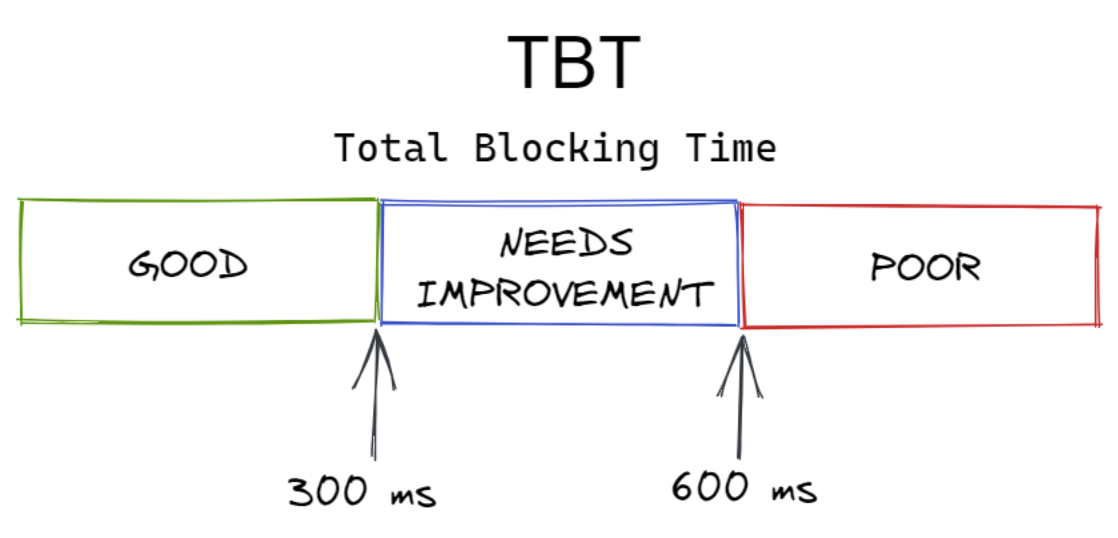
#4 Total Blocking Time (TBT)
Total Blocking Time (TBT) measures the total time in milliseconds between First Contentful Paint (FCP) and Time To Interactive (TTI), during which the main thread becomes unresponsive to user input.
TBT has a strong correlation with First Input Delay (FID), hence it's the greatest option for testing in a laboratory environment where real-world user interaction isn't available. While TBT can be collected in the field, it is easily influenced by user activity and so isn't a trustworthy metric for determining how long it takes for a page to respond to user input. As a result, TBT is exclusively used in lab data.
Cause for Poor TBT Score
JavaScript loading, parsing, or execution that isn't required. When you examine your code in the Performance panel, you can notice that the main thread is performing work that isn't required to load the page.
How to Improve TBT Score
Reduce JavaScript payloads by separating code, eliminating unneeded code, or loading third-party JavaScript more efficiently to increase your TBT score.
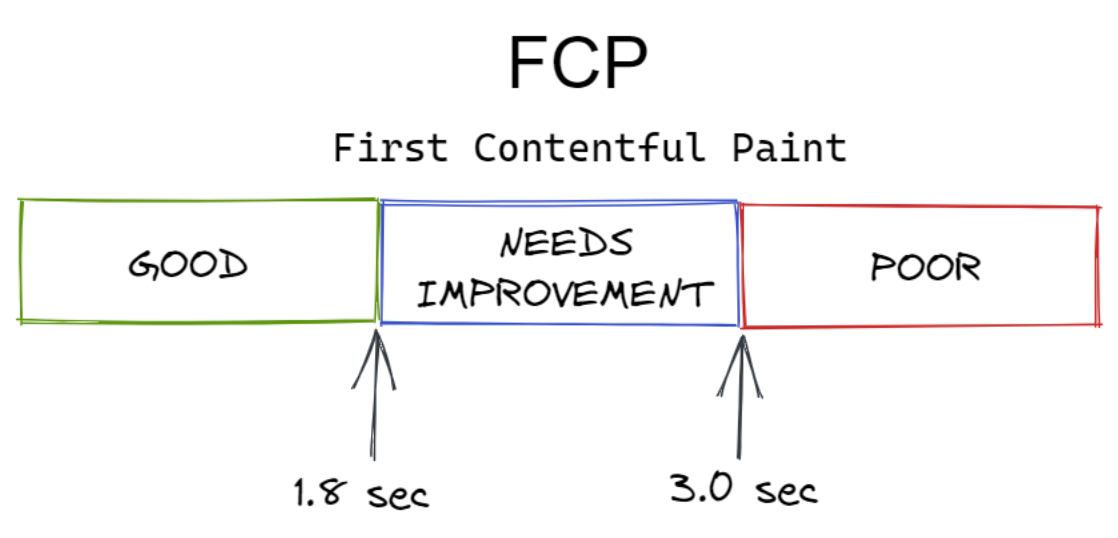
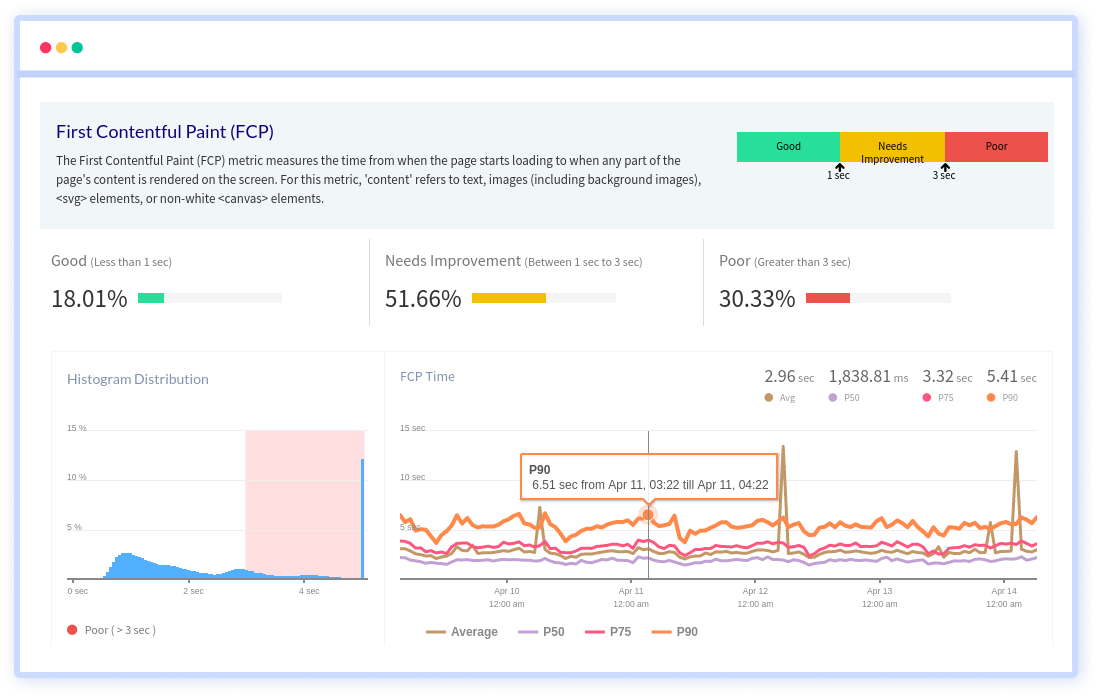
#5 First Contentful Paint (FCP)
FCP (First Contentful Paint) is a non-Core Web Vital that tracks the time it takes for a page to load to the point where any part of the page's content is shown on the screen. A quick FCP assures users that something is going on. Text, images (including background images), <SVG> elements, and non-white <canvas> components are all considered content in this context.
The FCP should be as low as possible. FCP can be seen in both field and lab data.
Cause for Poor FCP Score
Low FCP scores are frequently caused by long server response times and render-blocking resources.
How to Improve FCP Score
You can improve your FCP score by removing render-blocking files, minimizing unnecessary CSS, minifying CSS, and using a CDN.
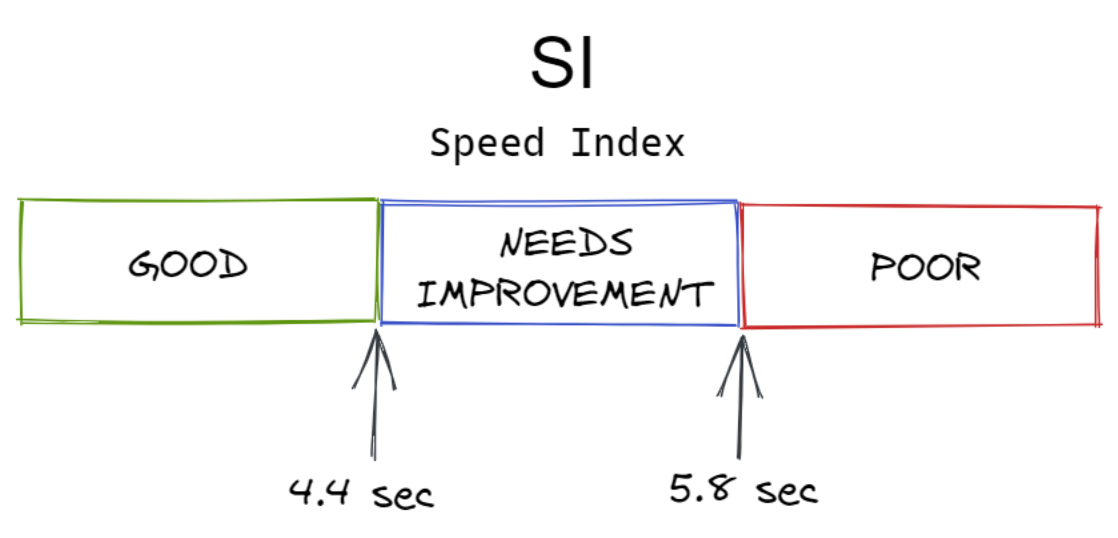
#6 Speed Index (SI)
The Speed Index (SI) is a non-Core Web Vital that determines how quickly a page's contents are visibly populated during page load. It's calculated by analysing your page's load behaviour frame by frame and noting the visual advancement between frames every 100 milliseconds.
Speed Index (SI) can be found in both field and lab data.
Cause for Poor SI Score
Anything that slows down the page's loading time will lower your SI score. Some of the factors described for the other metrics, such as the main thread being blocked, are also applicable here.
How to Improve SI Score
Your SI score will improve if you concentrate on improving overall page load performance.
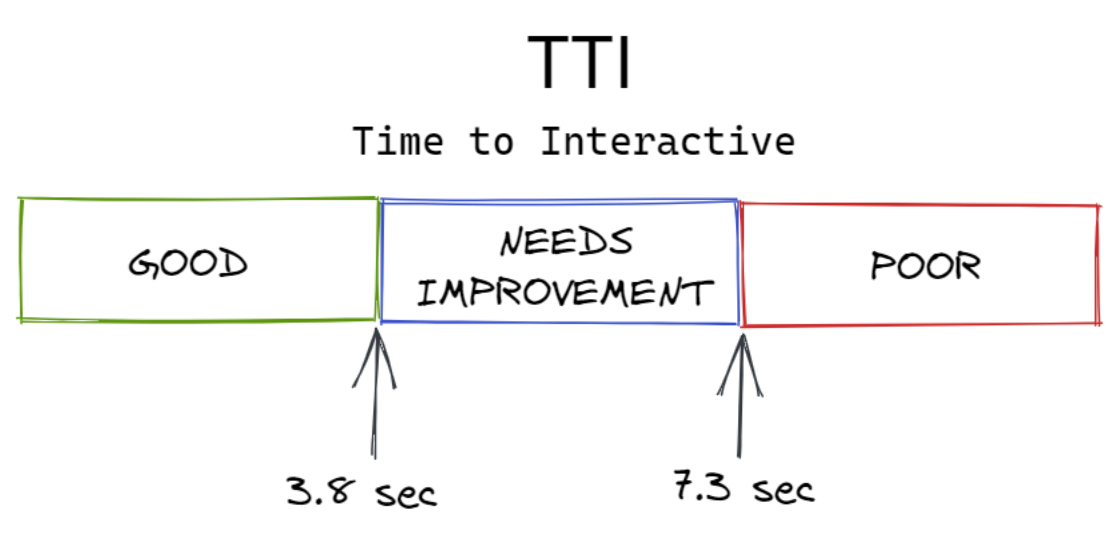
#7 Time to Interactive (TTI)
Time to Interactive (TTI) measures how long it takes for a website to fully load and interact. While measuring TTI in the field is possible, it is not recommended because user activity can have a significant impact on your page's TTI. As a result, TTI should only be used in a lab data context.
Cause for Poor TTI Score
Many of the factors that contribute to poor scores in the other metrics we discussed apply to TTI as well because it is a metric that incorporates the other metrics.
How to Improve TTI Score
You can run a Lighthouse performance audit to understand how to enhance TTI for a given site and pay attention to any unique possibilities the audit suggests.
What Makes Core Web Vitals So Important?
The three major reasons you (and everyone else) should be concerned about Core Web Vitals are as follows:
- Visitors like quick websites that are simple and enjoyable to use on any device and from any place. As a result, if you provide a terrific user experience, you'll generate more money.
- As of mid-June 2021, Core Web Vitals has become a ranking criterion. While we don't anticipate seeing a significant shift right immediately, and relevance will continue to be far more essential, we do expect its significance to rise with time.
- Since you're offering an excellent user experience, passing the Core Web Vitals assessment is likely to result in fewer users fleeing back to the SERP and Google has hinted that they may start displaying a "Good Page Experience" badge in their search results. These are referred to as "indirect ranking factors" since they have an impact on searcher behaviour (for example, more clicks on pages with this badge), which is reflected back into Google's algorithms.
Monitor Core Web Vitals with Atatus RUM
Atatus allows you to incorporate Core Web Vitals into the broader picture of your web application's user-facing performance by collecting them through Real User Monitoring (RUM). Along with traffic volume data and typical RUM performance indicators, RUM's out-of-the-box Performance Overview dashboard displays p75 values for each Core Web Vital as they relate to Google's set thresholds. If you need to set a tighter criterion, you can tweak the dashboard to reflect a greater percentile.
With this clear perspective, you can characterize your web page's overall load performance and start looking for potential bottlenecks. You can use the included tags to filter the metric data to find issues that affect specific locations, device kinds, or browsers. You can also add additional layers of insight to the dashboard, such as user behaviour metrics.
The dashboard displays a list of page views for the selected time period, and you can utilize filters to isolate views from a certain subset of users or views that exceed the acceptable threshold for a specific Core Web Vital.
When you click on a specific page view, you'll be sent to its RUM waterfall, which lists each resource that the page loads in order, as well as how long it took. The waterfall graphs RUM metrics (including the Core Web Vitals) to provide insight into the potential causes of load performance bottlenecks.
What makes Atatus so useful is that it provides you with all of the information you need to act, including waterfall timelines, session information, and instance-level diagnostics. This means you can actively improve your Core Web Vitals scores rather than merely monitoring them.
You can schedule a demo or try the software for 14 days for free to see how it works.
Field Tools to Measure Core Web Vitals
Let's have a look at some of the most popular tools to check how our Web Vitals appear:
For each Core Web Vital, the Chrome User Experience Report collects anonymized, real user measurement data. This data fuels products like PageSpeed Insights and Search Console's Core Web Vitals report, allowing site owners to instantly monitor their performance without having to manually instrument analytics on their pages.
Conclusion
The Core Web Vitals are a set of fundamental metrics that attempt to describe the user experience of exploring the internet. As a strong supporter of improving website performance, I applaud any effort to do so, and the ranking impact of these measures has certainly sparked a lot of interest in the web performance and SEO communities.
There are a lot of tools you can employ to monitor core web vitals, one of which is Atatus Real User Monitoring. The inclusion of Core Web Vitals scores to Atatus RUM provides critical information into your application's frontend performance, allowing you to maintain a consistent user experience while also ensuring that your website maintains a high Google ranking.
#1 Solution for Logs, Traces & Metrics
![]() APM
APM
![]() Kubernetes
Kubernetes
![]() Logs
Logs
![]() Synthetics
Synthetics
![]() RUM
RUM
![]() Serverless
Serverless
![]() Security
Security
![]() More
More