How to use Java Stack Traces to debug your code like a Pro
Codes are the core of any application program. These codes can make or break a program. If you are a developer you might have come across certain fault lines while executing a program. Yes, I meant the errors and exceptions.
In Java, errors and exceptions are both types of throwable objects that can be thrown by the Java Virtual Machine (JVM) or by Java code. While errors and exceptions are similar in that they both indicate that something unexpected has occurred, there are some differences between the two - while exceptions can be recovered, errors cannot be done so and they just put a sudden stop to everything.
We have listed all these Exceptions in Java, for you, in a separate blog.
Debugging these errors is the best option in front of us. But debugging is not an easy task, because there is no one-size-fits-all technique when it comes to debugging. That is why we are going to use our Java Stack Trace for handling these errors and exceptions. Head into the blog right now!
Table Of Contents
- Introduction to Java Stack Trace
- How to Read and Analyze Java Stack Traces
- Handling exceptions in Java
- Tools for Analyzing Java Stack Traces
- Leveraging Java Stack Traces for performance optimization
Introduction to Java Stack Trace
In Java programming, a stack trace is a list of method calls that shows the path of execution when an exception or error occurred. It is a textual representation of the state of the call stack at a particular point in time during program execution.
When an exception or error occurs, Java creates a stack trace that includes the name of the method where the exception occurred, the line number of the source code file where the method call was made, and a list of all the method calls that led up to the error. The stack trace is printed to the console or logged to a file and can be used to diagnose and debug the error.
The stack trace can help developers identify the cause of an exception, such as a null pointer exception or an array out-of-bounds exception. It can also help developers pinpoint the location in the code where the error occurred, making it easier to fix the problem.
Java stack trace example
Now let’s look at an example where we are feeding values of three integers a,b, and c. then we divide them with each other to obtain an answer.
public class GreatestNumber {
  //method which returns the quotient
  public static int greater(int a, int b, int c) {
    int div;
    if (a > b && a > c) {
      div = a / b;
      return div;
    } else if (b > c && b > a) {
      div = b / c;
      return div;
    } else {
      div = c / a;
      return c;
    }
  }
  //main method
  public static void main(String[] args) {
    int m;
    m = greater(0, 3, 10);
    System.out.println(m);
  }
}
If we input zero or a negative integer in any of these values for a,b, or c, it would trigger an exception.
The stack trace for the above example:-
Exception in thread "main" java. lang.ArithmeticException: / by zero
at GreatestNumber.greater(GreatestNumber.java:18)
at GreatestNumber.main(GreatestNumber.java:27)
In this example, an unhandled ArithmeticException occurred in the greater method of the GreatestNumber class. The stack trace shows that the exception occurred at line 18 of GreatestNumber.java, which is inside the greater method. It also shows that the greater method was called from the main method of GreatestNumber, which is located at line 27 of GreatestNumber.java class.
The stack trace includes the exception type (NullPointerException), the thread in which the exception occurred (main), and the call stack leading up to the exception. This information can be used to diagnose and fix the error in the code.
Check out 11 Java Debugging Tips for Developers with Eclipse!
How to Read and Analyze Java Stack Traces
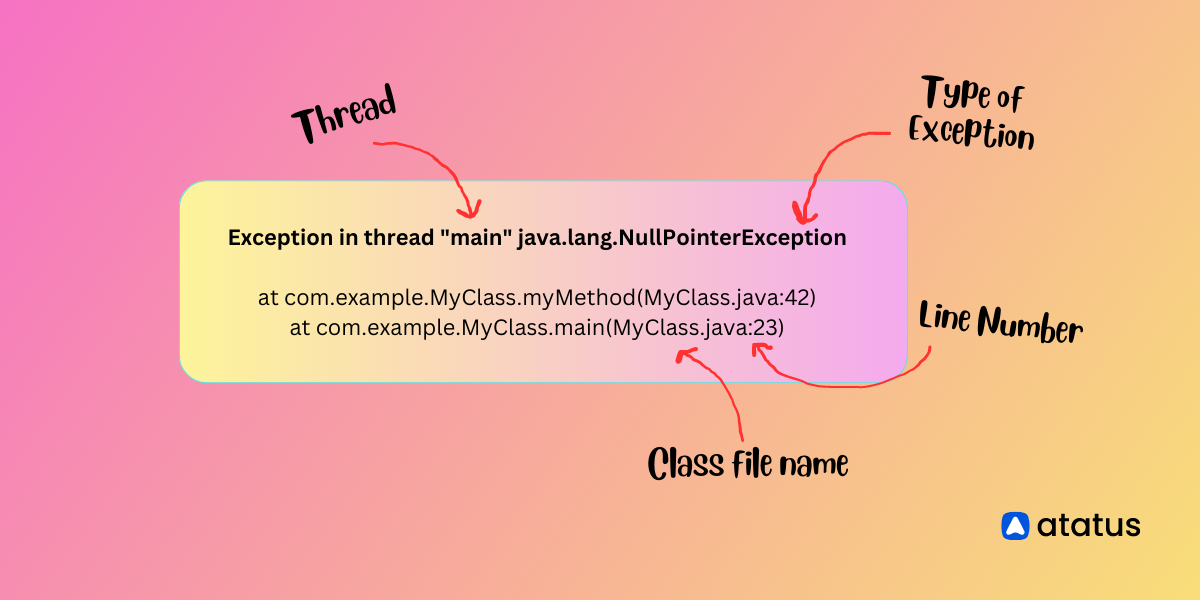
This is an example of a Java Stack Trace. When we look at a text like this, it might be baffling for some. So we are going to breakdown this for easy understanding.
Exception in thread "main" java.lang.NullPointerException
at com.example.MyClass.myMethod(MyClass.java:42)
at com.example.MyClass.main(MyClass.java:23)
In this example, an unhandled NullPointerException occurred in the myMethod method of the MyClassclass. The stack trace shows that the exception occurred at line 42 of MyClass.java, which is inside the myMethod method. It also shows that the myMethod method was called from the main method of MyClass, which is located at line 23 of MyClass.java.
When faced with such a trace, how do we interpret them? Here are some pointers that might help you:
- Identify the exception type: The first line of the stack trace usually contains the exception type. This will give you a clue as to what kind of error occurred.
- Look for the location of the error: The stack trace will list the class, method, and line number where the error occurred. This will help you identify the specific location in your code where the error occurred.
- Analyze the call stack: The stack trace will show you the series of method calls that led up to the error. By analyzing the call stack, you can identify which methods were called and in what order. This information can help you identify any unexpected or incorrect behavior in your code.
- Look for nested exceptions: Sometimes, an exception can be caused by another exception. In these cases, the stack trace will show a nested exception. Look for any nested exceptions to understand the full context of the error.
- Use an IDE or debugger: If you're having trouble analyzing the stack trace, consider using an IDE or debugger. These tools can help you step through your code and identify the cause of the error.
By following these steps, you can effectively read and analyze a Java stack trace to identify and fix errors in your code.
Handling Exceptions in Java
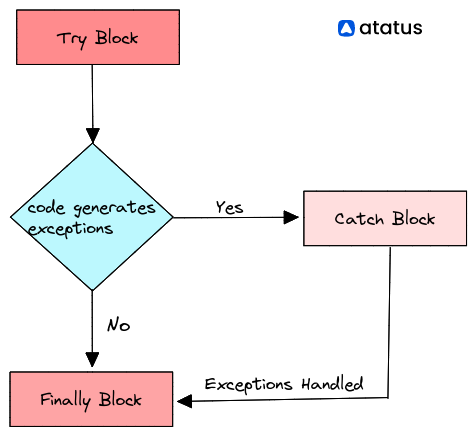
Exceptions occurs every time. We can't stop them, but we can manage them so that they don't affect our program. One common way to do so is by implementing try-catch and try-catch-finally statements.
#1 Try-catch block
try {
  // Protected code
} catch (ExceptionName e1) {
  // Catch block
}
As you can see, we have placed the code to generate an exception inside the try block. A catch block follows every try block. Whenever try black confronts an exception, it is caught by the catch block.
Example of a try-catch block:
class Main {
  public static void main(String[] args) {
    try {
      // code that generate Exception
      int divideByZero = 5 / 0;
      System.out.println("Rest of code in try block");
    } catch (ArithmeticException e) {
      System.out.println("ArithmeticException => " + e.getMessage());
    }
  }
}
Output
ArithmeticException => / by zeroIn this example, we are trying to divide an integer by zero. As you know, this is not logically possible and hence creates an exception. Rest of the code inside the try block is therefore skipped. The catch block catches this exception and executes the statement given inside it. If there is no exception thrown within the try block, the catch part gets skipped and the program produces a regular output.
In both the try and catch blocks, you can include multiple statements within one try or catch block or you can also put each statement under separate try blocks.
Each catch block is an exception handler which handles the Exception to the type indicated by its argument. This argument must include the name of the class that it inherits from the throwable class.
#2 Try-catch-finally block
Finally block is an eternal option. It always executes whether an exception is thrown or not.
Finally block follows the try and catch blocks. There can be zero or more catch blocks for each try block, but only one final block. It is usually used for clean-up type of statements.
Syntax for executing a Finally Block -
try {
  //code
} catch (ExceptionType1 e1) {
  // catch block
} finally {
  // finally block always executes
}
An example of Java exception handling using finally block -
class Main {
  public static void main(String[] args) {
    try {
      // code that generates Exception
      int divideByZero = 5 / 0;
    } catch (ArithmeticException e) {
      System.out.println("ArithmeticException => " + e.getMessage());
    } finally {
      System.out.println("This is the finally block");
    }
  }
}
Output
ArithmeticException => / by zeroFinally block includes important clean up codes like codes that might have been accidentally skipped by return, continue or break and for closing a file or connection. So, incorporating finally block is a good choice to prevent any leaks.
Tools for Analyzing Java Stack Traces
Here are some popular tools that can be used for analyzing Java stack traces:
- Atatus: Atatus Java Performance Monitoring is an awesome tool to monitor the performance and availability of your Java Application. To make bug fixing easier, every Java error is captured with a full stack trace and the specific line of source code marked. This allows you to identify the source of delayed load times, route changes and others down to every individual request. Atatus also offers many integrations such as for alerting, notifications and its own SDKs to build custom integrations.
- Eclipse: Eclipse is a popular Java IDE that provides a built-in debugger for analyzing stack traces. The debugger allows you to step through your code, set breakpoints, and examine variables and objects at runtime.
- IntelliJ IDEA: IntelliJ IDEA is another Java IDE that provides advanced debugging tools for analyzing stack traces. It includes a powerful debugger that supports multiple threads and provides detailed information about exceptions and errors.
- jstack: jstack is a command-line tool that is included with the Java Development Kit (JDK). It can be used to generate a stack trace of a running Java process, which can then be analyzed to identify performance issues or deadlocks.
- VisualVM: VisualVM is a graphical tool that is included with the JDK. It provides a user-friendly interface for analyzing the performance of Java applications, including analyzing stack traces and profiling CPU and memory usage.
- StackTraceAnalyzer: StackTraceAnalyzer is a free and open-source tool for analyzing Java stack traces. It can parse and analyze stack traces from multiple sources, including log files, command-line output, and Eclipse debug sessions. It provides detailed information about exceptions and errors, including the root cause and the sequence of method calls leading up to the error.
Leveraging Java Stack Traces for Performance Optimization
Java stack traces can be leveraged for performance optimization by identifying performance bottlenecks and optimizing code accordingly. Here are some ways to do this:
- Analyze the call stack: By analyzing the call stack in a Java stack trace, you can identify which methods are taking the most time to execute. Look for methods that are called frequently or take a long time to execute. These methods are good candidates for optimization.
- Identify slow database queries: If your application is interacting with a database, slow database queries can be a major performance bottleneck. Look for database-related exceptions in the stack trace, such as SQL exceptions or timeouts, and analyze the SQL queries being executed. Optimize the queries to improve performance.
- Look for CPU-intensive operations: CPU-intensive operations, such as sorting or searching large data sets, can also be a performance bottleneck. Look for methods that are taking a long time to execute due to CPU-intensive operations, and optimize the algorithms used in those methods.
- Profile your code: Use Java profiling tools to identify performance bottlenecks in your code. Profiling tools can provide detailed information about how your code is executed, including the time spent in each method and the number of times each method is called. Use this information to identify performance bottlenecks and optimize your code accordingly.
- Monitor your application: Monitor your application in production to identify performance issues that may not be apparent during development. Look for slow response times, high CPU or memory usage, or other performance metrics that may indicate performance issues using Java Monitoring tools. Use this information to optimize your code and improve application performance.
Conclusion
We all know deploying code is not an easy task. Especially when we are adding new inputs to an already existing well-working application. But it's the worst when this new code just breaks up our pre-existing application.
In such a case, debuggers are a good choice but they might fall heavy on your pockets. That is when you might want to consider leveraging Java Stack Trace and feeding all those details onto that log file. Now, that is such a sigh of relief.
These log files just make it all of a sudden more easier, we can pinpoint where the error occurred, in what instance and so on. A fix in the right spot would do the trick. But then again, if you have a really big log file, it is not so easy to track things.
That is why you must adapt to using the Atatus log monitoring solution. Not only do they provide you with a good track analysis but even give you a heads-up before any problem actually occurs. Make sure to try it out!
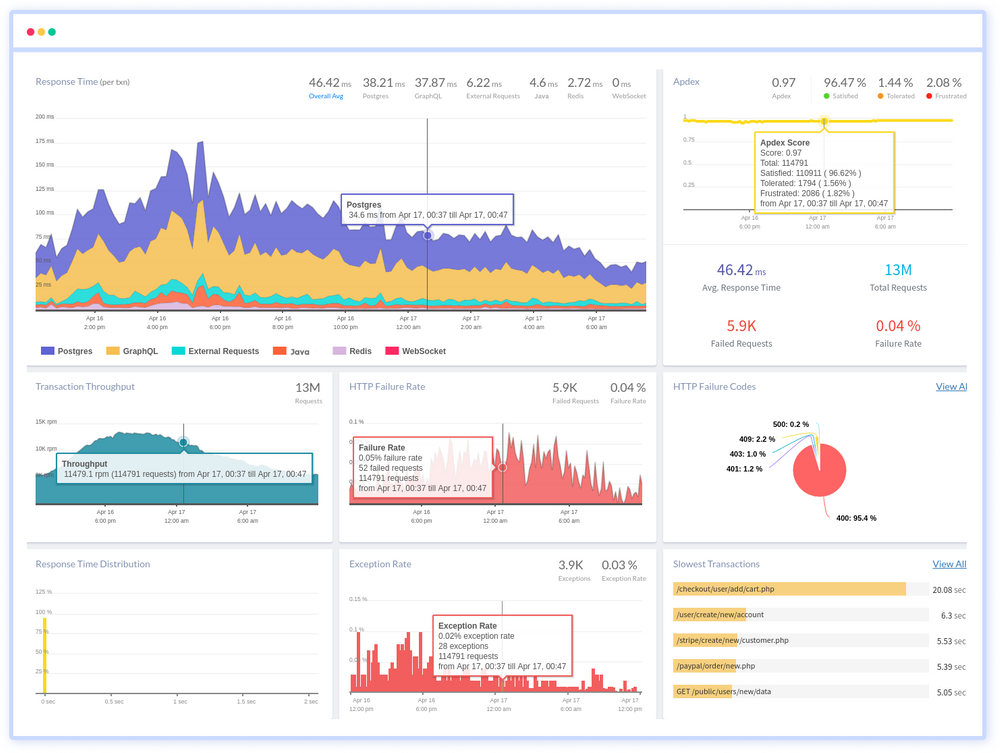
Monitor your Java application for errors & exceptions with Atatus
With Atatus Java performance monitoring, you can monitor the performance and availability of your Java application in real-time and receive alerts when issues arise. This allows you to quickly identify and troubleshoot problems, ensuring that your application is always running smoothly.
One of the key features of Atatus is its ability to monitor the performance of your Java application down to the individual request level. This allows you to see exactly how long each request is taking to process, as well as any errors or exceptions that may have occurred. You can also see a breakdown of the different components of your application, such as the web server, database, and external services, to see how they are affecting performance.
In addition to monitoring performance, Atatus also allows you to track the availability of your Java application. This means that you can see when your application is down or experiencing errors, and receive alerts when this occurs. You can also see how long your application has been running, as well as any uptime or downtime trends over time.
Atatus also offers a range of tools and integrations that can help you to get the most out of your monitoring. For example, you can integrate Atatus with popular tools like Slack, PagerDuty, and Datadog to receive alerts and notifications in your preferred channels. You can also use Atatus's APIs and SDKs to customize your monitoring and build custom integrations with your own tools and systems.
Overall, Atatus is a powerful solution for monitoring and managing the performance and availability of your Java application. By using Atatus, you can ensure that your application is always running smoothly and that any issues are quickly identified and resolved.
If you are not yet a Atatus customer, you can sign up for a 14-day free trial .
#1 Solution for Logs, Traces & Metrics
![]() APM
APM
![]() Kubernetes
Kubernetes
![]() Logs
Logs
![]() Synthetics
Synthetics
![]() RUM
RUM
![]() Serverless
Serverless
![]() Security
Security
![]() More
More