Sinatra Performance Monitoring
Get end-to-end visibility into your Sinatra performance with application monitoring tools. Gain insightful metrics on performance bottlenecks with Ruby monitoring to optimize your application.
Why Sinatra Issues Escape Early Detection
Minimal Stack Visibility
Sinatra’s lightweight nature exposes little runtime context in production, leaving engineers blind to where execution time is actually spent.
Latency Without Context
Request latency increases gradually, but the underlying cause remains unclear across leader election, sync, and disk paths.
Request Processing Layers
Requests traverse multiple processing layers before reaching application logic, breaking execution visibility.
Hidden Blocking Code
Synchronous operations block request handling silently. Under load, small blocking paths cascade into system-wide slowdown.
Memory Growth Drift
Object allocation increases gradually without clear thresholds. Memory pressure builds unnoticed until failures surface.
Concurrency Ceiling Unknown
Thread and worker limits behave differently under real traffic. Throughput plateaus without clear indicators of saturation.
Slow Failure Attribution
When latency spikes, isolating the responsible code path takes too long during active incidents.
Scale Breaks Simplicity
Architectures that worked at low traffic fail unpredictably as usage grows, exposing hidden assumptions.
Clear Performance Visibility for
Sinatra Applications
Real-time observability for Sinatra workloads that helps teams understand request behavior, optimize performance, and resolve production issues faster.
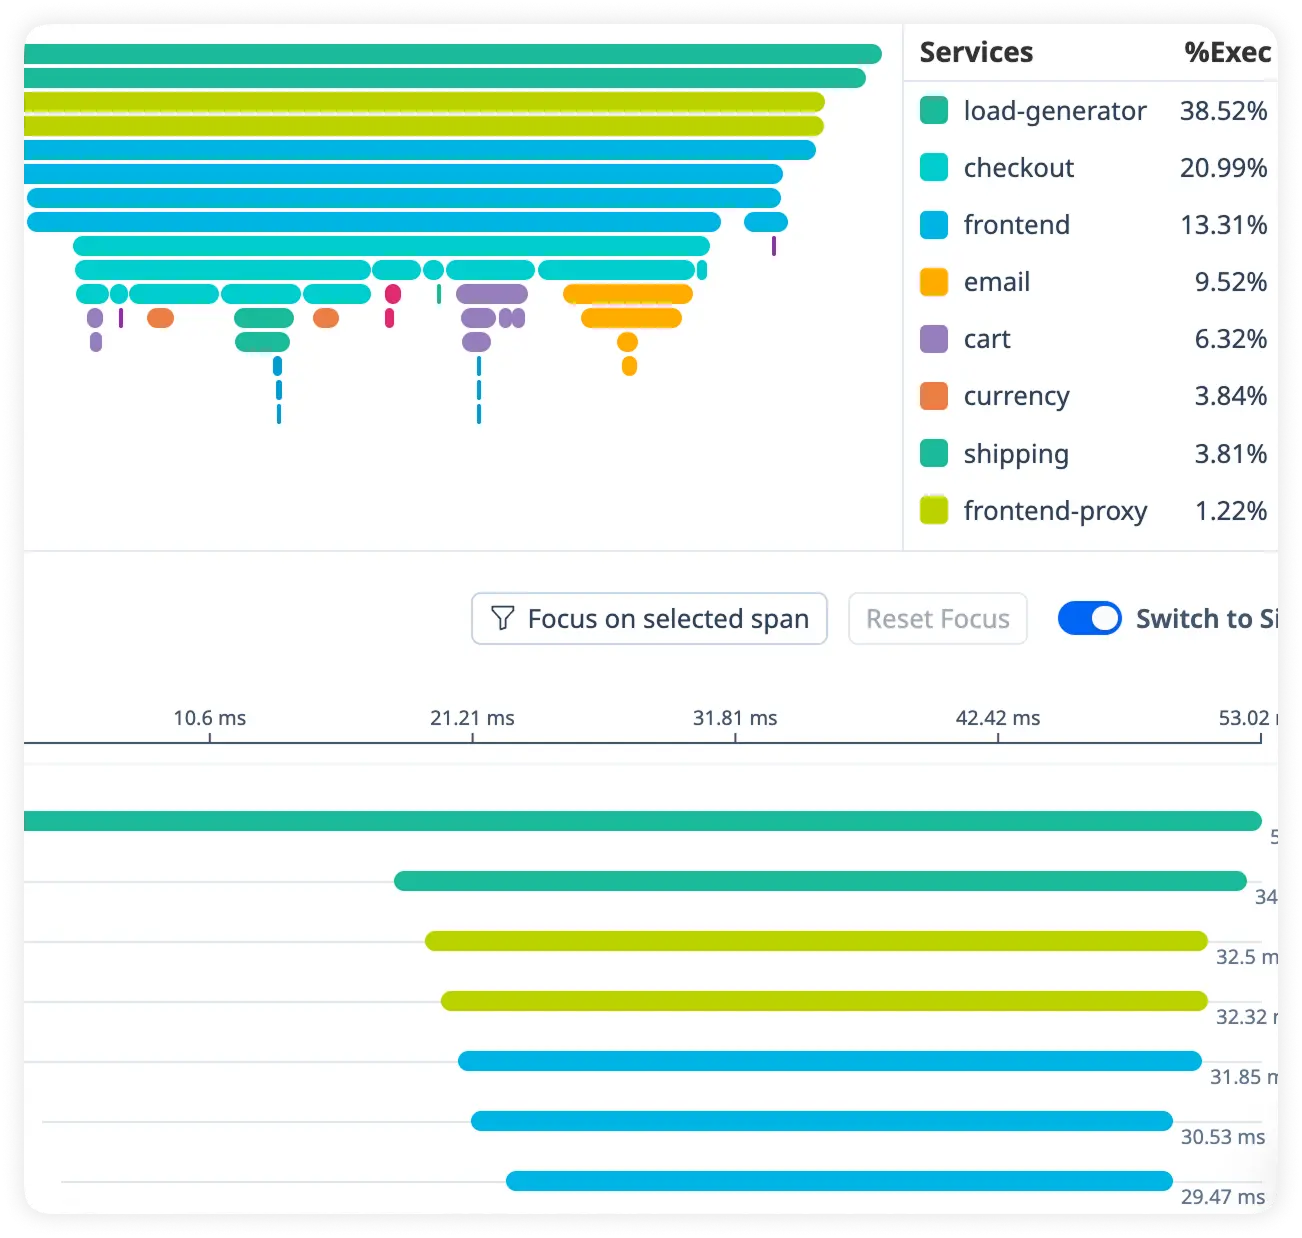
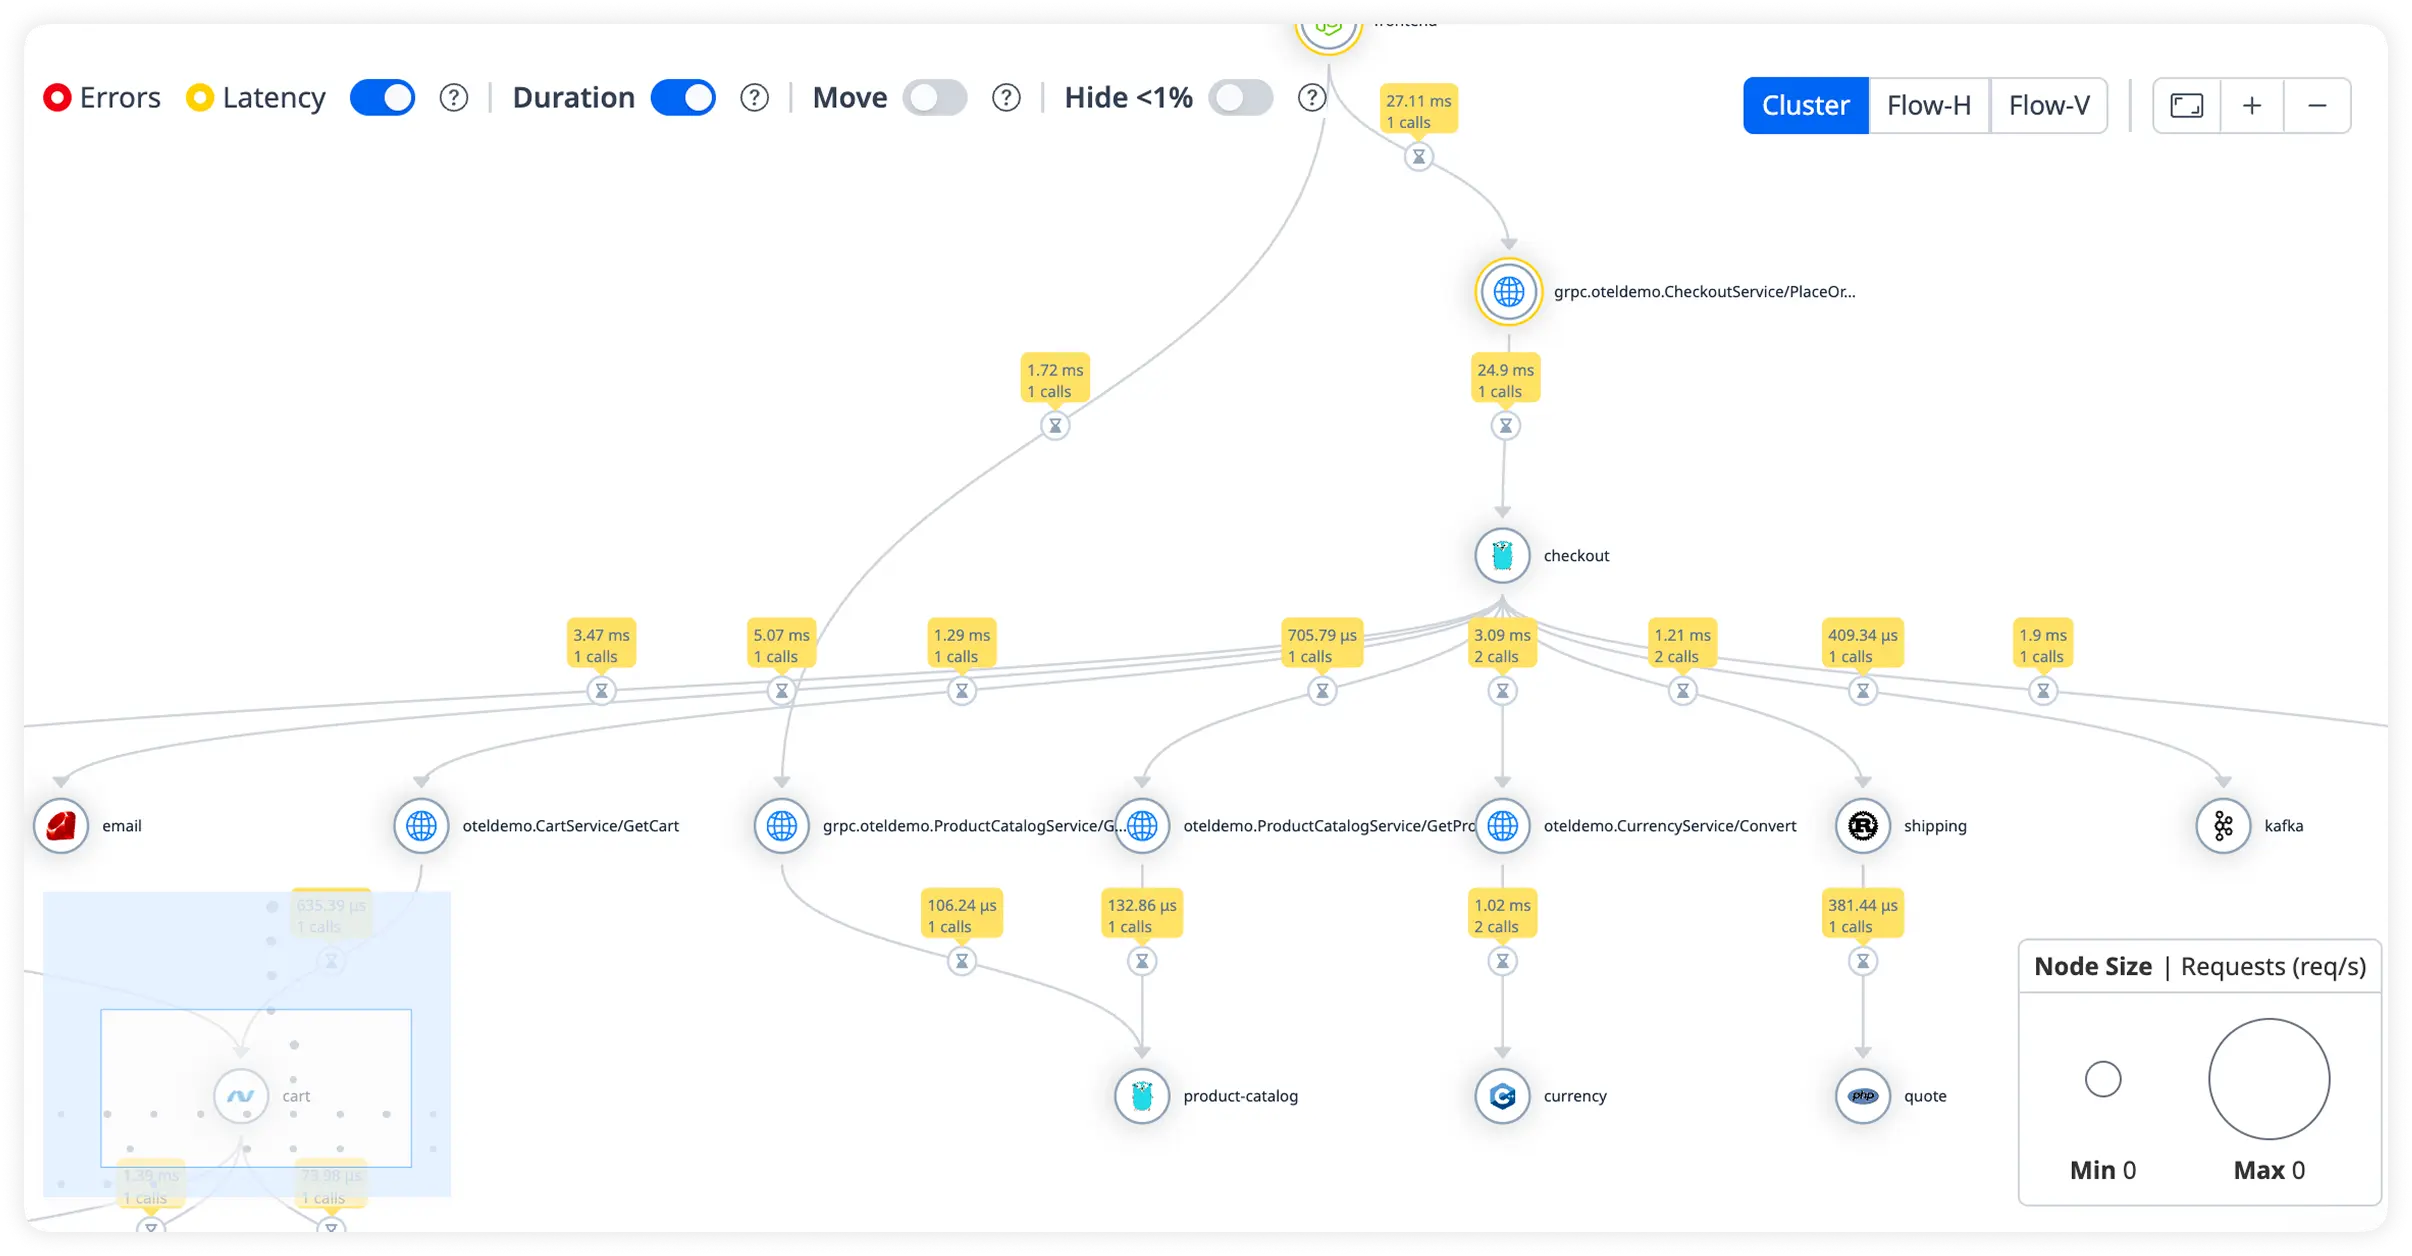
Detailed Request Duration Breakdown
Measure how long each request takes from entry to response. Quickly identify slow execution paths affecting application responsiveness.
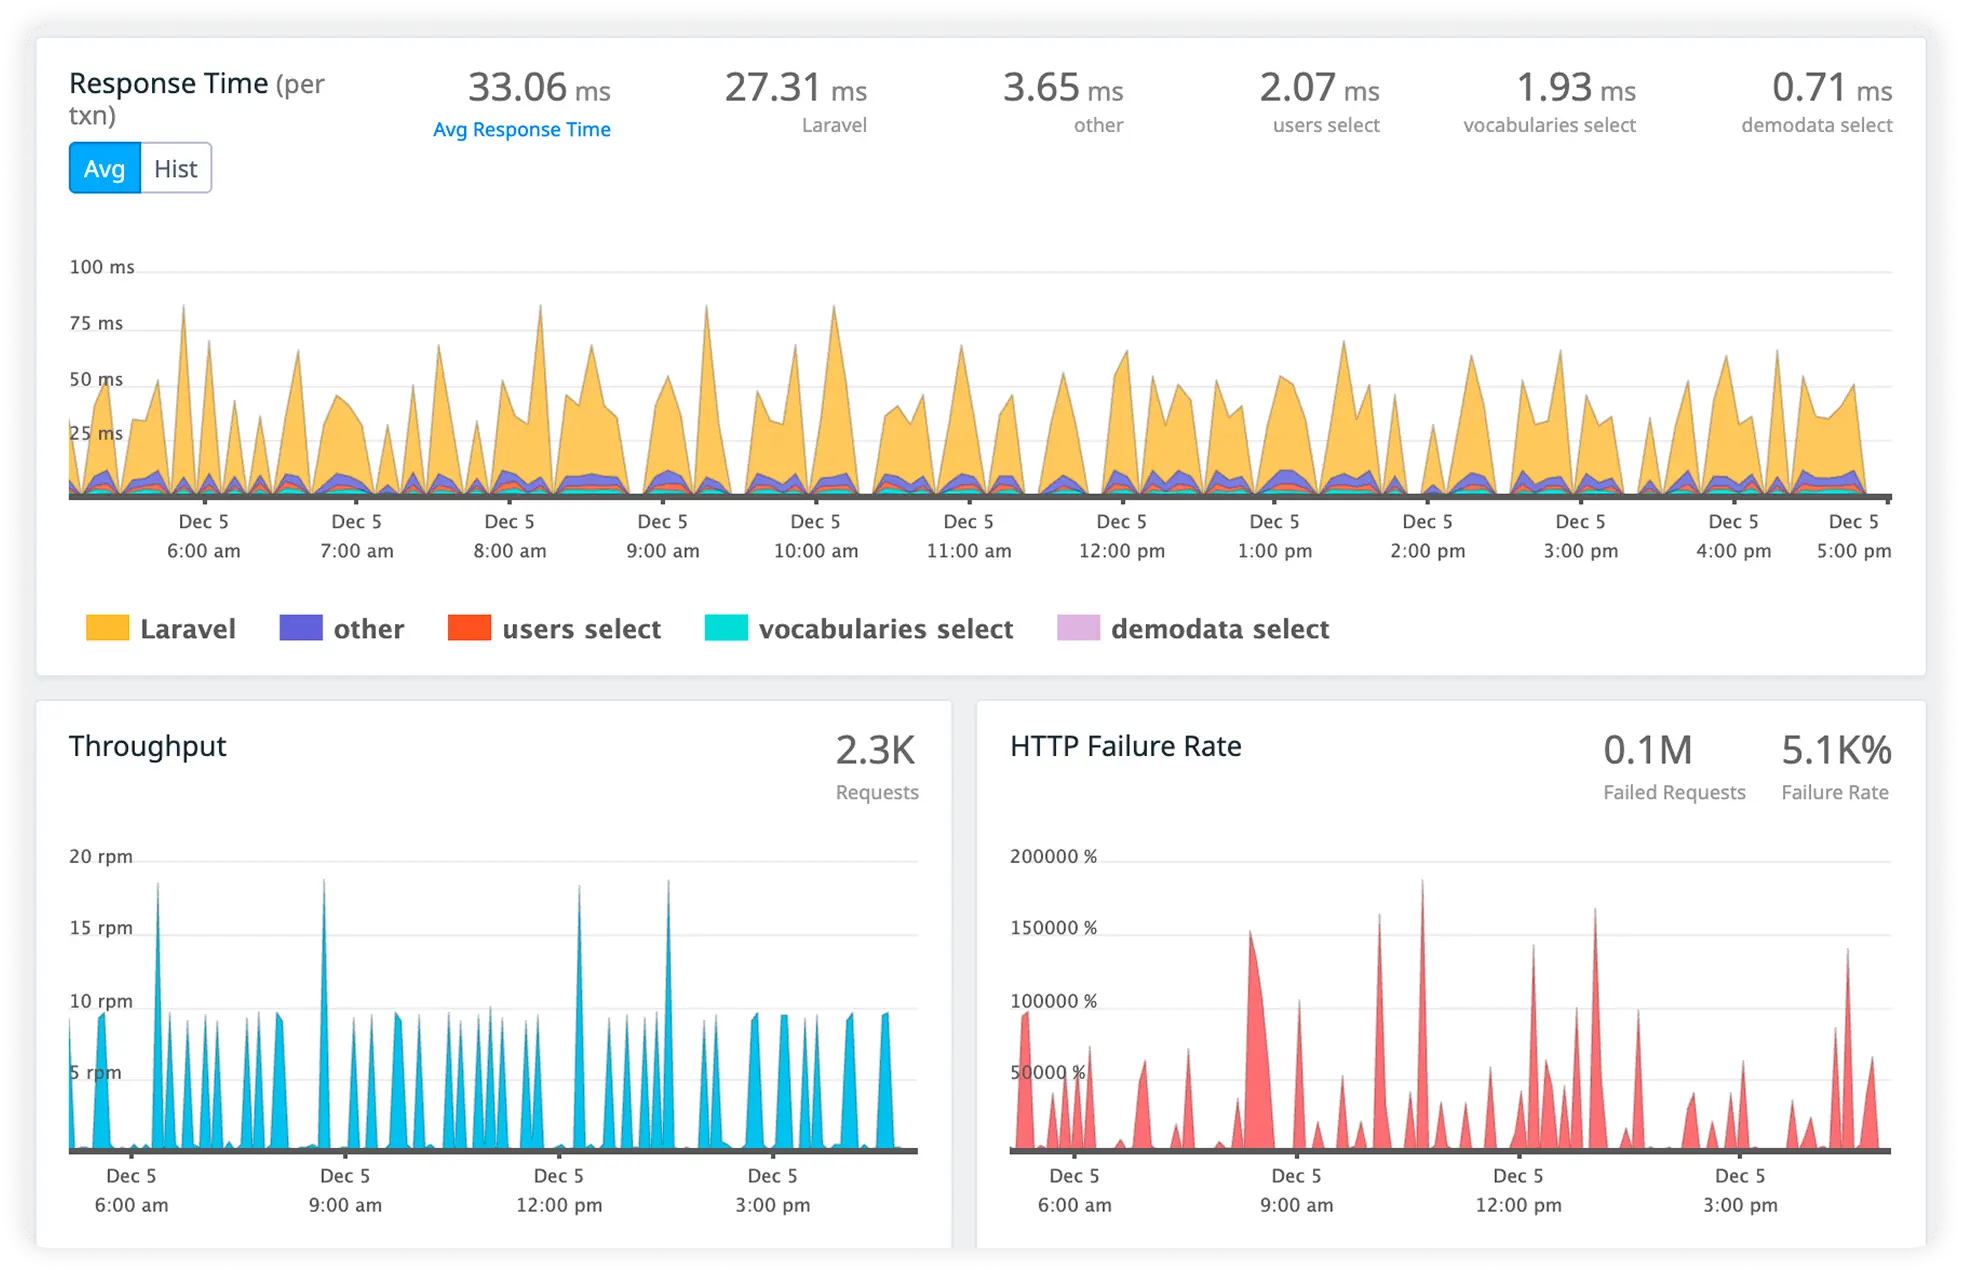
Track Route Execution Timing
Analyze how individual routes contribute to overall request latency. Pinpoint slow handlers impacting user experience.
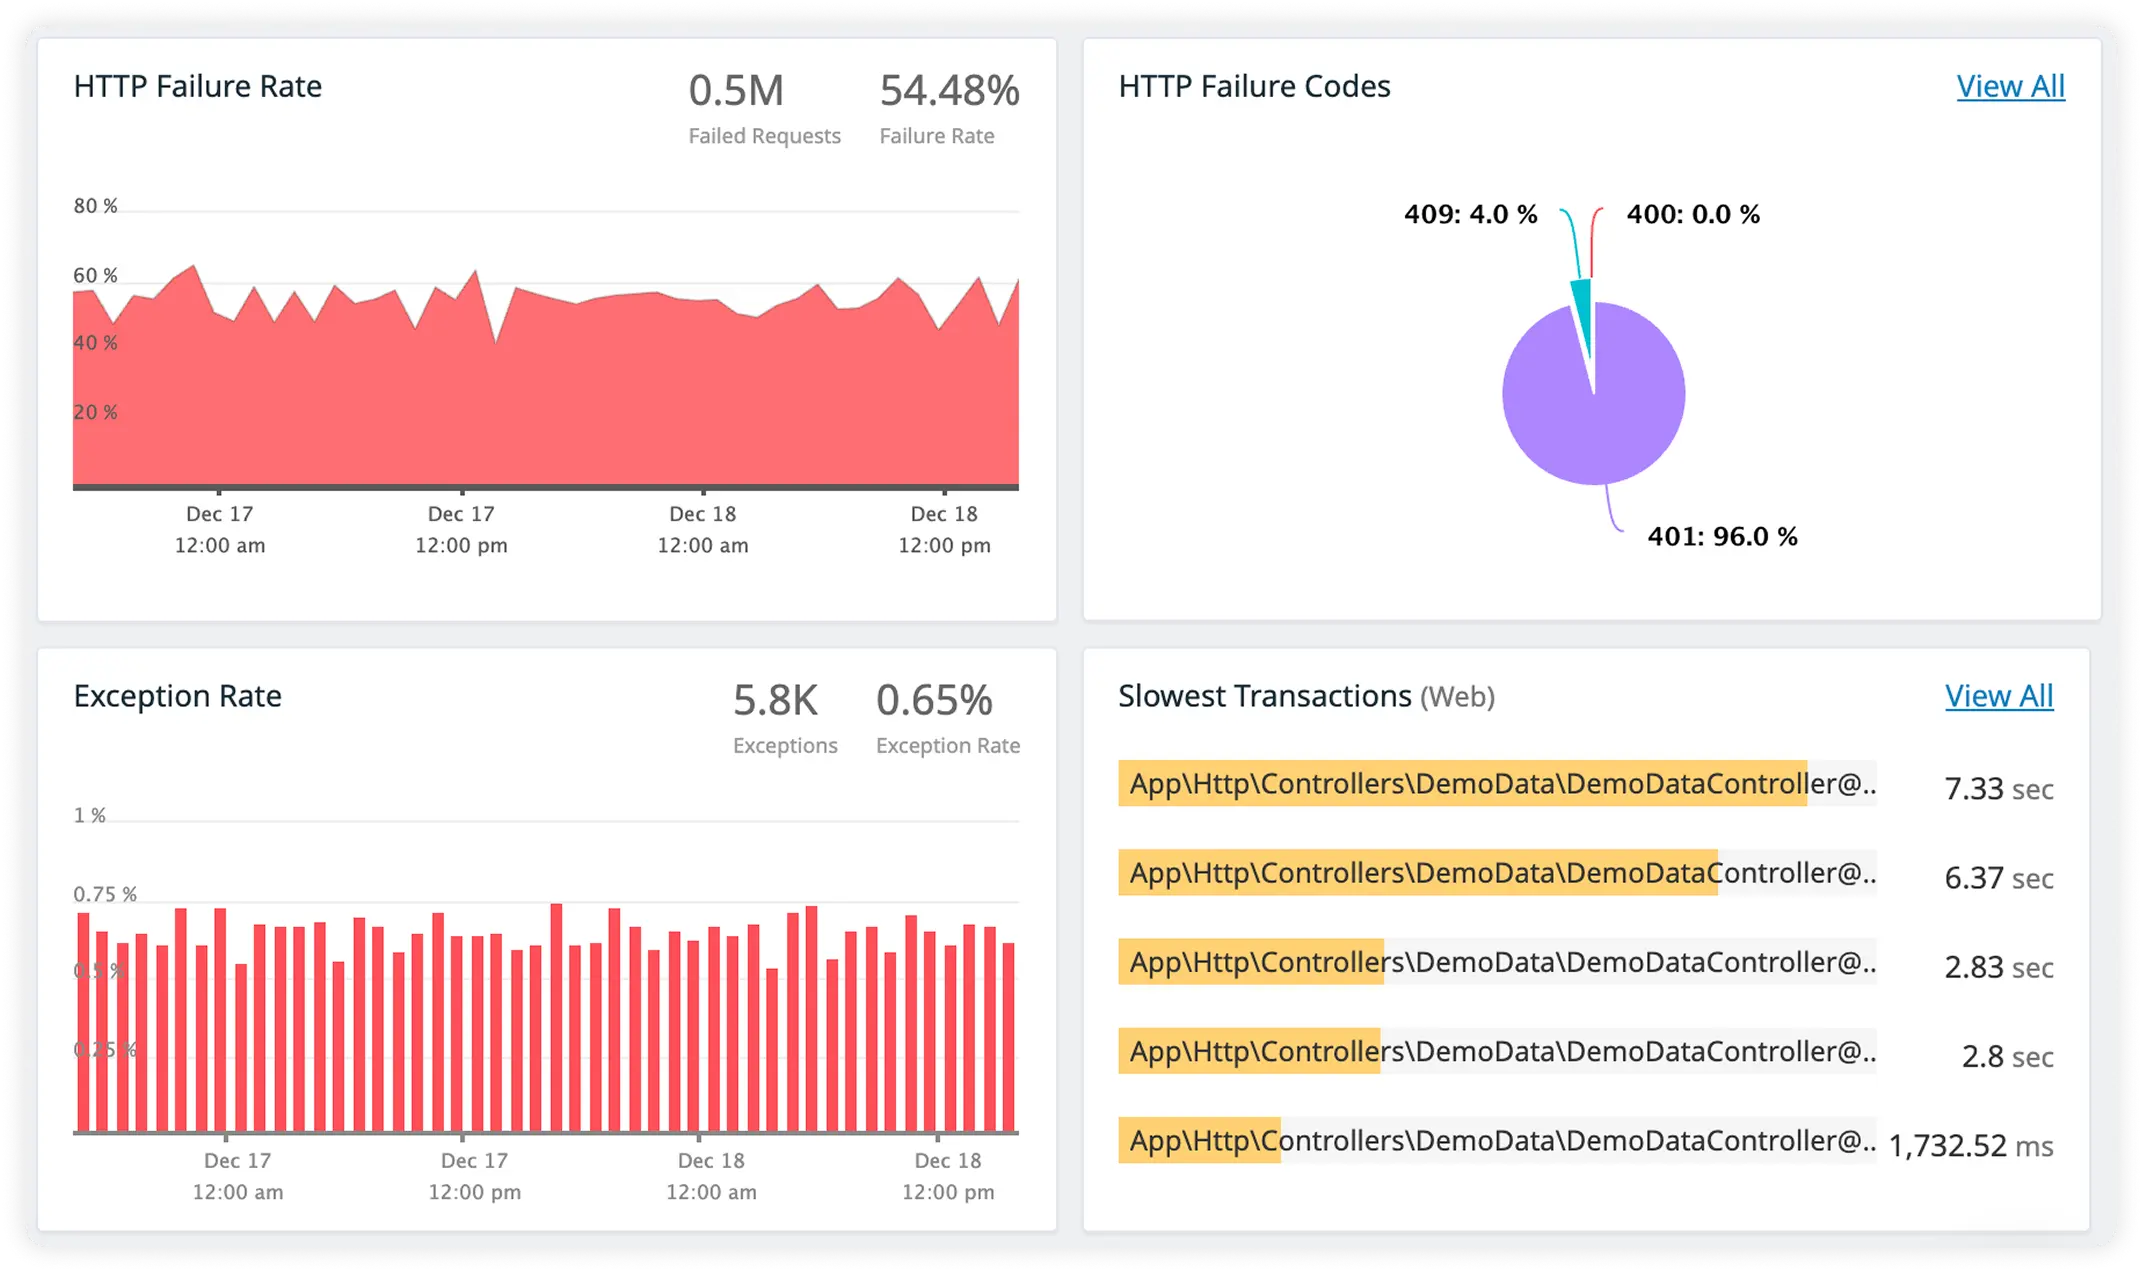
Identify Slow Database Query Timing
Monitor query execution times and database performance in real time. Eliminate inefficient database interactions slowing your application.
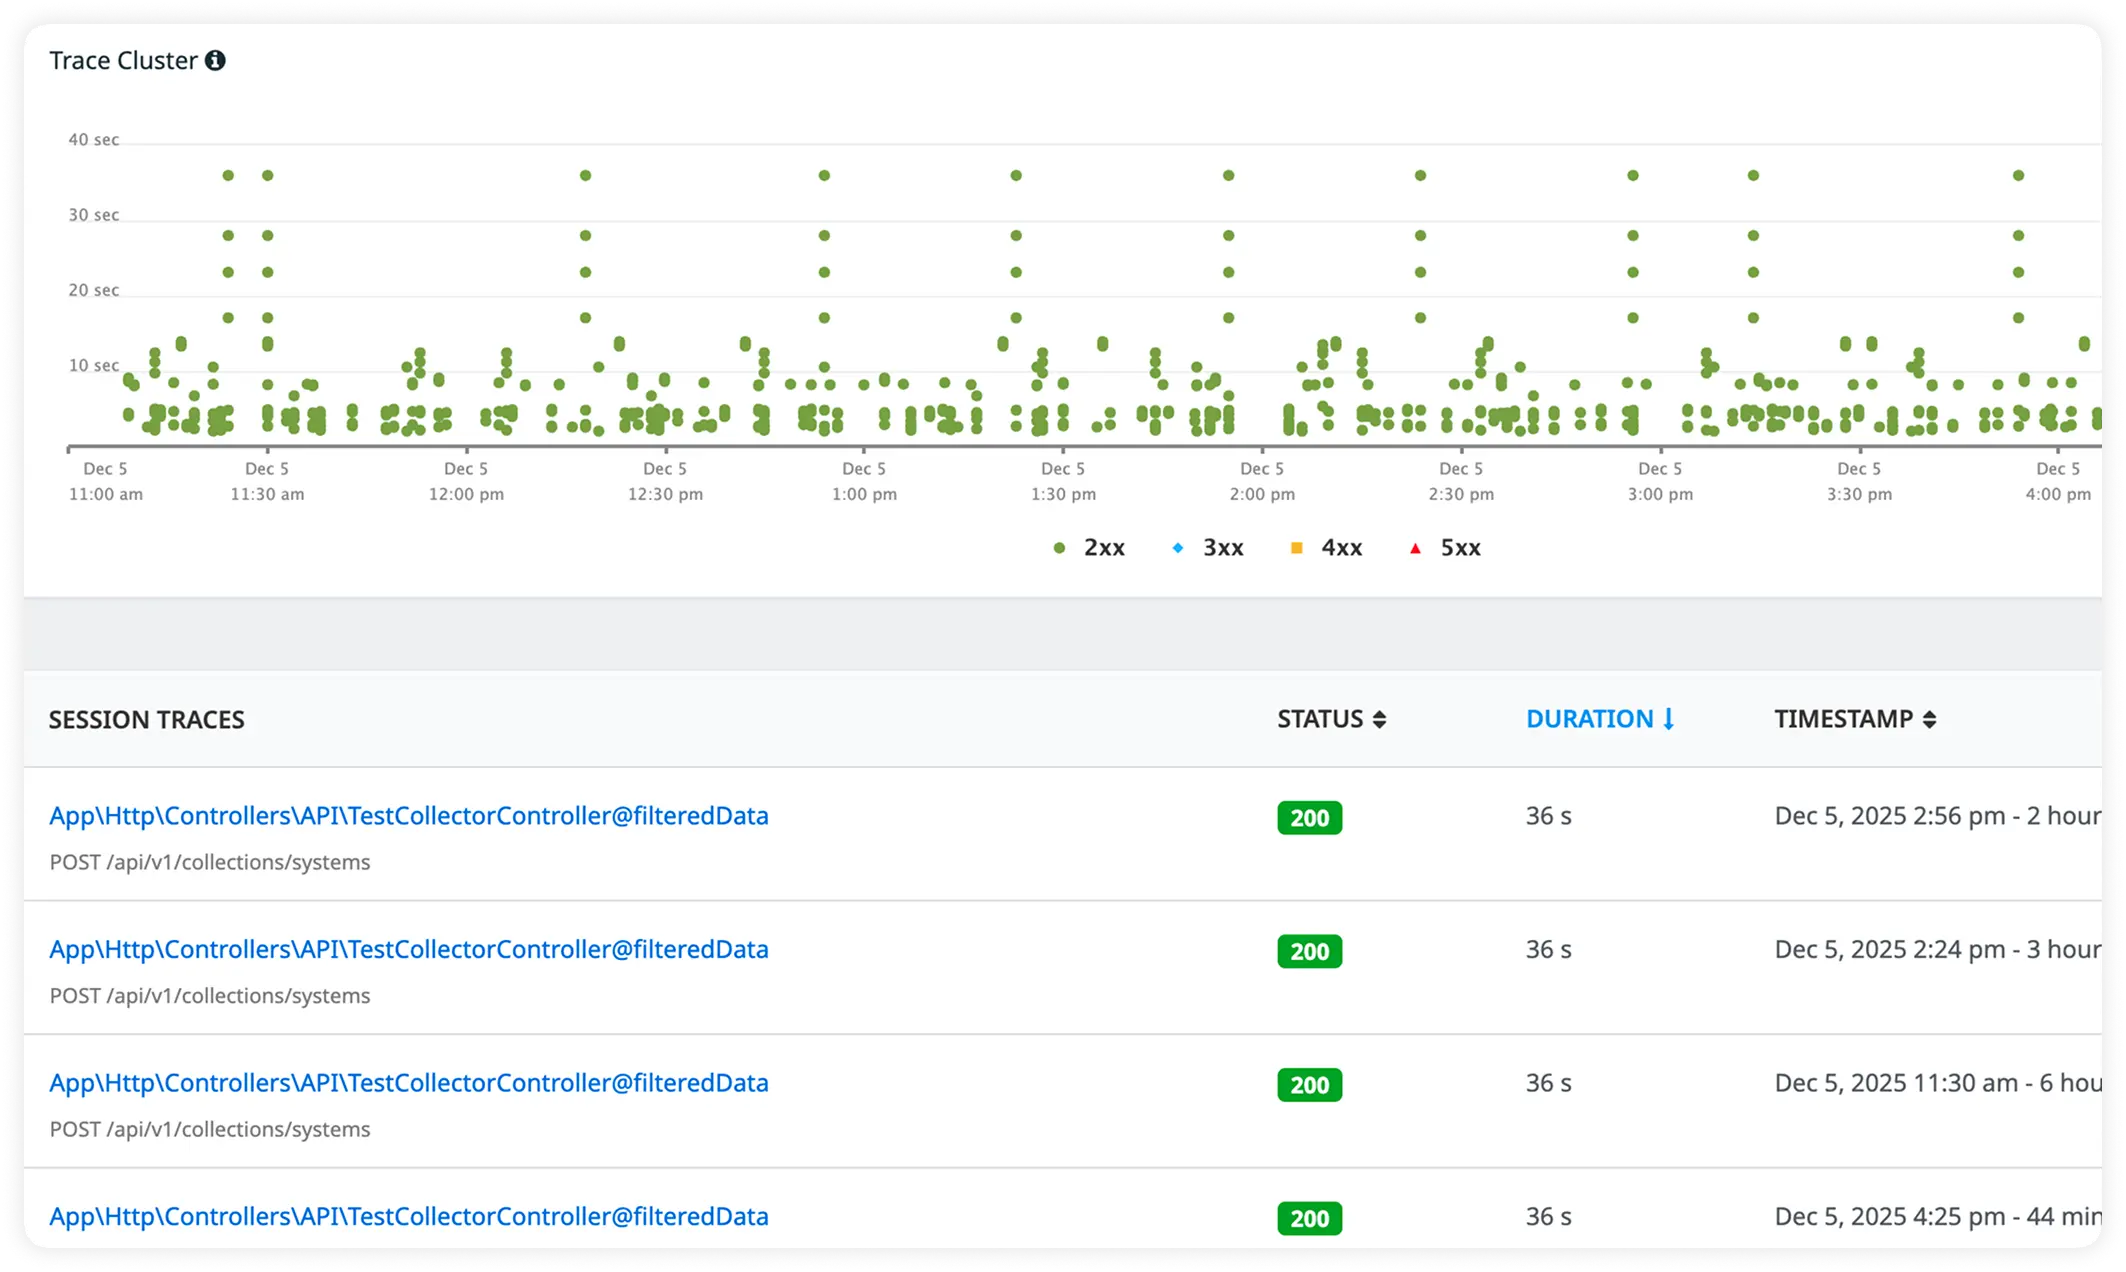
External Service Timing with Cache Impact Metrics
Track response times for third-party services while measuring cache performance influence. Understand how dependencies and caching layers affect overall request speed.
Why Teams Choose Atatus?
Teams choose Atatus when Sinatra applications evolve beyond simplicity. It provides production clarity without fighting the framework’s minimal design.
Clear Execution Grounding
Engineers see how requests actually move through the runtime, from entry point to response, reducing ambiguity during performance analysis.
Fast Production Adoption
Teams reach actionable understanding early, without prolonged setup phases or deep operational tuning.
Developer Trusted Signals
The runtime data aligns with code behavior, allowing engineers to debug confidently without second-guessing instrumentation accuracy.
Safe Runtime Presence
Atatus operates alongside live Sinatra workloads without introducing blocking behavior or destabilizing request processing.
Incident Ready Evidence
During production issues, teams analyze execution-level evidence rather than relying on inferred symptoms or logs alone.
Scale Without Overhead
As concurrency and request volume grow, runtime understanding remains consistent instead of degrading under load.
Low Operational Weight
Platform and SRE teams avoid managing heavy monitoring stacks for services designed to stay minimal.
Shared Runtime Understanding
Backend, SRE, and platform teams work from the same execution reality, reducing friction during incidents.
Confident Dependency Trust
Teams validate the runtime impact of code and configuration changes with clarity, lowering deployment risk.
Unified Observability for Every Engineering Team
Atatus adapts to how engineering teams work across development, operations, and reliability.
Developers
Trace requests, debug errors, and identify performance issues at the code level with clear context.
DevOps
Track deployments, monitor infrastructure impact, and understand how releases affect application stability.
Release Engineer
Measure service health, latency, and error rates to maintain reliability and reduce production risk.