1. Home
  2. APM
  3. Rails
APM

Rails Performance Monitoring

Get end-to-end visibility into your Rails performance with application monitoring tools. Gain insightful metrics on performance bottlenecks with Ruby monitoring to optimize your application.

Rails Performance Monitoring
Challenges

Why rails Performance Breaks Quietly?

Hidden N+1 Queries

ActiveRecord chains spawn undetected query storms during peak traffic, bloating response times without console reproduction. Rails console shows clean queries, but production logs reveal 50+ SQL calls per request under concurrent load.

Silent Background Failures

Sidekiq jobs hang in Redis backlogs, unobserved until user complaints surface days later. Failed retries exhaust queues silently, dropping throughput 30% without dashboard alerts or job duration histograms.

Untraced External Calls

Third-party API latencies cascade through controllers, masking true bottlenecks in request waterfalls. Stripe/PayPal timeouts add 2s per checkout without span breakdowns, forcing manual log grep across services.

Memory Leak Escalation

Heap fragmentation from unoptimized gems accumulates silently, crashing Puma workers unpredictably. ImageMagick or Nokogiri allocations grow 500MB/hour under photo uploads, undetectable without heap dump analysis.

Database Lock Contention

Concurrent transactions deadlock under scale, freezing writes with no query-level diagnostics. PostgreSQL row locks from nested transactions halt 100 RPS writes; SHOW locks reveals nothing without trace context.

Garbage Collection Pauses

Ruby GC cycles spike during high alloc, stalling throughput without runtime profiling visibility. Major GC pauses hit 1.2s during JSON serialization peaks, dropping 80% requests from sub-200ms SLA.

Clustering Sync Delays

Infinispan cache invalidations lag in clustered setups, causing stale data reads without replication latency traces.

Cache Invalidation Chaos

Stale Redis entries trigger thundering herds, overwhelming DBs without hit/miss ratio breakdowns. Key expiry floods Postgres with 10k SELECTs/sec after flash sale cache clear, no cache layer observability.
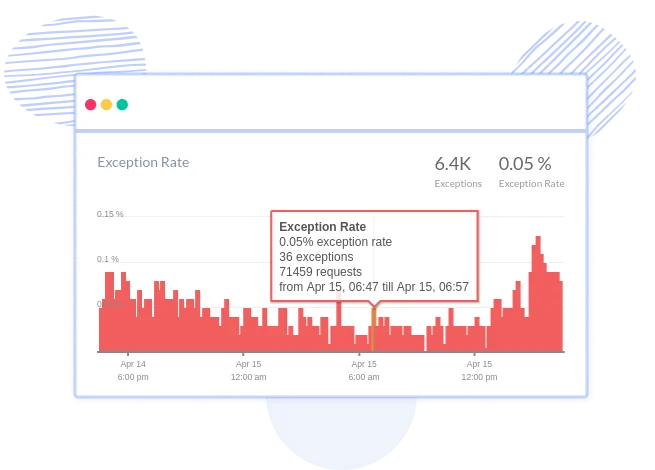
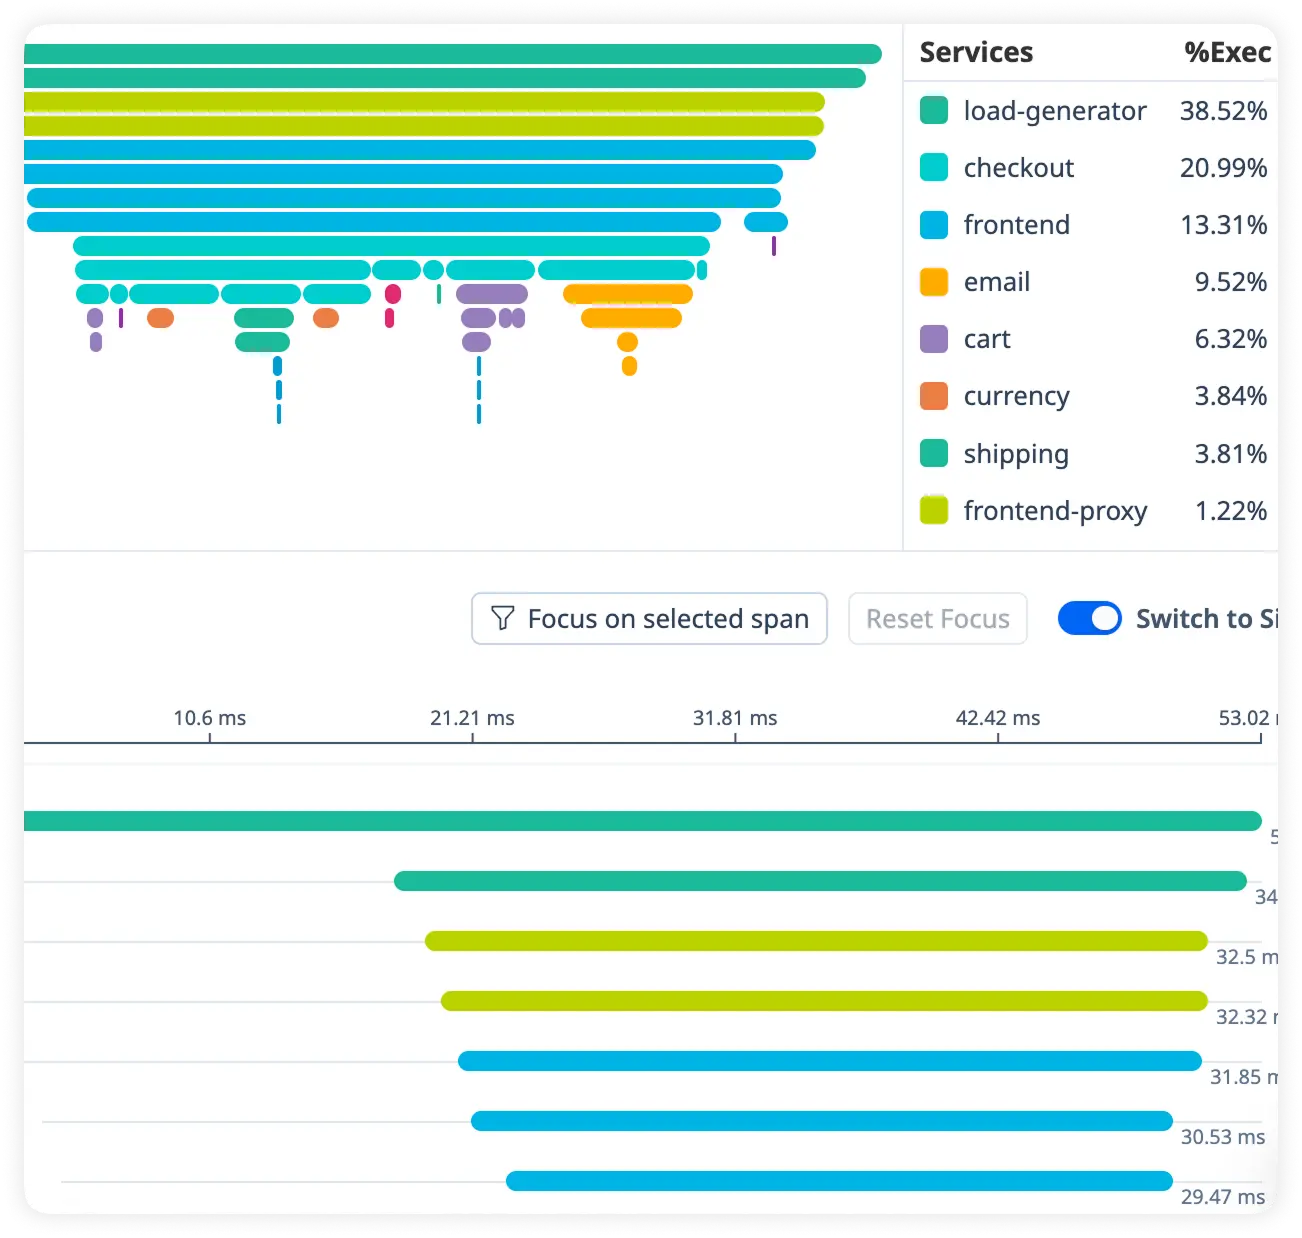
Key Features

Complete Performance Visibility for Rails Applications

Real-time observability for Rails workloads that helps teams understand request flow, optimize performance, and resolve production issues faster.

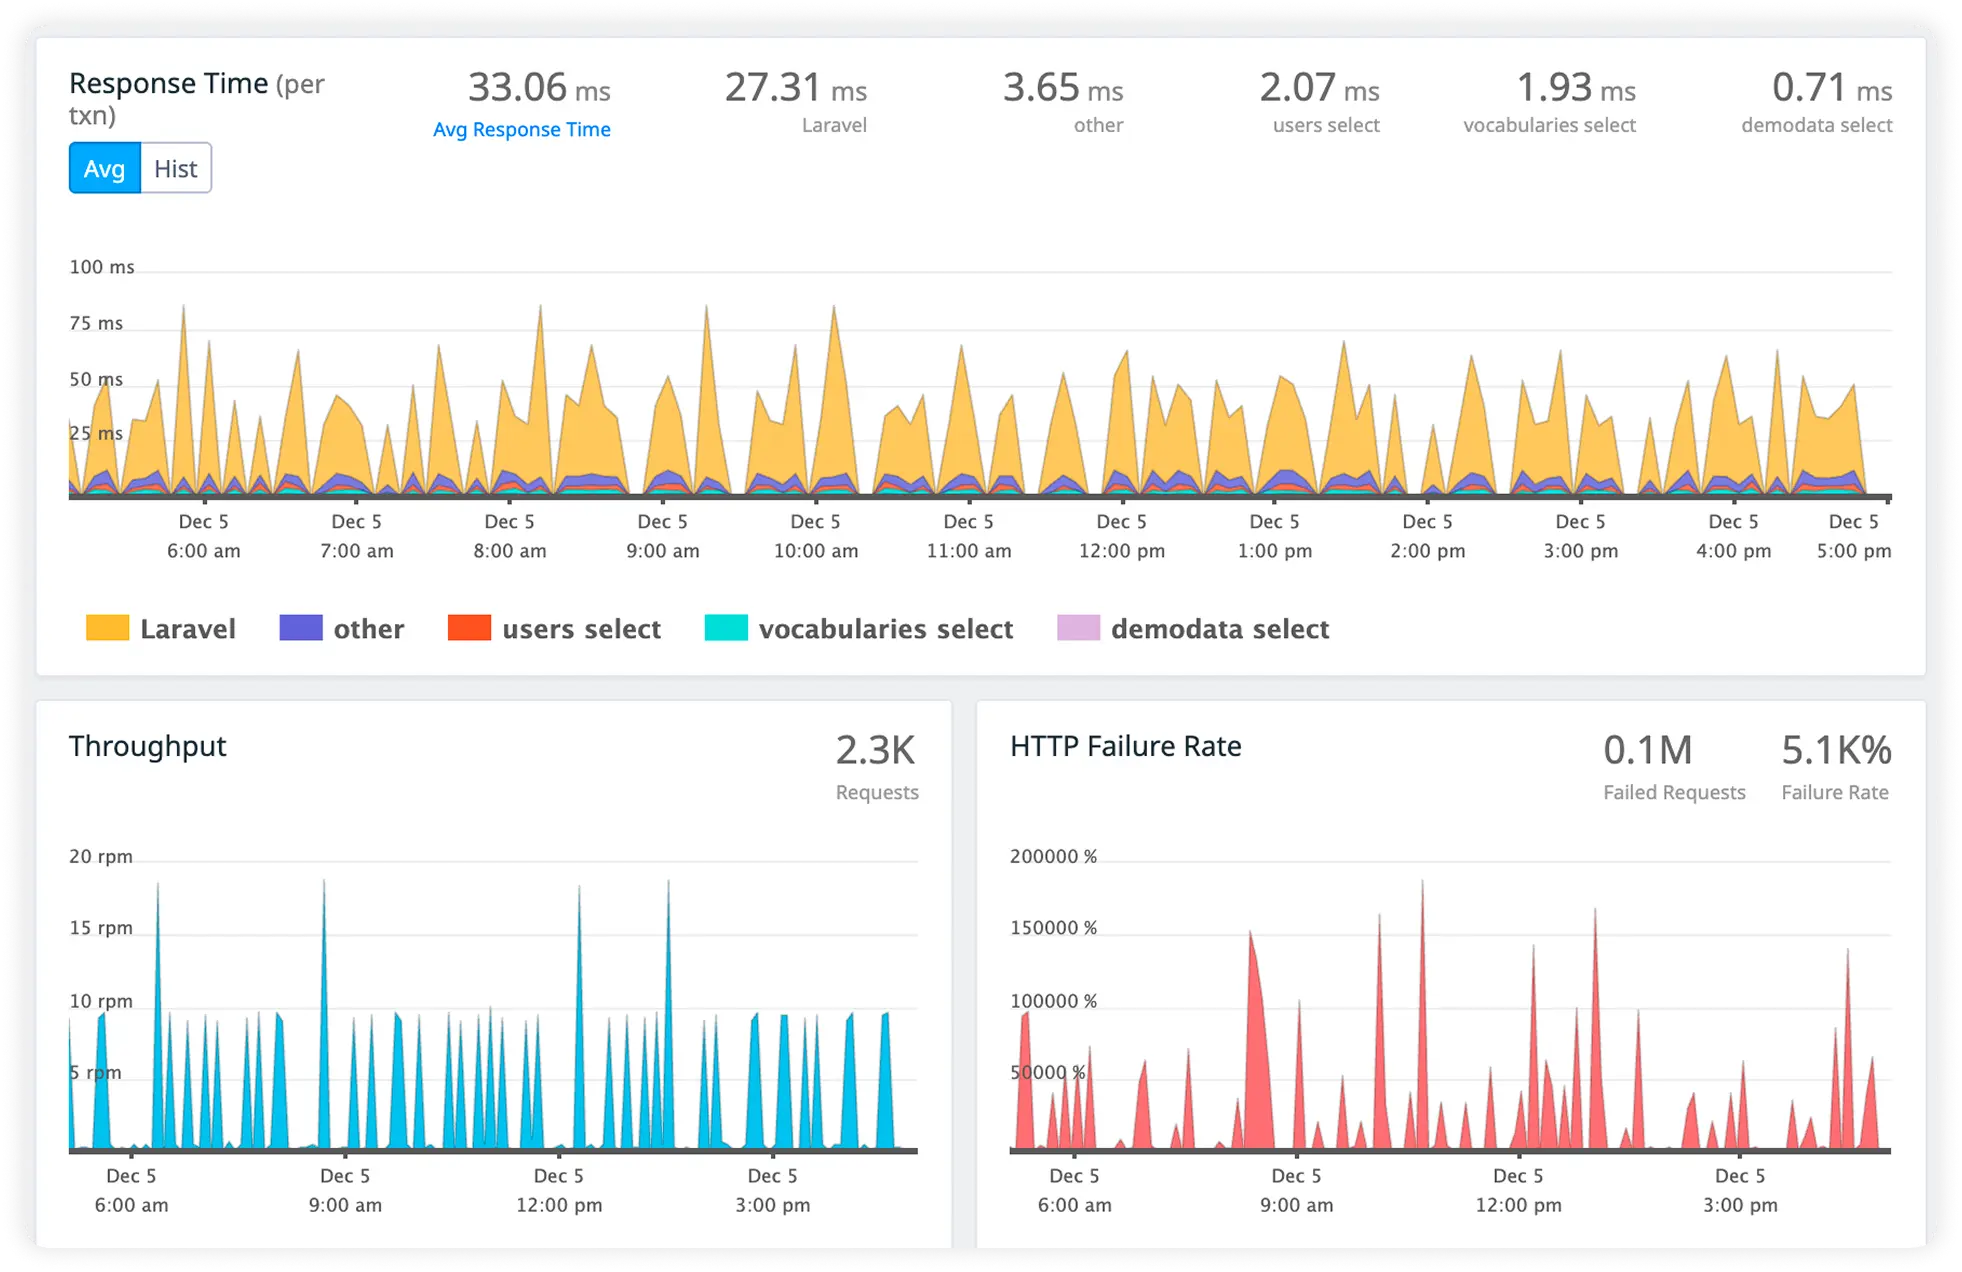
Detailed Request Duration Breakdown

Track how long each request takes across controllers, middleware, and background processes. Quickly uncover slow execution paths affecting response times.

Rails Request Duration Breakdown

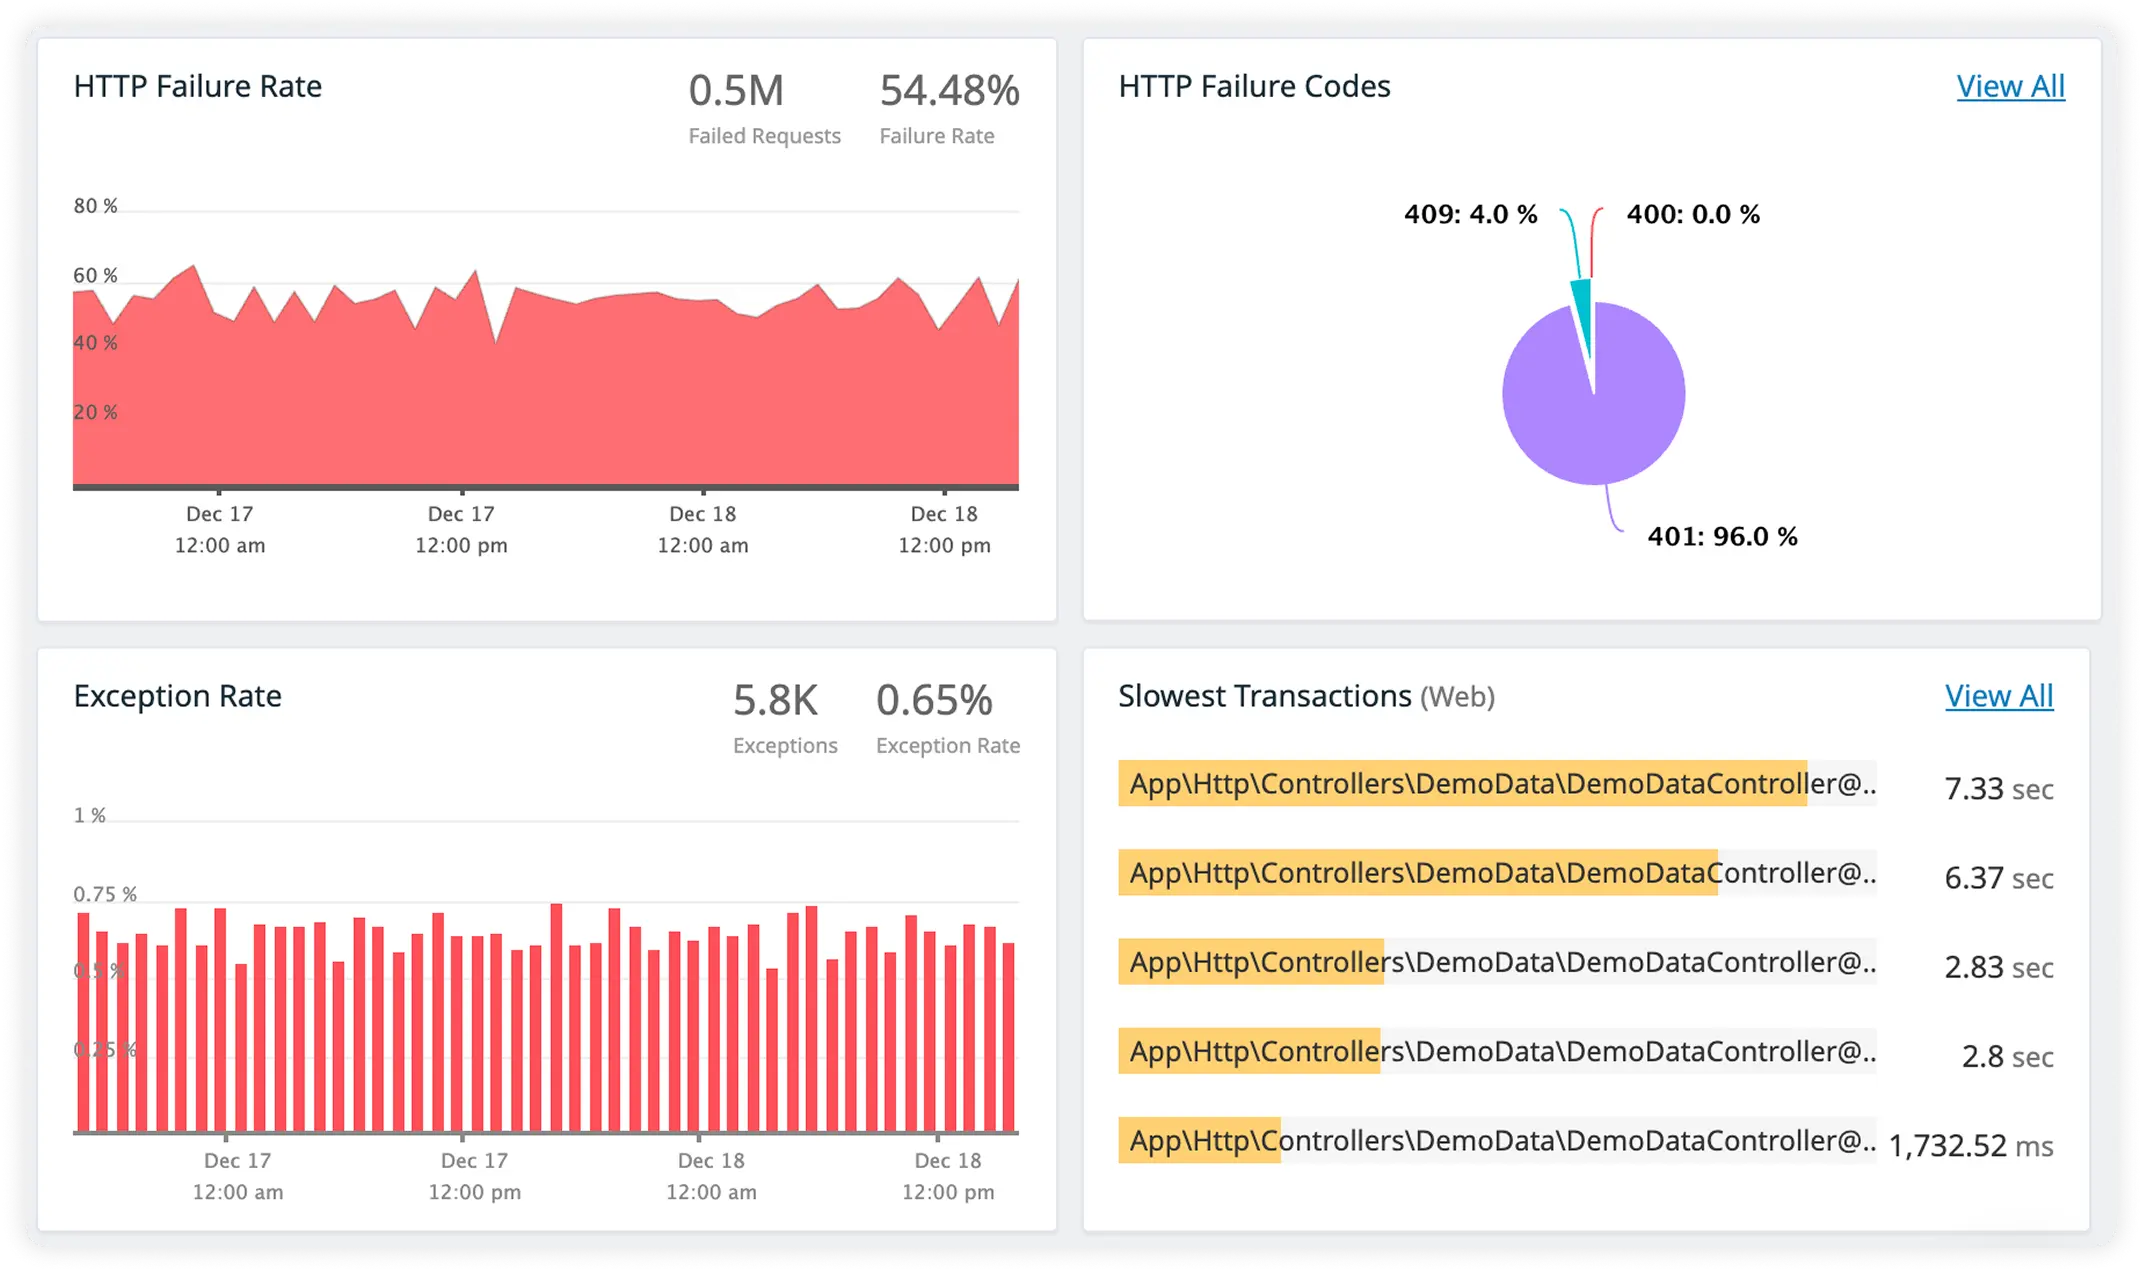
Identify Slow Database Query Timing

Monitor query execution time and database latency in real time. Eliminate inefficient queries slowing application performance.

Rails Database Query Monitoring

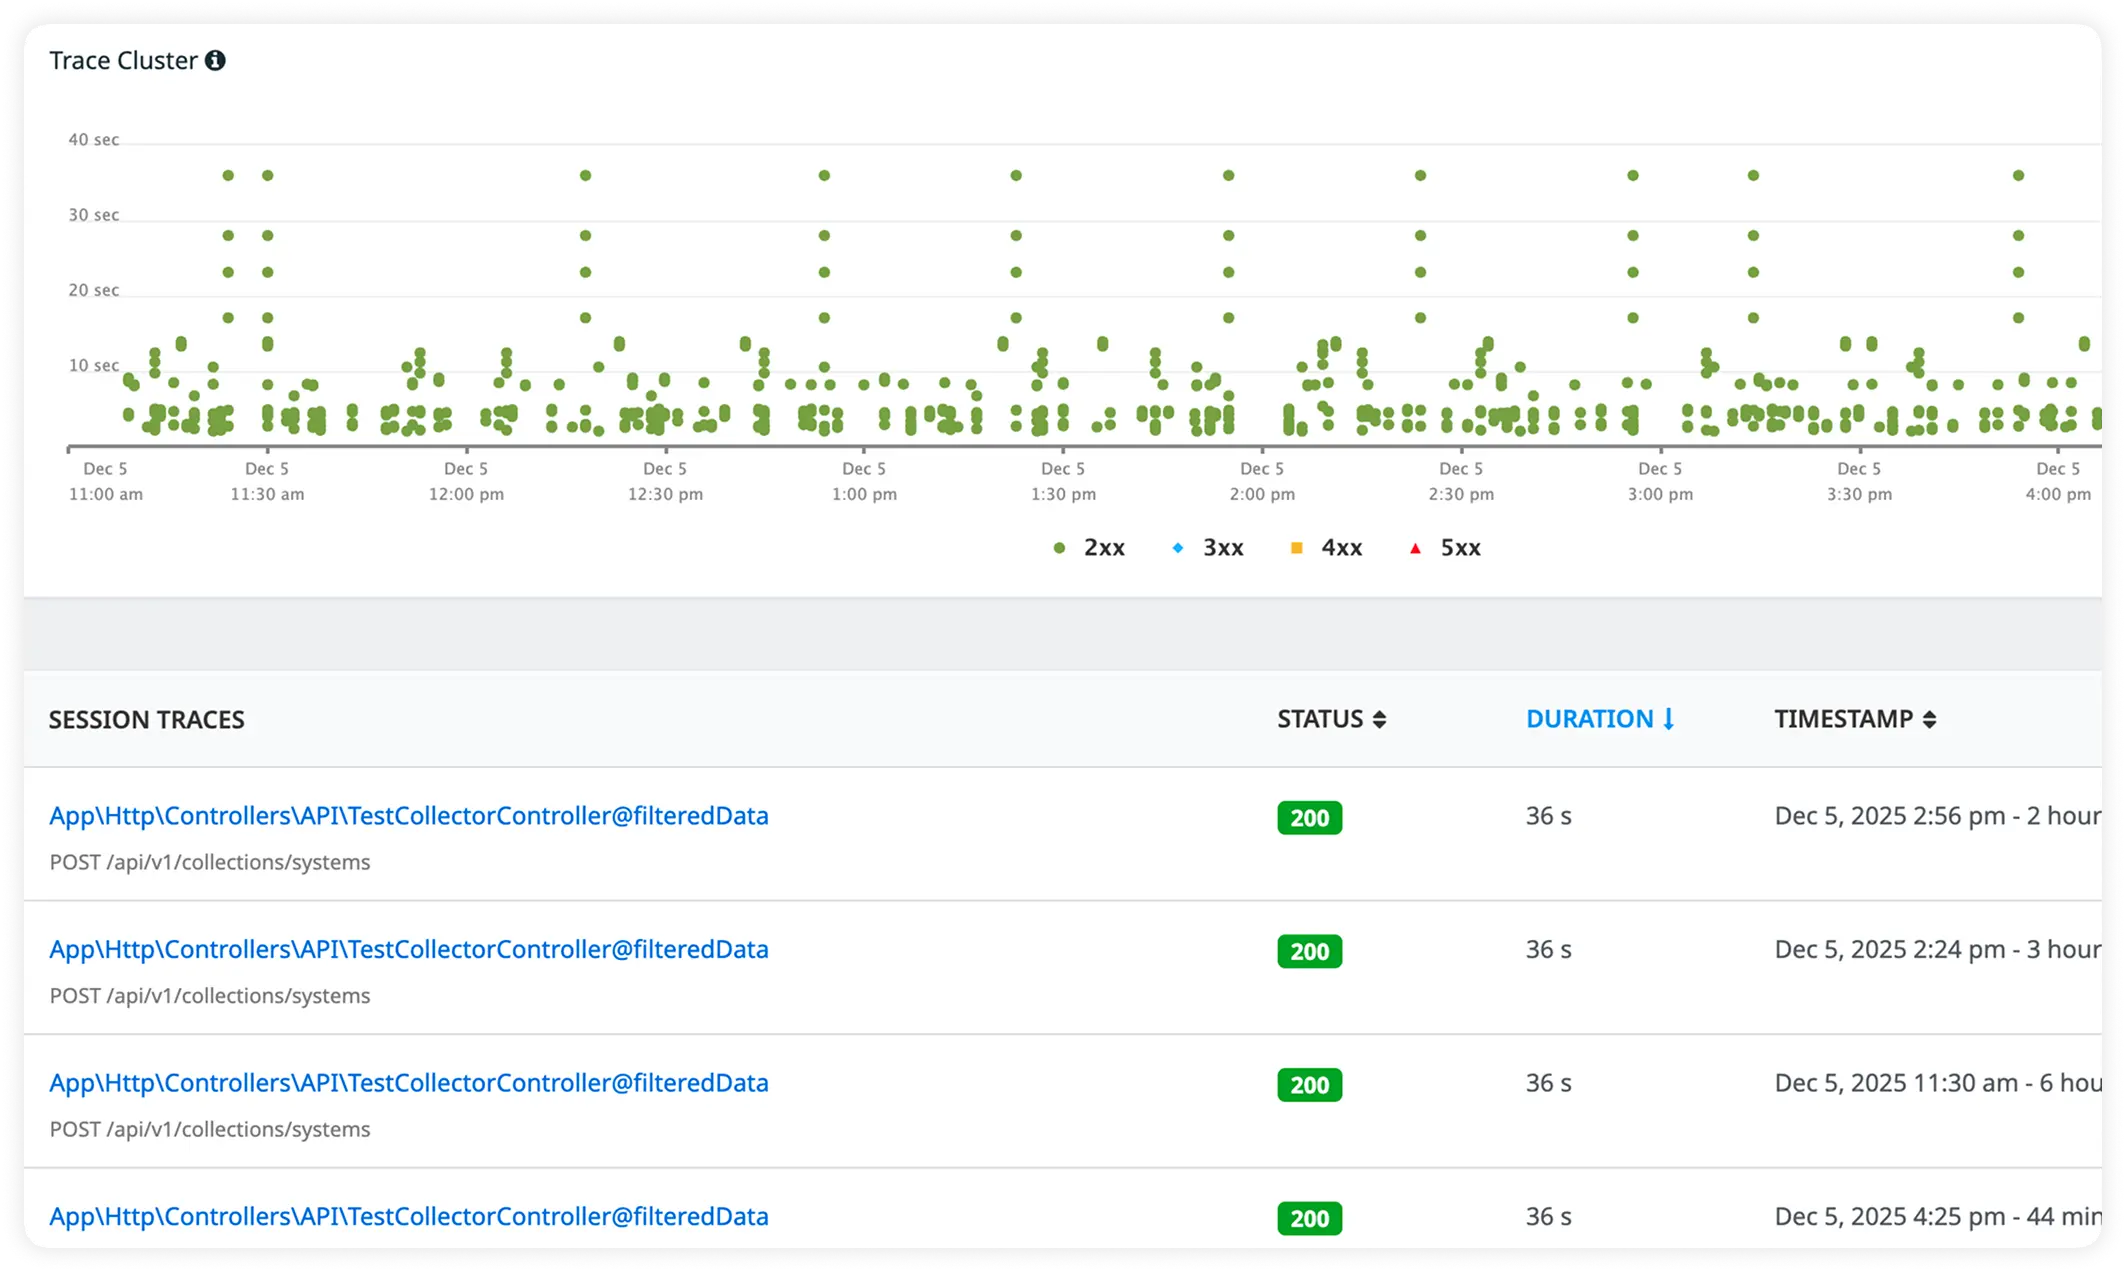
Understand Cache Impact Visibility

Measure how caching layers influence request speed and load reduction. Spot cache misses and performance gaps affecting application responsiveness.

Rails Cache Performance Visibility

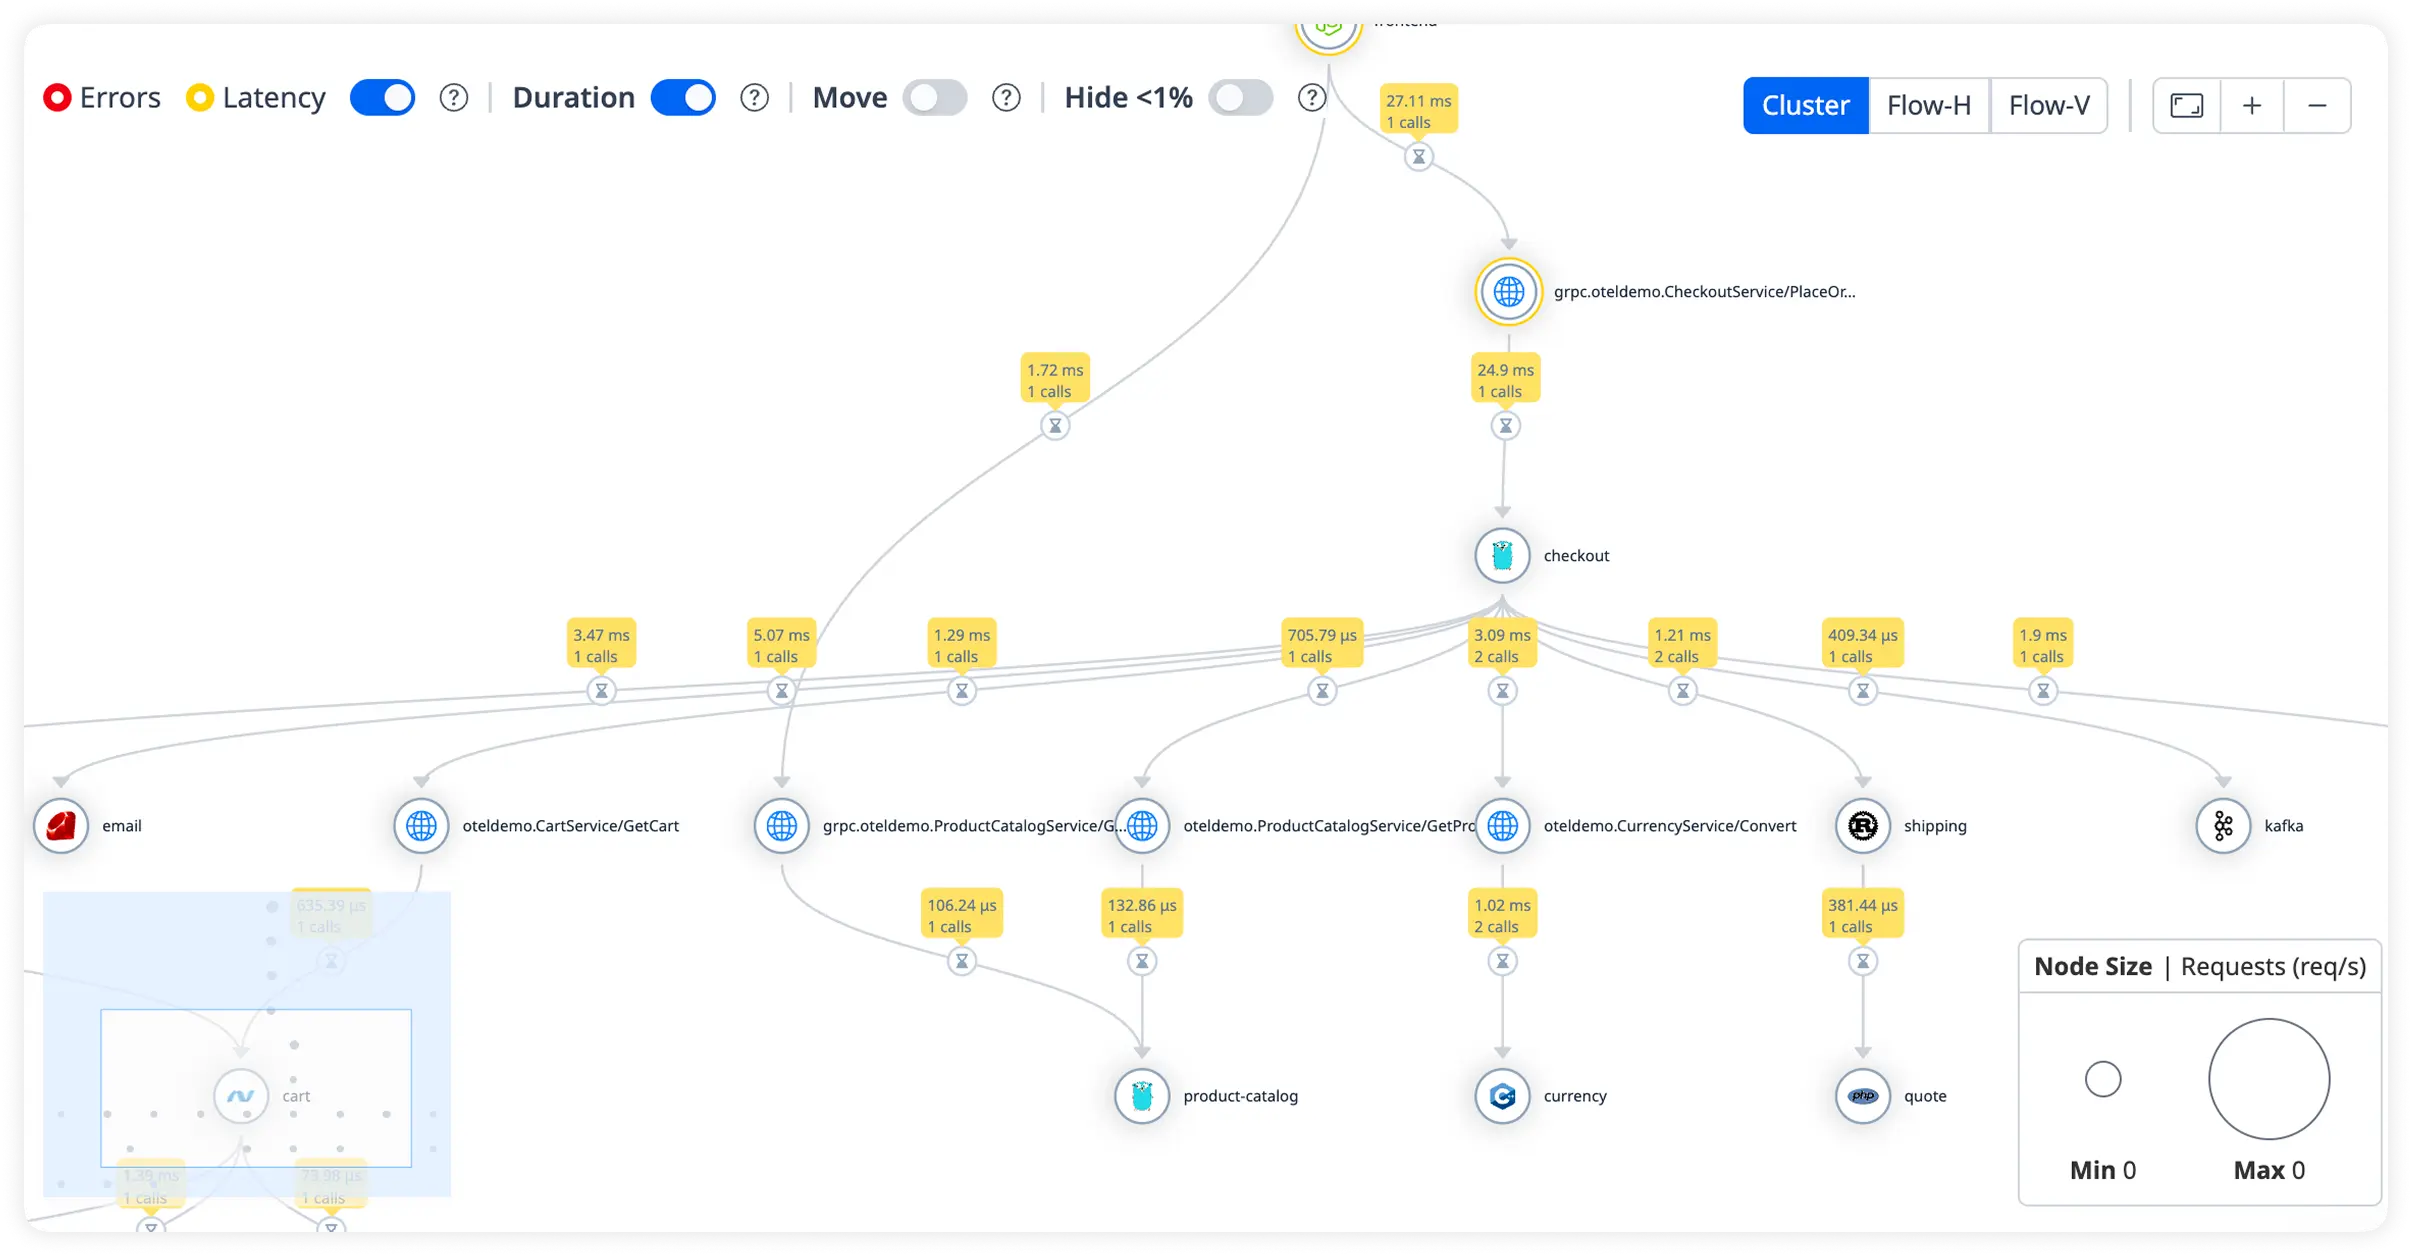
External Service Timing with Execution Flow Metrics

Track response times for third-party APIs while analyzing execution flow across your application. Understand how external dependencies and internal processing affect overall performance.

Rails External Service TimingRails External Service Timing
Why Atatus

Why Teams Choose Atatus for rails Observability?

Engineering leads select Atatus for precise trace correlation that cuts debugging from hours to minutes. Backend, SRE, and platform owners gain runtime fidelity matching staging confidence.

01

Trace-Level Clarity Emerges

Distributed spans link DB calls to HTTP endpoints, exposing latency sources in production flows.

02

Onboard in Minutes

Agentless integration hooks rails management APIs directly, yielding metrics streams without code rewrites.

03

Onboard in Minutes

Ruby gem installs yield instant metrics, skipping YAML config rituals and agent tuning.

04

Devs Retain Control

Raw trace data empowers code-level fixes without vendor lock-in or sampling distortions.

05

Alerts Prevent Escalation

Threshold breaches notify via PagerDuty, preempting outages before SLOs breach.

06

Scale Without Overhead

Low-byte agents handle 10k+ RPS, preserving CPU headroom across Heroku dynos.

07

Logs Correlate Seamlessly

Runtime traces align with Rails logs, surfacing exceptions in execution context.

08

Custom Metrics Fit Workflows

KPIs like job throughput integrate directly, driving data-backed capacity planning.

09

Confident Release Decisions

Teams validate runtime impact before and after changes, improving confidence in production releases.

Teams

Unified Observability for Every Engineering Team

Atatus adapts to how engineering teams work across development, operations, and reliability.

Supported frameworks

No Code Changes. Get Instant Insights for Ruby frameworks.

Frameworks

FAQ

Frequently Asked Questions

Pricing, deployment, data and the agent. If something is missing, a person will answer it on a demo call.

Talk to an engineer
  • The Rails performance monitoring tool helps developers to optimize the Rails server performance.

    A good Rails APM solution answers the following two questions:

    • Is an application broken or slow?
    • What is issue that's causing the application broken or slow?

    You can easily use application performance monitoring tools to answer, detect and resolve the above issues before they could impact the end users.

  • In general, there are two types of monitoring:

    • Black-box monitoring - It allows you can monitor the external behaviour of your system such as CPU usage, disk usage, memory usage, load averages etc..
    • White-box monitoring - It allows you to keep an eye on the applications running on your server. It requires an agent to enable white-box monitoring.
  • Every organization should have a well-implemented Rails APM solution, which allows DevOps teams (and the organization as a whole) to resolve issues and performance bottlenecks efficiently and reduce Mean Time To Resolution (MTTR). This has a substantial impact on the bottom line of the business.

    Now organizations do not have to deal with the unnecessary work involved in maintaining an extensive software analysis group.

  • Your Rails performance monitoring tools should be easy to use, offer actionable insights, and be able to:

    • Manage applications in the language(s) your apps use
    • Track performance at the code level
    • Keep an eye on end-user experiences
    • Make use of artificial intelligence
    • The ability to monitor the entire infrastructure
    • Provides information that connects app performance metrics to business outcomes.
  • Technical Benefits:

    • Increase application uptime and reduces downtime
    • Code level diagnostics
    • Avoid network outages
    • Reduces MTTR
    • Server metrics
    • Alerts and notification on error information

    Business Benefits:

    • Higher conversion rate
    • Improves SEO
    • Better end-user experience
    • Improves productivity
    • Reduced operational costs
  • With the help of the database monitoring, you can easily identify the database performance bottlenecks.

    • Understand who's using your databases.
    • Track key performance metrics for DB performance tuning.
    • Detect the slow and most-time consuming SQL queries to optimize it.
    • Alerts on availability and performance issues.
Get started

See inside every Rails request.

Install the Atatus agent to trace every Rails request, database query and error.

  • SaaS
  • On-premises
  • Hybrid
  • BYOC
  • No per-user pricing

Compare Atatus with Datadog · New Relic