9 Best Practices for Application Logging that You Must Know
Have you ever glanced at your development logs and wondered why they don't make sense?

Perhaps you've misused your log levels, and now every log is labeled "Error." Alternatively, your API logs may fail to provide clear information about what went wrong, or they may divulge valuable data that hackers may exploit.
It is possible to resolve these issues!!!
We will cover the following:
What is Log?
A log is a file that records the communications between a system and its users, or a data-gathering tool that records the type, content, and time of transactions made by a person from a system terminal. A log is an electronic record of interactions that have occurred between a web search engine and people searching for information on that web search engine during a searching episode.
A logging system is included in many operating systems, software frameworks, and programs. Syslog, created by the Internet Engineering Task Force (IETF), is a widely used logging strategy. The Syslog standard allows for the generation, filtering, recording, and analysis of log messages via a specialized, standardized subsystem. This eliminates the need for software developers to create and construct their ad hoc logging solutions.
Importance of Logs
You can review your web server logs if there's a crash or an issue arises. Here are some reasons why you should keep logs:
- Your API logs show you a thorough path through your code that you may use to figure out what went wrong. When troubleshooting your program, this is quite useful.
- You can use production logs to keep track of the health of your website.
- They aid in the detection of errors that occur while your service is running.
- Anomalies or questionable conduct can be discovered in logs.
- You can use them to calculate stats for your website, such as the error rate.
9 Logging and Monitoring Best Practices
We've put up a list of some best practices for setting up DevOps logging in their applications.
- Know What to Log
- Know When to Use Each Log Level
- Use English Language and Friendly Log Messages
- Have a Consistent Structure Across All Logs
- Understand Metrics
- Make Each Log Message Unique
- Always Provide Context
- Reporting Alerts and Exception Handling
- Write Log Parsers and Proactively Monitor Logs
#1 Know What to Log
Messages (Both Incoming and Outgoing)
Both incoming and outgoing messages must be documented with API endpoint URLs, request parameters, request origin and intermediate IPs, request headers, author info, request and response bodies, business context, timestamps, and internal processing steps when components communicate via message passing.
Service and Function Invocations
When a service or function is called, it's a good idea to report the context of the call at a lower log level, primarily for debugging. Having these logs on hand makes it much easier to explore issues with business logic, especially when we don't have the ability to connect a debugger to your program.
User Interactions and Business Stats
Every program has its own set of business cases and user journeys, which provide a wealth of information for the system's domain specialists. Other business-related data, such as transaction volumes and active users and their stages, is useful in gaining business insights and can even be used for business intelligence.
Data Operations
In most enterprise applications, keeping a separate log statement for data-related operations with all important information like access IDs, exact service instances and role privileges used, timestamps, data layer queries, and snapshots of both previous and new states of the changed dataset is required for design logging security and compliance reasons. All data-related attempts and CRUD operations made by users, as well as by other systems and services, must be recorded in audit logs.
System Events
Behavior events, changeover modes, inter-service communication, service instance IDs, actively serving APIs, actively listening IP and port ranges, configurations loaded, overall service health, and everything else that aids in understanding the system's behavior must all be captured in system events.
#2 Know When to Use Each Log Level
The severity of each event log in the system is indicated by the log level. The following levels are accessible in most logging frameworks.
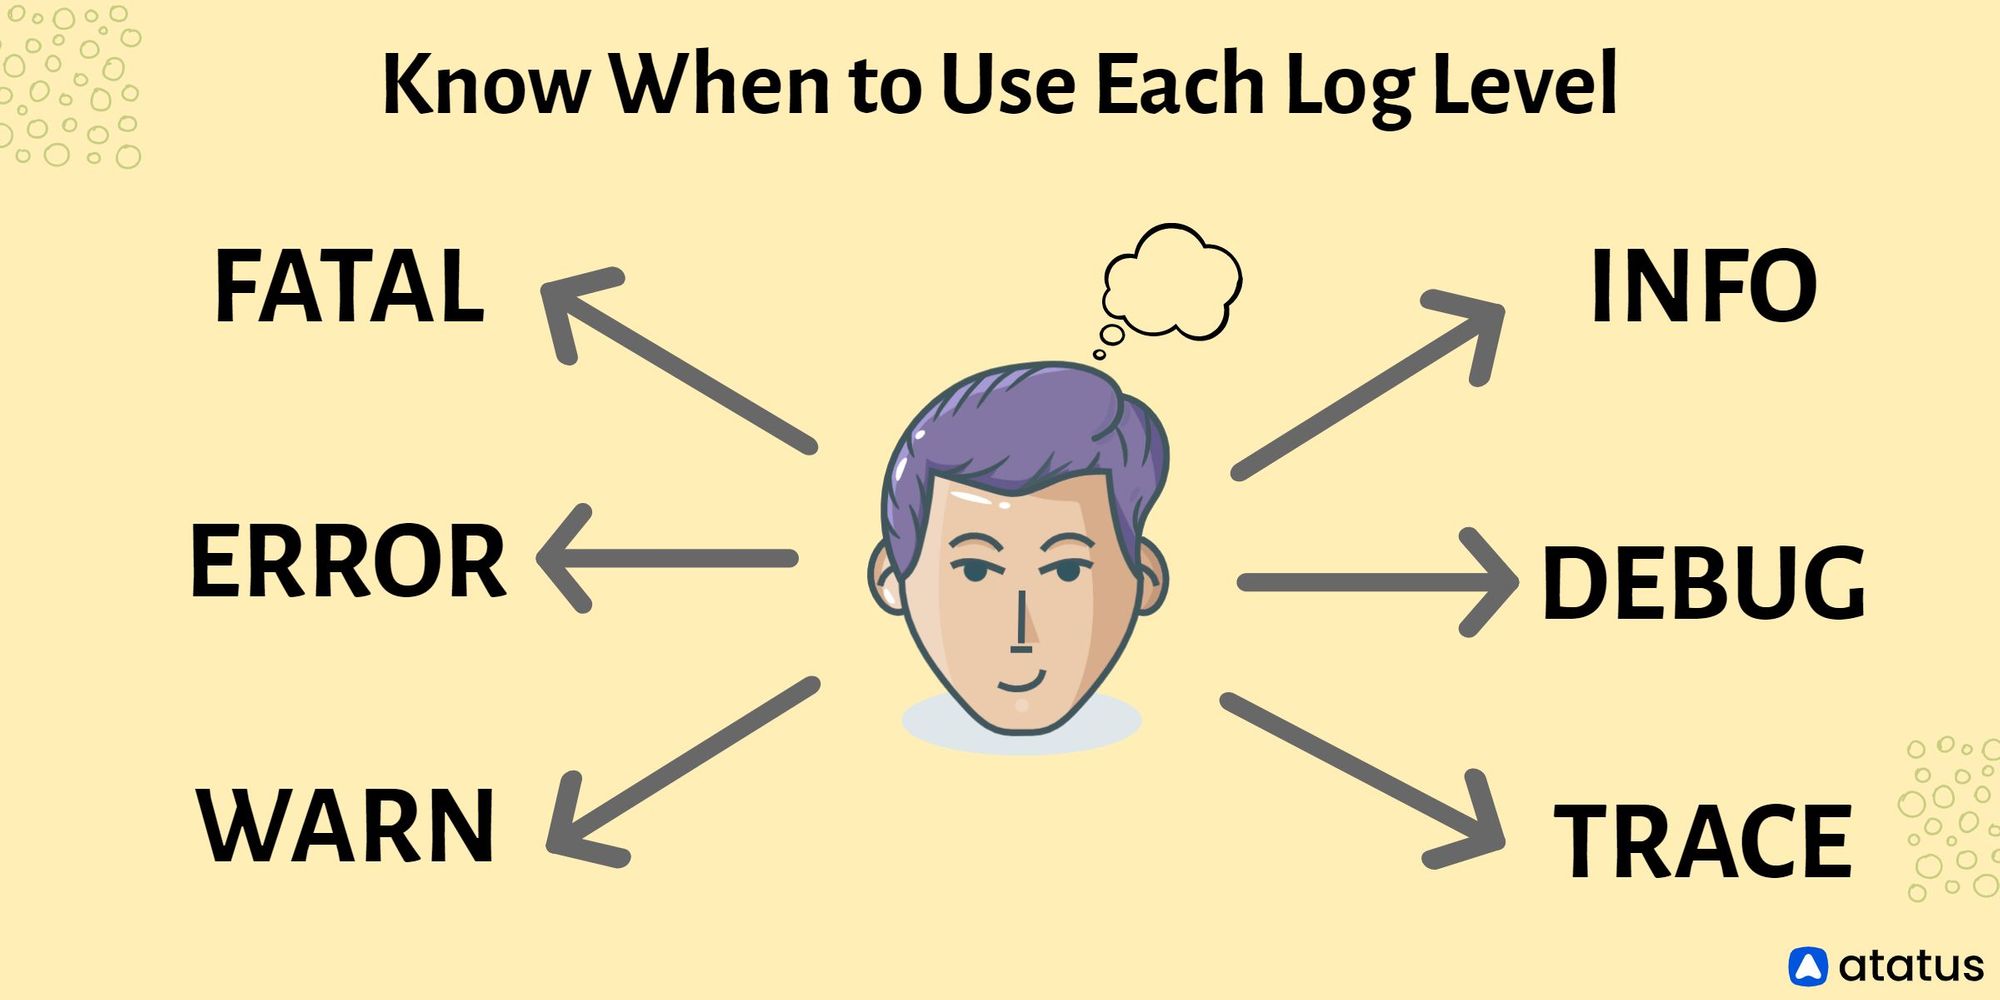
- FATAL – Identifies extremely serious error events that are likely to cause the program to abort. Typically, this leads to catastrophic failures.
- ERROR – Identifies error events that may still let the software run, but with restricted capabilities in the impacted routes.
- WARN – Describes events that are less destructive than errors. They usually do not result in any reduction of the program's functionality or its full failure. They are, however, red signs that must be investigated.
- INFO LEVEL – In the program behavior, it denotes the major event banners and informational messages.
- DEBUG – Denotes particular and detailed data, which is mostly used for debugging. These logs assist us in debugging the code.
- TRACE – To provide the greatest information on a specific event/context, it denotes the most low-level information, such as stack traces of code. These logs allow us to examine variable values as well as complete error stacks.
Regardless of the complexity and depth of each log level implementation, we must set them up appropriately in our code to deliver the best degree of information for each circumstance.
#3 Use English Language and Friendly Log Messages

Certain Unicode characters are not supported by several tools and terminal consoles for printing and saving log messages. At the logging level hierarchy, localization and other complex features may be difficult to implement. As a result, when composing log messages, make sure you stick to the English language and always utilize a widely recognized character set.
We may not be able to gather enough information to establish the context of each crucial event if we log too little. We will have performance concerns if we do too much.
Develop a thorough grasp of the system's functional and non-functional requirements, and plan for the proper quality and number of log messages to optimize log messages. Make each log message useful and relevant to the situation – and always keep it short and sweet.
#4 Have a Consistent Structure Across All Logs
A standard log file structure that is consistent across all log files is required for good logging. Each log statement line should reflect a single event and include the timestamp, hostname, service, and project logger name, among other things. The thread or process id, event id, session id, and user id can all be used as additional values.
Other important values could be connected to the event's environment, such as ID, deployment name, application version, or any other key-value pairs. Make sure your timestamp format includes time zone data and uses a high-precision timestamp.
Finally, if you want to feel like a pro, give each log line a unique ID. A logline usually has a set component and a variable part, making it difficult to filter certain patterns in or out. The unique ID comes in helpful at this point. Add an Error ID for logging errors. This will come in handy when you need to search anything up in your knowledge management system.
These are necessary for tracking or correlating issues across your architecture's components.
#5 Understand Metrics
Metrics are a fundamental notion in logging requirements. A metric is a measurement of a property's worth over time, usually at regular intervals.
The following is a list of common metric types:
- Meter – Calculates the frequency of events (ex: rate of visitors to your website)
- Timer – Measures the length of time it takes for a procedure to be completed (ex: your web server response time)
- Counter – Integer values are incremented and decremented (ex: number of signed-in users)
- Gauge – An arbitrary value to be measured (ex: CPU)
Each metric represents a condition of some system attribute. The fantastic thing about metrics is that you can have a lot of them and correlate them with each other.
We suggest tracking and logging metrics or keeping metrics separate from your logs.
#6 Make Each Log Message Unique
Most beginners make the mistake of copying and pasting the identical log message into many files, causing the final log aggregator tool to fill with similar log lines from various sections of the system. It is difficult to determine the specific location in the code that triggered the event when they do this.

If the phrasing cannot be changed, at the very least specify the log source with the log message to distinguish the final log lines. Also, if a parent class handles the logging, make sure to submit an identifier at start-up and utilize it when writing log messages for child behaviors.
#7 Always Provide Context
Logs are written in accordance with the code by developers. This means that the developers base the logs on the context of the code when writing them in the code. Unfortunately, the individual reading the log lacks that context and, in some cases, even has access to the source code.
For instance, consider the following two log statements:
- “The database is unavailable.”
- “Failed to Get users' preferences for user id=1. Configuration Database not responding. Please retry again in 3 minutes.”
By reading the second logline, we can readily deduce what the program was trying to accomplish, which component failed, and whether or not there is a solution to the problem. Each log line should have enough information to let you understand exactly what happened and what the program's status was at the moment.
#8 Reporting Alerts and Exception Handling
If something goes wrong in your code and you already know what to do, don't log in and then set an alarm — it's far too difficult and error-prone. Instead, create an alert from the code itself.

Also, while the stack trace is useful when logging an exception, it is difficult to interpret. Allow your framework or container to take care of it. There is one rule: if you throw exceptions from a remote service that can serialize them, make sure the client has access to all of them. Otherwise, instead of the "true" error, the client will receive NoClassDefFoundError: SomeFancyException.
Although logging exceptions is one of the most significant functions of logging libraries, many programmers see logging as a means of handling exceptions.
#9 Write Log Parsers and Proactively Monitor Logs
Most API logging systems include the ability to create custom log parsers and filters. These parsers allow us to store log data in more organized ways, making queries much easier and faster. Log data that is correctly organized can also be supplied into log monitoring and anomaly detection systems to proactively monitor the system and forecast future events.
These technologies are so sophisticated that they offer a fantastic visual experience through interactive dashboards based on time series and real-time event analysis based on log data and other sources.
Conclusion
The decision is no longer whether to log or not to log; rather, how and what to log has become a focus for IT operations trying to optimize application security monitoring and ROI over time.
Logging is an essential element of your website. Logs can inform you not only how healthy your website is, but also how to calculate critical metrics like the error rate. In the event of an error, logs assist you in locating the issue more quickly.
Atatus Log Monitoring and Management
Atatus is delivered as a fully managed cloud service with minimal setup at any scale that requires no maintenance. It monitors logs from all of your systems and applications into a centralized and easy-to-navigate user interface, allowing you to troubleshoot faster.

We give a cost-effective, scalable method to centralized logging, so you can obtain total insight across your complex architecture. To cut through the noise and focus on the key events that matter, you can search the logs by hostname, service, source, messages, and more. When you can correlate log events with APM slow traces and errors, troubleshooting becomes easy.
#1 Solution for Logs, Traces & Metrics
![]() APM
APM
![]() Kubernetes
Kubernetes
![]() Logs
Logs
![]() Synthetics
Synthetics
![]() RUM
RUM
![]() Serverless
Serverless
![]() Security
Security
![]() More
More