Top 7 Dynatrace Competitors to Know in 2024

Dynatrace is a publicly-traded global technology company that provides a software intelligence platform based on artificial intelligence (AI) and automation to monitor and enhance application performance, development and security, IT infrastructure, and user experience for enterprises and government organizations around the world.
The headquarters of Dynatrace is in Waltham, Massachusetts. Dynatrace's CEO is John Van Siclen. It provides a software intelligence platform for cloud and hybrid environments to medium and big companies.
Let’s learn more about Dynatrace in the below section.
Dynatrace
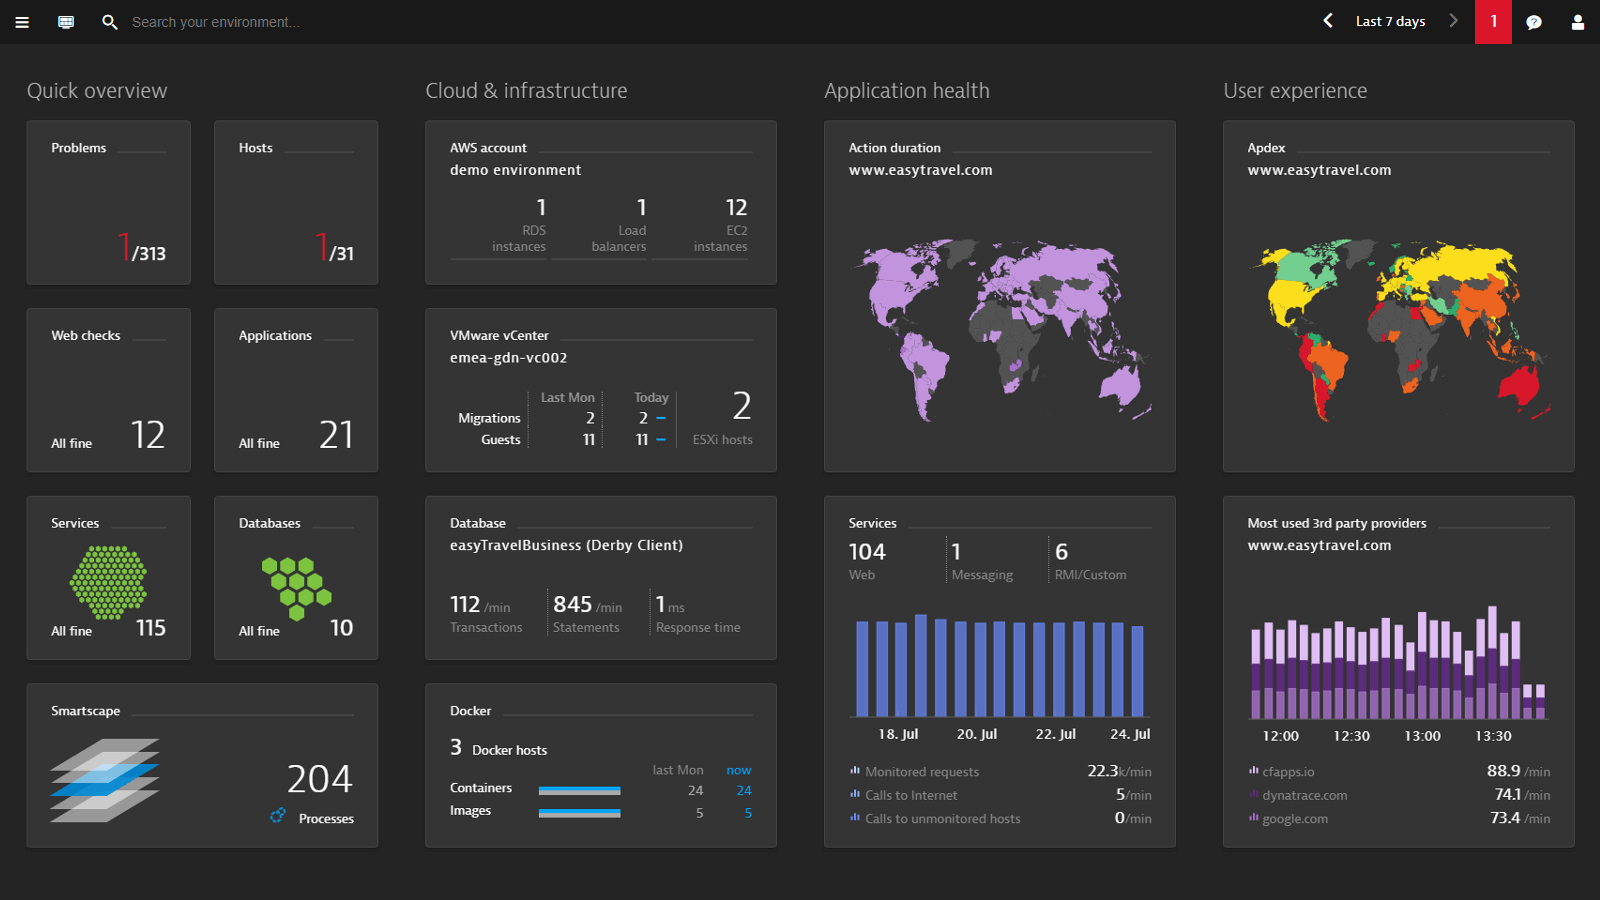
Dynatrace is a software-intelligence monitoring platform that reduces the complexity of enterprise cloud environments and speeds up digital transformation. It gives answers, not just data, about the performance of your applications, their underlying infrastructure, and the experience of your end-users, due to Davis (the Dynatrace AI causation engine) and total automation. It's used to modernize and automate enterprise cloud operations, produce higher-quality software faster, and provide your customers with the best digital experiences possible.
Dynatrace's all-in-one, AI-powered solution integrates infrastructure and cloud monitoring, application performance monitoring, and digital experience monitoring. Dynatrace helps to drive performance results by providing a shared platform and metrics for development, operations, and business teams. It was designed primarily for today's dynamic, hybrid, multi-cloud environments, which frequently include containerized applications and microservices.
Customer Reviews
G2 – 4.5/5 stars
Crozdesk – 4.5/5 stars
Capterra – 4.4/5 stars
List of Dynatrace Competitors
There are a lot of tools like Dynatrace on the market, which can make deciding which one to use seem difficult. In this article, we'll listed Dynatrace competitors in terms of user-friendliness, feature variety and sophistication, suitability for commercial use, and other important considerations with customer ratings.
#1 Atatus
Atatus is a SaaS-based application performance management platform that provides full-stack visibility for all of your applications and servers. It allows you to collect millions of performance data points across applications in real-time, allowing you to quickly fix problems and improve digital customer experiences. Also, with cloud or on-premise deployment flexibility, such things happen in real-time.
It provides a comprehensive view of all application performance metrics required to produce high-quality, dependable software. As soon as the issue comes, you will be notified. It includes information such as who, when, and what caused the performance loss.
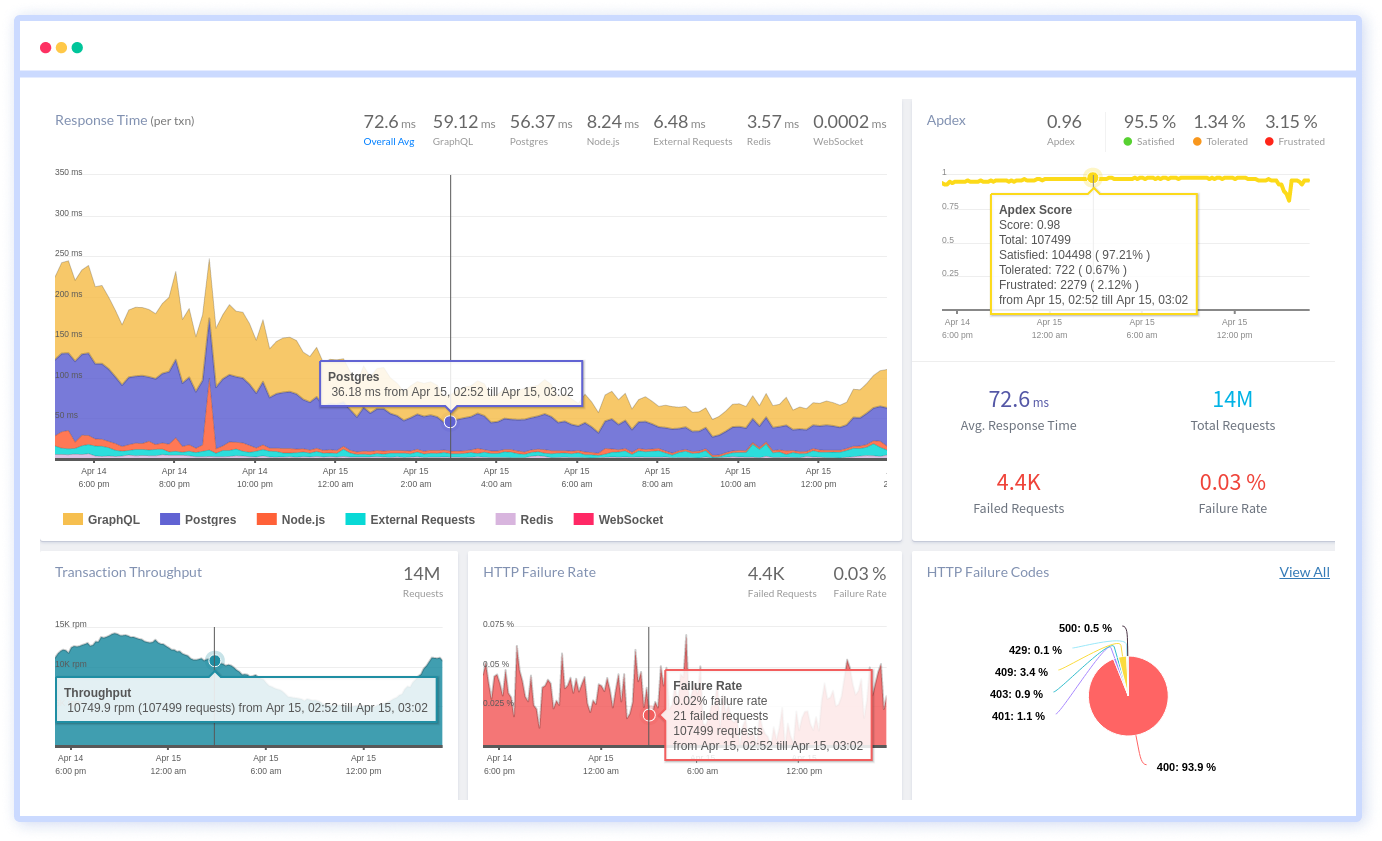
It keeps track of the health of your applications and alerts you when there's a problem with the customer experience. It analyses your user satisfaction levels using Application Index (Apdex) scores and examines the frontend and backend performance of your entire application. It also resolves application performance or availability issues before they affect your users.
You can optimize end-user performance by understanding the complicated frontend performance issues caused by slow page loading, delayed static assets, and ajax queries using Real User Monitoring. You can also keep track of JavaScript issues that have an impact on your customers' experience. You can assess your backend performance and analyse transaction traces, slow database queries, and external calls to other services with Application Performance Monitoring (APM).
PHP, Node.js, Java, Ruby, Python, and React are all supported by Atatus. It also works with Asana, Slack, Jira, GitLab, Codeship, VictorOps, and other tools.
Customer Reviews
G2 – 4.8/5 stars
Crozdesk – 4.8/5 stars
Capterra – 4.8/5 stars
#2 Datadog
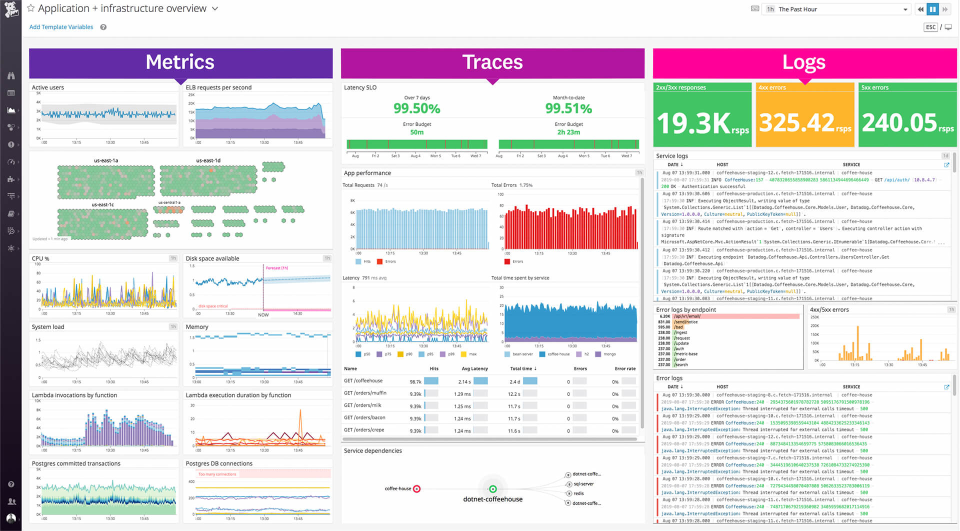
The Datadog solution is built on a common data model that enables AI and machine learning analytics. Across all supported data sources and stacks, this includes anomaly detection, event correlation, and root cause analysis. Datadog is one of the few providers that offers a single-agent architecture for traces, metrics, and events, unlike most others. This is a useful feature because it makes the tool simple to use.
Datadog's log analytics solution collects logs via the unified Datadog agent and the HTTPS API directly. Filtering may be done both on the server and on the client. It's frequently used for monitoring hybrid cloud architecture, and it's a solid favourite among IT experts. Its popularity as an APM solution, however, is currently limited.
Always-on profiling with AIOps, mobile monitoring, end-to-end tracing, security analytics, and much more are all supported by Datadog. It offers synthetic monitoring, such as SAM and Dynatrace. Unfortunately, the Datadog APM solution is less developed than its competitors, and the call stack tracing granularity of the tool is constantly changing.
Open-source integrations, such as OpenTracing and OpenMetrics, are also supported by Datadog. Some open-source plug-ins are also supported by Dynatrace. Although Datadog is a worthy competitor to Dynatrace, it is best suited for businesses looking for advanced cloud infrastructure monitoring.
Customer Reviews
G2 – 4.2/5 stars
Crozdesk – 4.2/5 stars
Capterra – 4.6/5 stars
#3 AppDynamics
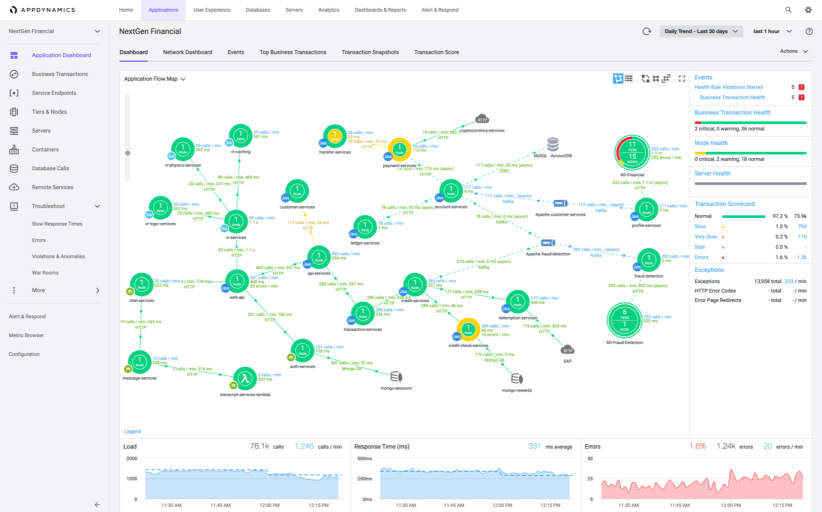
AppDynamics is an application performance management (APM) platform that assesses how application performance affects business outcomes using analytics and end-to-end transaction tracing. It comes as a SaaS or on-premise solution. Through easily accessible custom dashboards, AppDynamics gathers hundreds of valuable metrics right out of the box, without any instrumentation or code changes.
It's a full-stack, business-centric AIOps platform that assists developers in preventing digital performance issues by monitoring cloud-native technologies and traditional infrastructure to understand exactly what drives user experiences and influences businesses' bottom lines. Dynamic baselining and precise, real-time alerts provide a comprehensive picture of your system's ideal performance.
It is a performance management tool that is used to monitor servers and create metrics so that server health and performance can be continuously monitored. AppDynamics provides support for code-level detailed monitoring. The application also determines bottlenecks and calculates the server's trend performance. AppDynamics can quickly identify all server-related performance issues.
All of your application's components may be displayed, monitored, and managed using AppDynamics' streamlined, integrated solution. This level of detail allows you to improve the performance, user experience, and business outcomes of your application.
Customer Reviews
G2 – 4.3/5 stars
Crozdesk – 4.3/5 stars
Capterra – 4.5/5 stars
#4 SolarWinds AppOptics
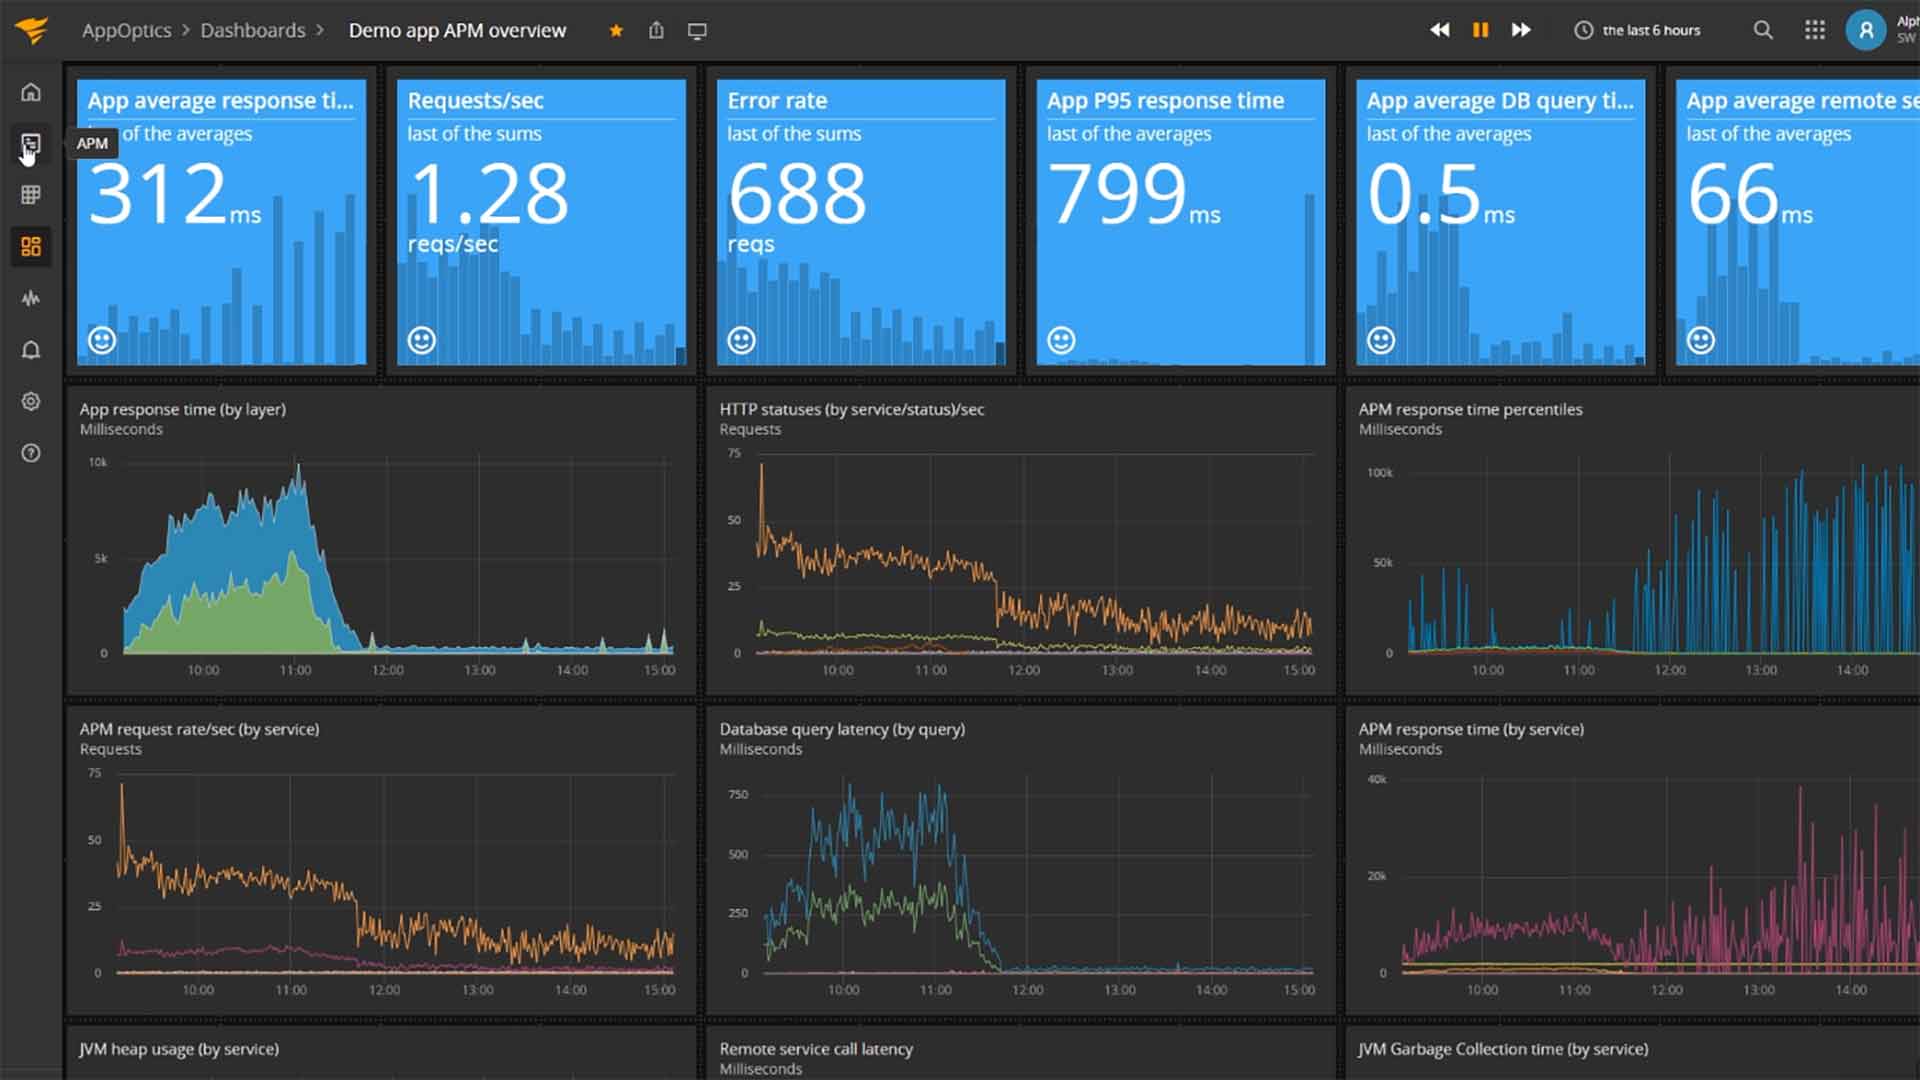
AppOptics is a comprehensive and robust APM solution. It's also simple and cost-effective, with monitoring options priced per host. This tool is simple to set up and may be utilized in the cloud, hybrid, and on-premises environments. It enables you to protect mission-critical applications. Automated application root cause analysis is another notable AppOptics feature. This feature quickly identifies the source of your application's performance issues, frequently in a matter of seconds.
The full-stack infrastructure and application monitoring solution from AppOptics provides continuous insight into hosts, containers, and serverless environments. This gives you immediate insight into the issue, allowing you to reduce mean time to resolution (MTTR) as much as feasible. In just a few clicks, you can dig down from a high-level view of your whole infrastructure to the details of a specific resource on a host or container.
You can troubleshoot distributed tracing, live code profiling, and exception tracking with this powerful tool. To evaluate poor performance, you can even dig down to a single line of code. Another advantage of AppOptics is the ability to drill down into logs with a single click, reducing the time it takes to find the source of an issue.
SolarWinds AppOptics is a low-cost, high-functioning solution with a plethora of advanced capabilities. It's simple to use and may be purchased per host, making it scalable in the long run. This tool also comes with over 150 pre-built integrations, dashboards, and analytics, as well as the option to create custom integrations.
Customer Reviews
G2 – 4.2/5 stars
Crozdesk – 4.3/5 stars
#5 ManageEngine
ManageEngine Applications Manager is designed to enable remote agentless monitoring, but it also offers synthetic monitoring and bytecode instrumentation to allow agent-based monitoring. It is another well-known brand in the IT software industry, offering a variety of IT operations management (ITOM) solutions. Network performance monitoring and diagnostics, ITOM, and security solutions are all included.
Container auto-discovery and orchestration are available in Applications Manager. This tool also helps with log collection and network performance monitoring, as well as providing further support for commercial off-the-shelf (COTS) applications.
Applications Manager, unfortunately, does not scale as well as other Dynatrace competitors. Furthermore, it focuses most of its efforts on the SMB market, its capabilities may be limited for enterprises with complicated architectures and requirements.
It's simple to use, covers a wide range of cloud and legacy infrastructure, and comes in SaaS and on-premises variants. It supports COTS applications as well as hyper-converged infrastructure. This tool is simple to set up, cost-effective, and suitable for SBB data centre environments.
Customer Reviews
G2 – 4.4/5 stars
Crozdesk – 4.1/5 stars
Capterra – 4.4/5 stars
#6 New Relic
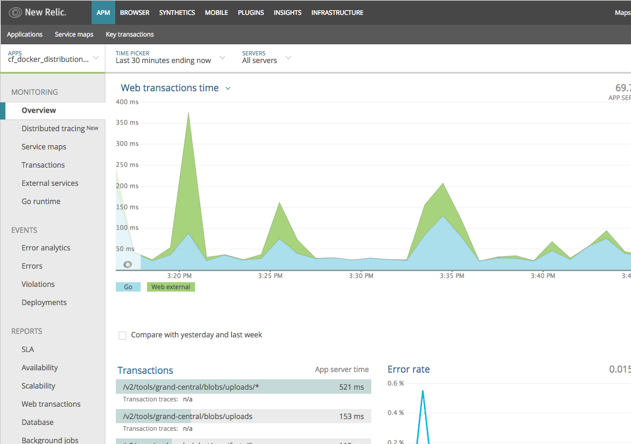
New Relic APM is a platform that includes DEM, logs, metrics, infrastructure, and analytics. Two years back, the New Relic One platform was released, which unifies these features into a single user interface. Users can use this tool to get background on a variety of technology and products.
You can ingest data from any source, including rival solutions, with New Relic One, increasing the possibilities beyond what proprietary agent technologies can gather. Users can construct their own custom applications using this solution, which allows them to combine data and create views of client environments across several domains. Since New Relic has AIOps capabilities, it can enable serverless environments.
New Relic APM supports open-source technologies such as Prometheus, Zipkin, Istio, and OpenTelemetry, as well as public cloud, microservers, and Kubernetes. New Relic is constantly adding new capabilities to its developer ecosystem, with ambitions to increase its cloud and IT service management connectors, as well as its DevOps utilities.
New Relic is a platform that may be customized. Unfortunately, depending on the environment and language being monitored, the New Relic architecture requires numerous agents. This tool could be more complicated than other single-agent architecture tools.
Customer Reviews
G2 – 4.5/5 stars
Crozdesk – 4.1/5 stars
Capterra – 4.5/5 stars
#7 LogicMonitor
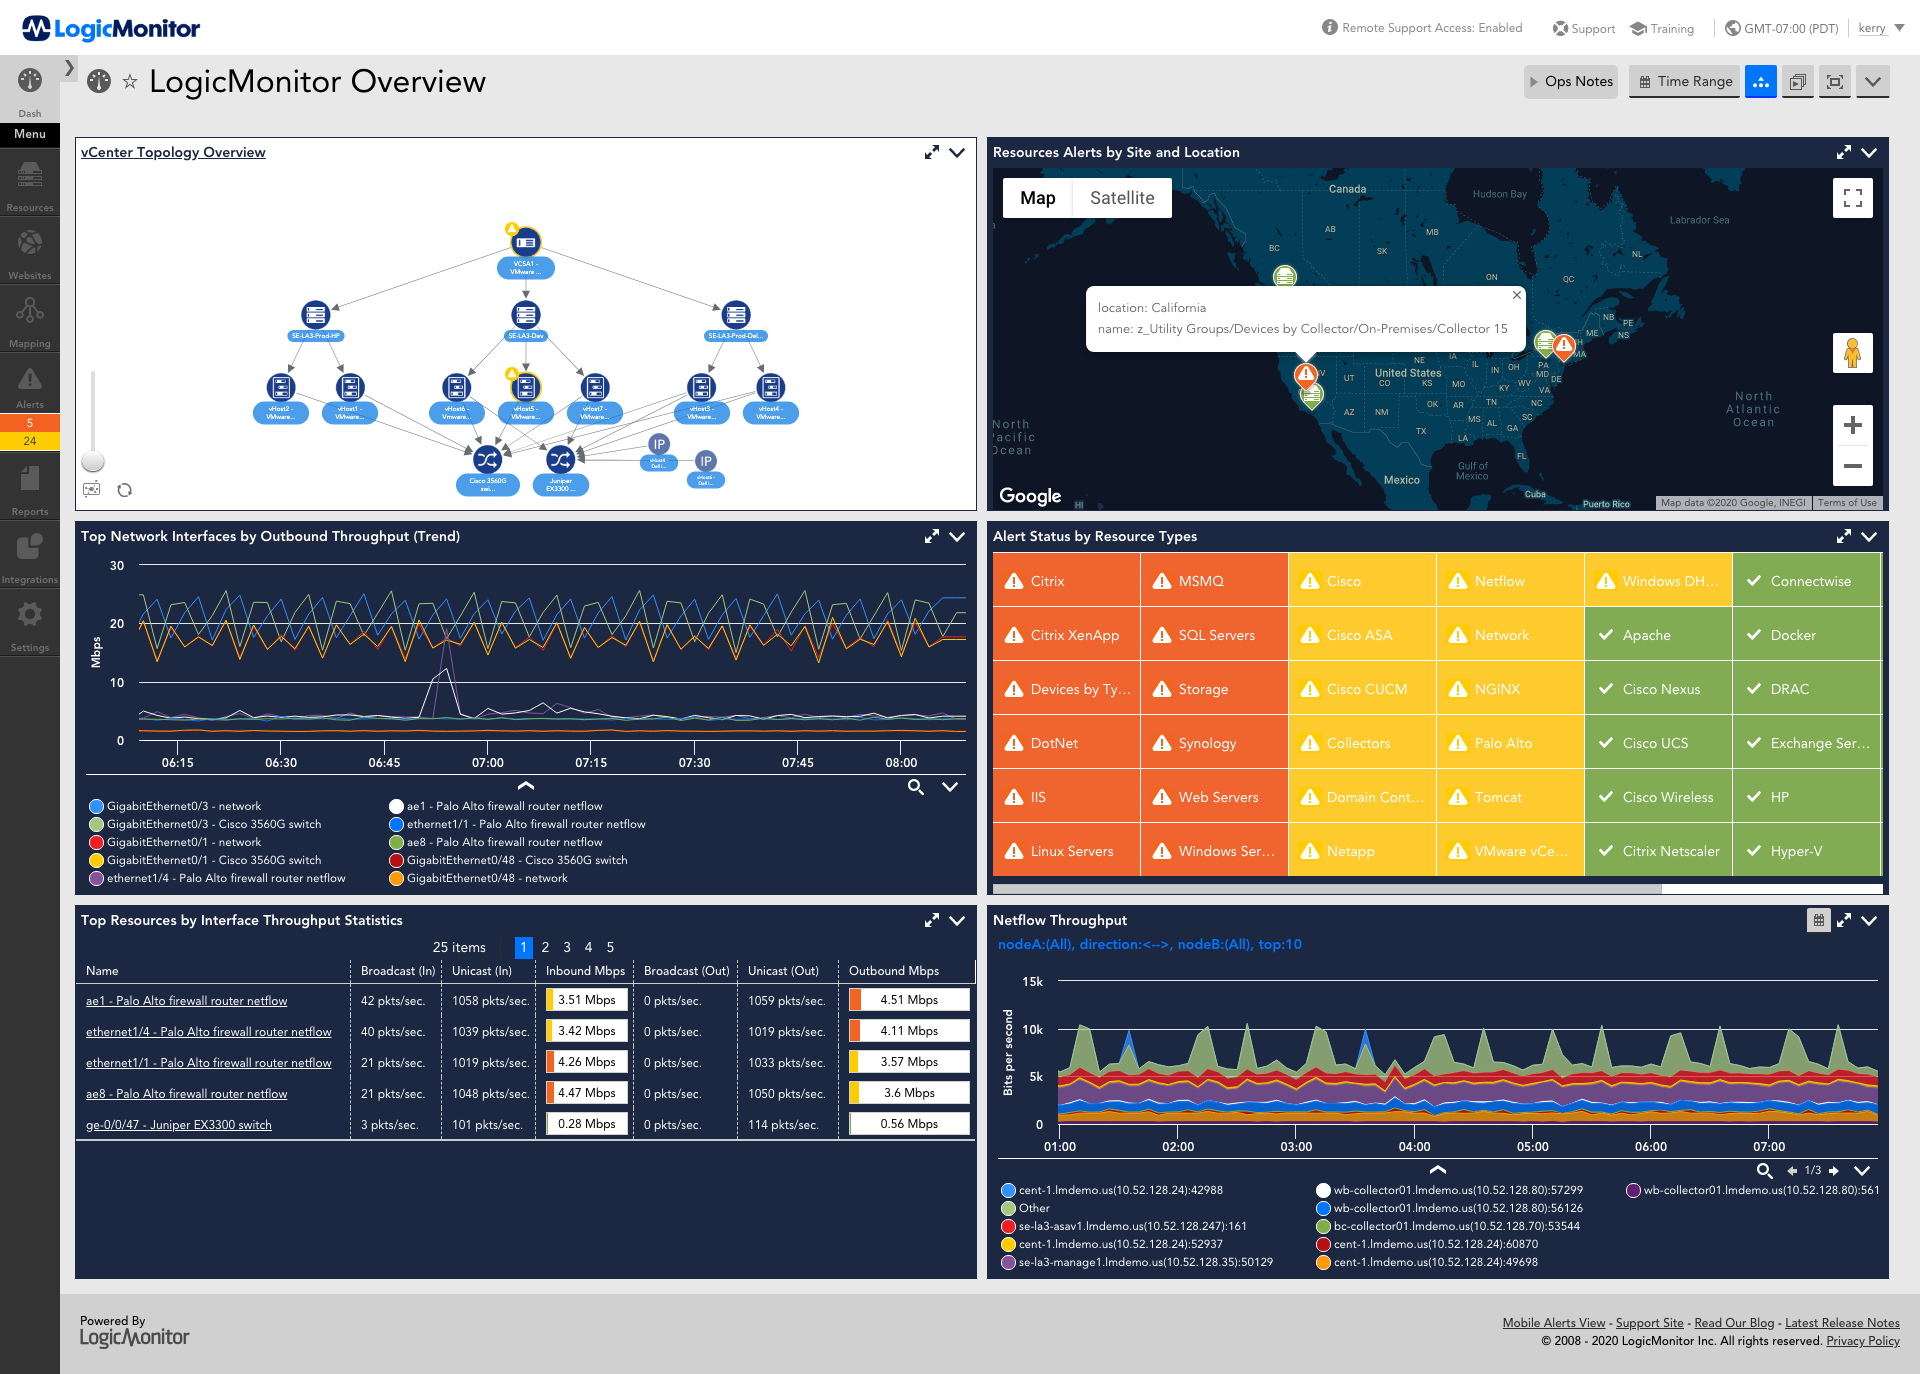
LogicMonitor provides SaaS-based data centre monitoring services for enterprise IT and managed service providers that are completely automated. Within one unified view, you can gain full-stack visibility for networks, the cloud, servers, and more. With automatic configuration, you can monitor every aspect of your developing infrastructure, from on-premises servers to cloud services, network flow to digital workflows.
Their agentless solution is light on your IT infrastructure and meets third-party security standards, allowing you to scale with confidence. Agentless technology adds very little weight to your IT infrastructure and meets third-party security standards, allowing you to scale with confidence. Data is stored in LogicMonitor for up to a year, allowing you to see historical trends, discover consumption patterns, and anticipate future expansion requirements.
Alerts are issued by email, phone call (text to speech), text message, webhooks, or the web if an issue is detected. Alerts can also be directed to different groups based on device type, the severity of the issue, and time of day escalation rules. Alert thresholds are pre-configured based on industry best practices, but they can be modified to meet your personal preferences and requirements.
Customer Reviews
G2 – 4.5/5 stars
Crozdesk – 4.6/5 stars
Capterra – 4.7/5 stars
Finally!!!
Dynatrace is a sophisticated tool for monitoring network and application performance and identifying and resolving issues. There are various alternatives to the Dynatrace tool that a business may use to monitor applications and identify performance bottlenecks so that they can be resolved and performance for the software application used by the organization can be escalated.
Hopefully, this guide should have provided you with some insight into Dynatrace competitors currently on the market. Share your thoughts about the article with us in the below comment section.
#1 Solution for Logs, Traces & Metrics
![]() APM
APM
![]() Kubernetes
Kubernetes
![]() Logs
Logs
![]() Synthetics
Synthetics
![]() RUM
RUM
![]() Serverless
Serverless
![]() Security
Security
![]() More
More