9 Best Real User Monitoring Tools and How to Choose One for Your Business
Bugs are more likely to enter the equation as applications grow larger and more complicated, resulting in poor user experience. We tend to abandon applications when they don't load as quickly as we expect.
Developers need code-level performance insights to deliver the optimal user experience. They also need to know which users are affected by issues so that they can reproduce the issue and work on a solution more quickly.
Real User Monitoring is a technique for detecting performance problems and determining their causes in real-time. The technology explains how real users interact with your application, allowing you to determine what has to be done to improve the user experience.
Here how it’s done:
How to Choose Real User Monitoring Tool for Your Business?
We look at what elements to look for in a real user monitoring tool to provide a great user experience.

Functionality and Features
A simple real user monitoring tool should track the user's journey, collect standard W3C metrics as well as custom metrics provided by the company, and track customer engagement metrics such as conversion rates, bounce rates, and cart abandonment rates, among other things.
Advanced RUM solutions are designed to help businesses enhance and optimize their processes. To accomplish this, RUM should collect user data (such as device type, browser type, ISP, geo-location, and so on), identify processes in the application that need to be optimized, detect outages and performance trends, alert relevant teams when a performance anomaly occurs, and estimate the impact of downtime or a performance-related incident on the business to help in negotiating SLA breaches.
A real user monitoring tool should also have simple alerting capabilities in addition to these advanced features. Alerts guarantee that any event is dealt with as soon as possible, reducing the MTTR (Mean Time to Resolve).
Implementation Options
When choosing a performance analytics tool, the first two aspects to consider are ease of implementation and usability. There are several ways to connect RUM with an application, therefore you should be aware of the following:
- Easy to integrate
- Pre-requisites for implementation
- Supported environments (software/hardware)
- SDK available for mobile applications
JavaScript snippets are commonly used to implement RUM. Since the script is embedded in the application code, it may require some customization based on the application's complexity. You can, for example, select which pages in your application to watch and insert the code just on those sites.
Unified Monitoring System or Standalone
RUM is one of the many tools available in the digital experience monitoring space. When RUM is combined with other monitoring tools, it provides insight into the end-user experience as well as all of the application's processes and components.
Additionally, selecting only the monitoring tools that you require allows you to create a more simplified and cost-effective monitoring plan. Whether you want to utilize RUM exclusively or combine it with additional monitoring techniques like synthetic monitoring, it's critical to assess the value these tools give.
Data Handling
The way data is managed, which includes the frequency with which data is gathered and the length for which data is stored, is a significant distinction amongst RUM tools.
Users can plot past patterns and extrapolate current trends by keeping RUM data for longer durations. This is a crucial part of the data analysis process. It's also crucial to understand how the data is collected or sampled. These are features that must be configurable or built-in. As a result, it's a necessity to understand how the RUM tool handles data.
API Functionality
The capacity to examine and analyse data is one of the benefits of employing a performance monitoring tool. This helps in the understanding of patterns and the identification of areas that require improvement. RUM data can provide useful insights, but with so many data points to evaluate, data analysis can soon become a difficult task.
Data Reporting and Visualization
The RUM tool's reporting capability is an important feature. The report kinds and customizability provided can make a big impact in data analysis.
Advanced RUM tools can aggregate data depending on a variety of factors like the user's location, device kind, network type, ISP, and so on. The option to create custom metrics to organize data based on the user's needs is an extra benefit. These particulars aid in the creation of thorough reports.
Licensing
Understanding the various licensing choices will assist you in selecting a RUM solution that adds value to your monitoring strategy while also saving you money.
You must decide whether to utilize RUM alone or in combination with other monitoring tools such as Synthetic monitoring based on your monitoring requirements. RUM, along with other digital experience monitoring tools, is available as a free add-on service from some monitoring companies. Companies that provide RUM services based on data sampling are also available.
9 Must-Try Real User Monitoring Tools
#1 Atatus
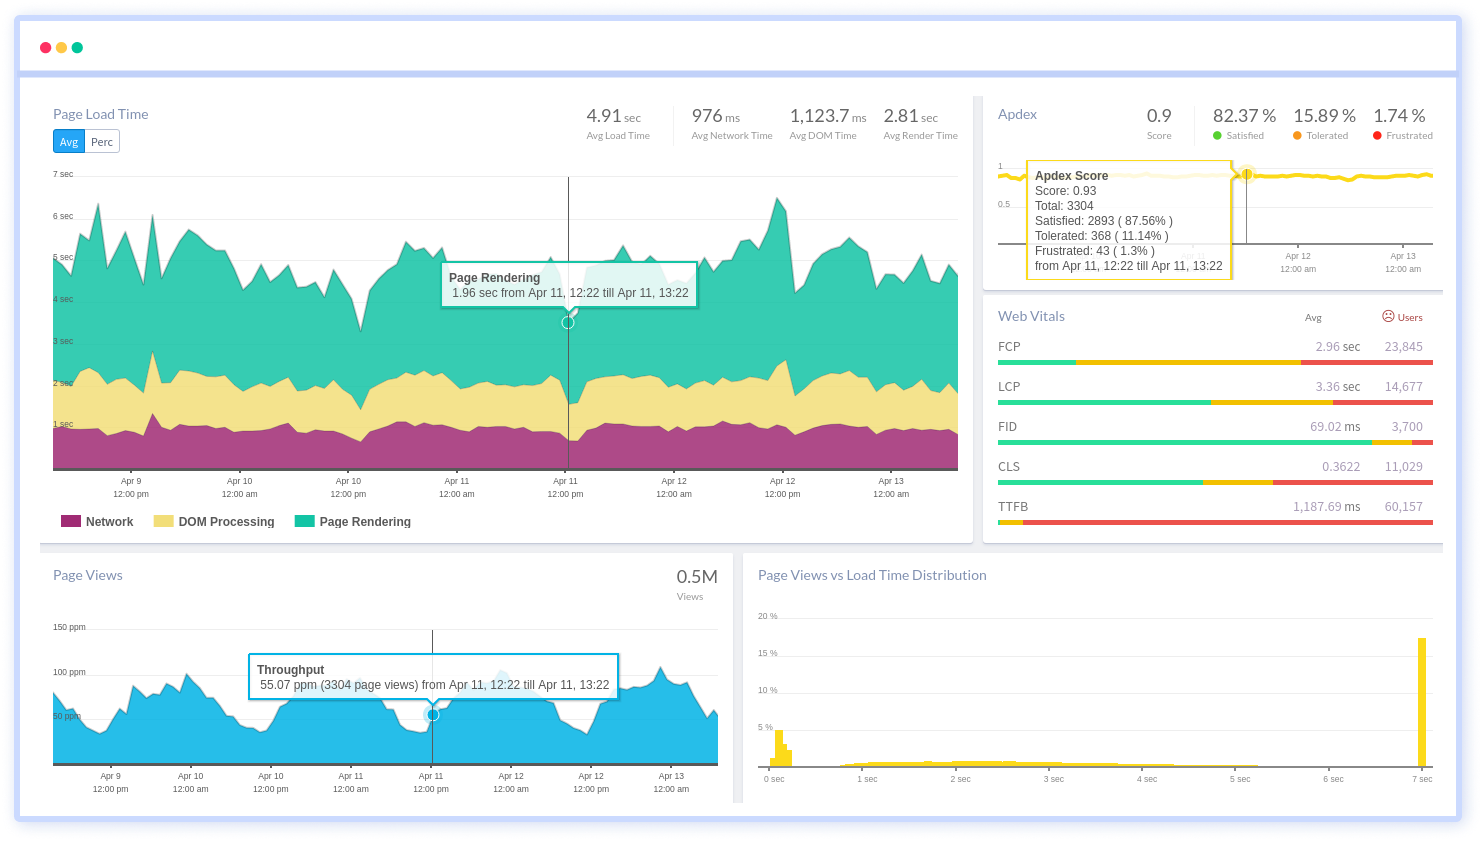
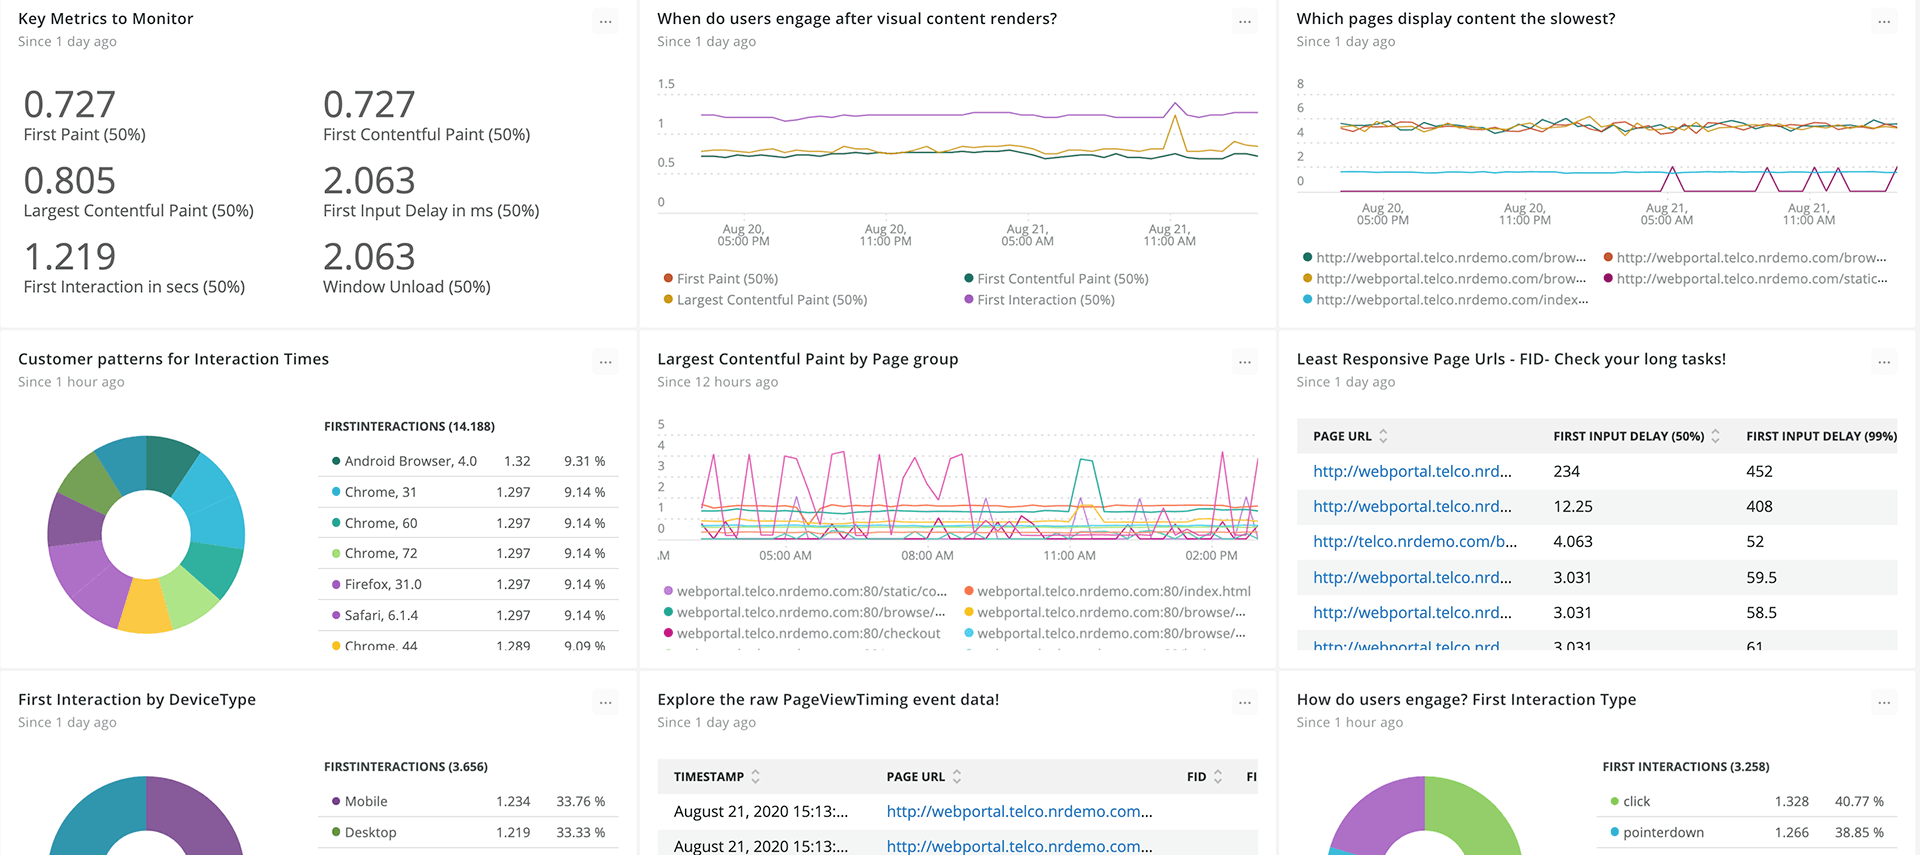
Atatus provides a scalable, real-time monitoring solution that helps you obtain visibility into your website's poor-performing parts that are affecting your end users, as well as understand your front-end performance and errors. For Google's Core Web Vitals and other web vitals, we collect critical performance data that can help you figure out what's causing poor performance at the user level if they're experiencing trouble engaging with the page, are seeing unexpected changes, or the page is taking too long to load.
To quickly discover and rectify front-end performance issues affecting real users, you can get a detailed picture of each page-load event. Also, with filterable data by URL, connection type, device, country, and more, you can see which assets are slowing down your pages in a detailed full resource waterfall view.
Gain insight into performance and user behaviour without having to wait for a page to load. Single Page Application route modifications performance may be viewed independently of the JavaScript framework, demonstrating how user interactions affect the user's experience after the page loaded.
With in-depth insights on response time, call-back time, throughput, HTTP failures, data transfer size, and more, you can figure out which page visits are calling the server-side controller. Understand how these poor AJAX requests affect page load time and the user's digital experience.
Learn more about Atatus Real User Monitoring.
#2 Sematext
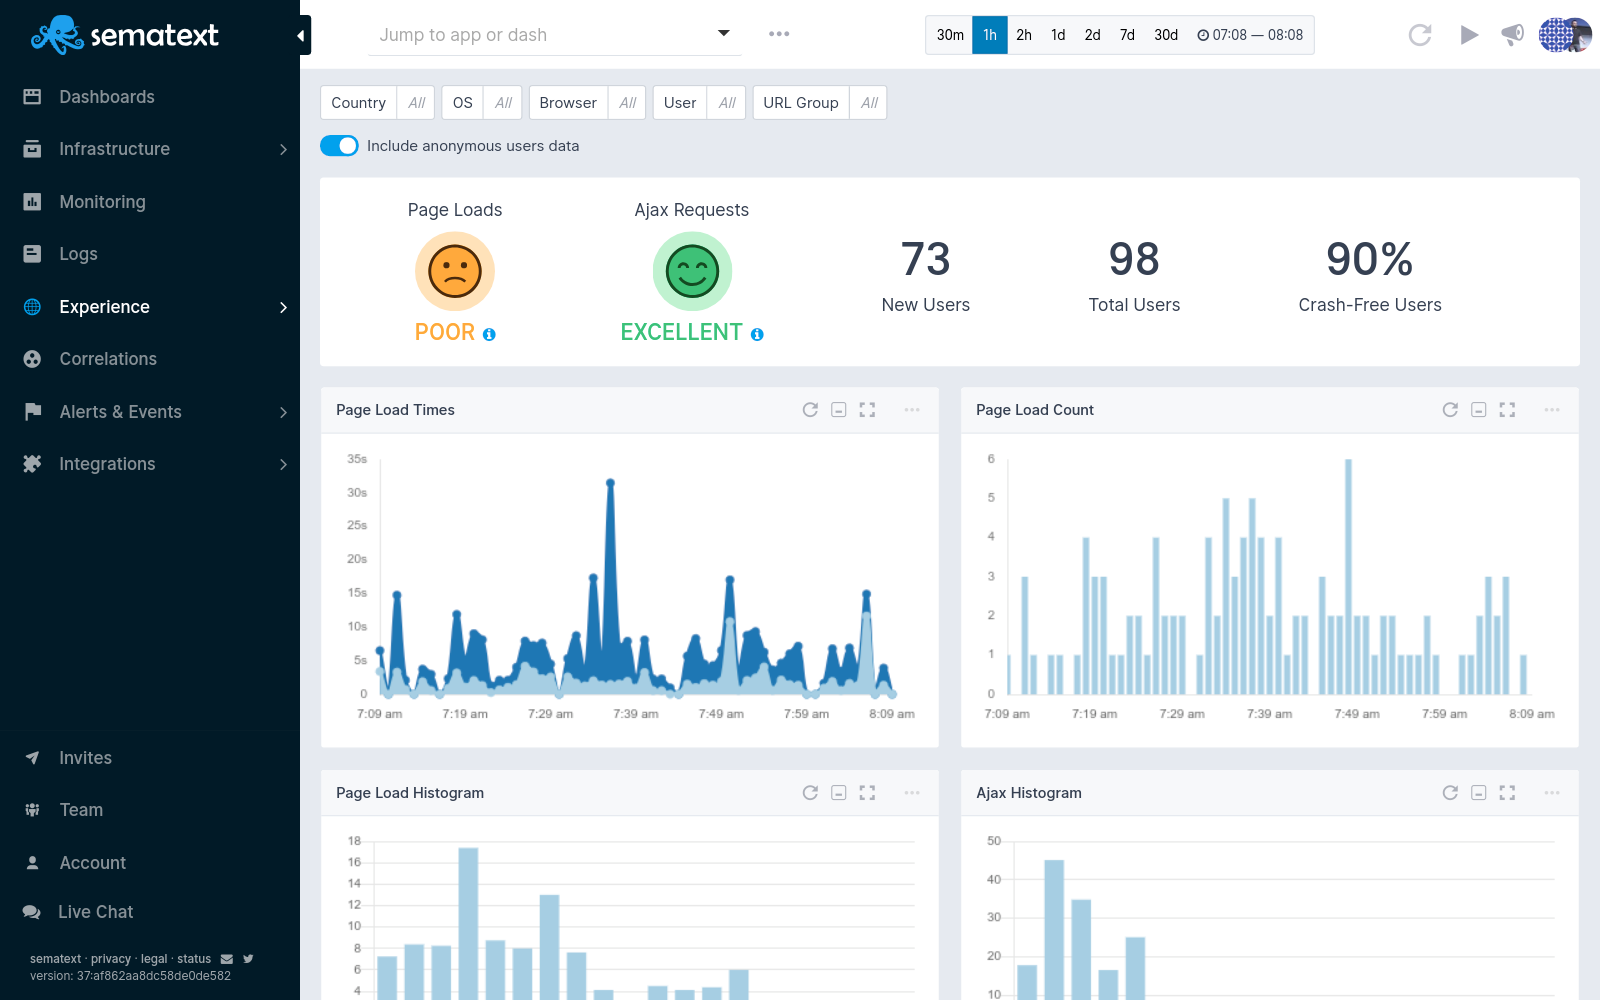
At the top of its dashboard, Sematext has a rapid status recognition feature. This is represented by two smiley face icons that reflect the speed with which a site loads pages and responds to Ajax queries.
The dashboard is well-designed, with quick statistics on a site's amount of users and recent performance displayed as graphs. The view can be instantly adjusted to display data based on the user's country, operating system, browser type, page, or page group. At the push of a button, the time segmentation may also be changed.
With these data modification features, the same dashboard interface may be utilized for real-time data tracking as well as historical analysis. Through its alerting mechanism, Sematext provides excellent support to busy website managers. Administrators do not need to monitor statuses because they will be notified if something goes wrong. All of the performance thresholds that set off alerts can be tweaked.
#3 Raygun
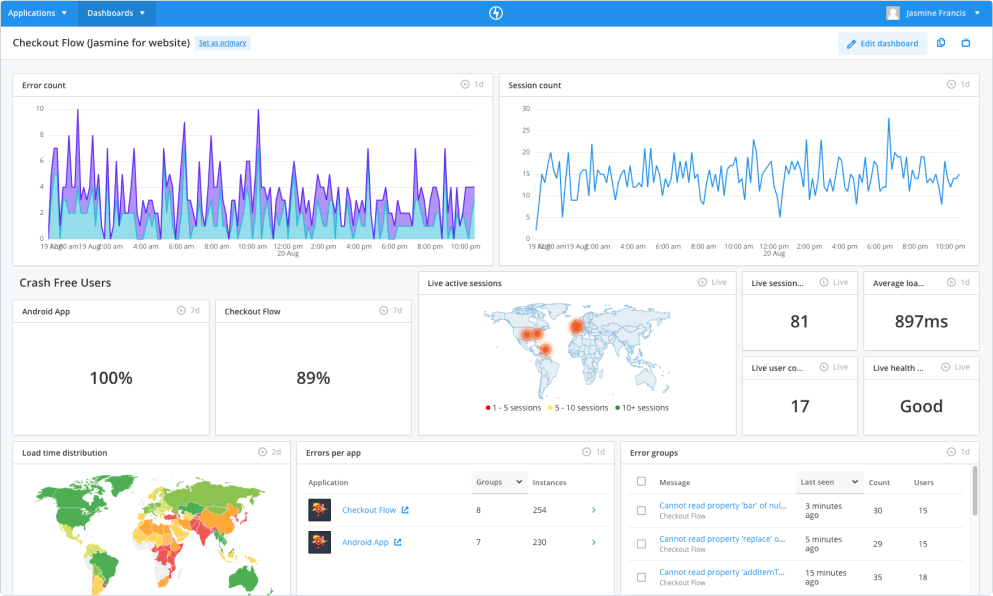
Raygun's Real User Monitoring software for mobile and web provides extensive insights into actual user experiences. It gives you complete visibility by analysing the right set of data and proactively recognizing problems. It helps in the optimization of application performance and the tracking of trends in order to provide the best possible user experience.
Custom alerts and reporting, fast identification and diagnosis of bad front-end performance, powerful filtering to sort data by browser, geography, or device, and more benefits are all offered by Raygun. You can monitor how visitors interact with your applications using Raygun's RUM tool, as well as to detect, diagnose, and resolve performance bottlenecks they experience along the way. It analyses real-time data from each user session and recommends the most "profitable" changes to make to ensure a positive web experience.
#4 AppDynamics
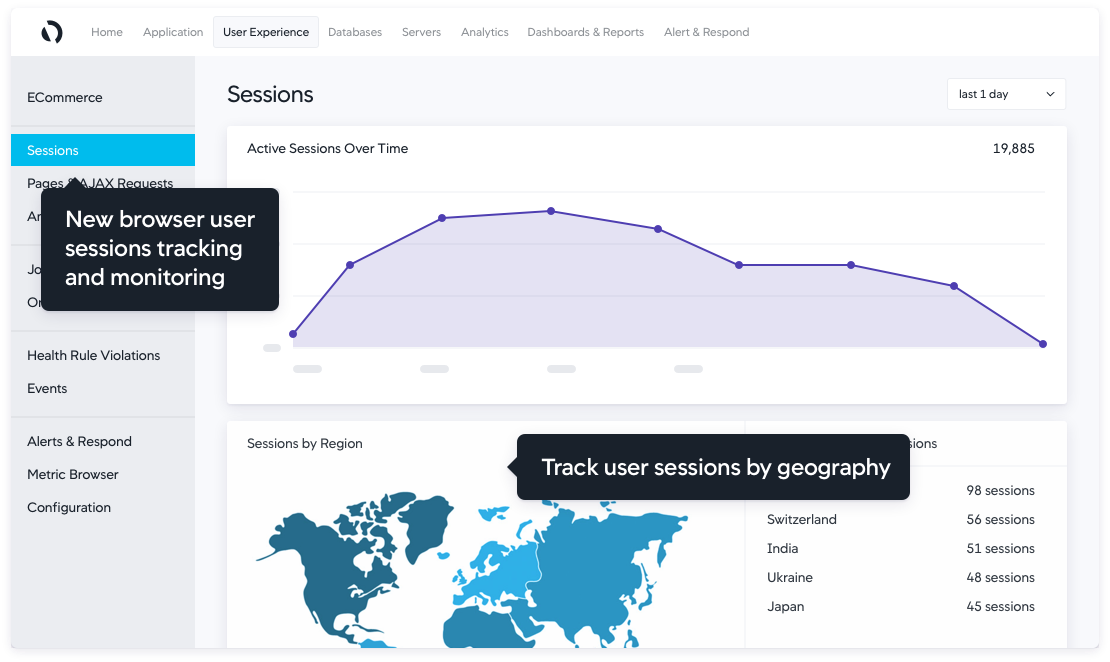
The RUM tool from AppDynamics tracks customers' journeys to provide you complete visibility into their interactions with your webapp. You'll get browser-user data to help you improve web experiences. Self-learning algorithms use the application's activity to dynamically baseline web metrics and find and resolve anomalies automatically.
AppDynamics system allows a web developer to see which third-party applications are slowing down a site's performance. It's possible that none of a website's performance concerns are caused by the site itself, but instead are the result of a slow-to-deliver API. In this situation, the site designer has the option of uninstalling the library and replacing it with something else or leaving out that function altogether.
Each event can be analysed from beginning to end, tracking a user's trip through the site, or on a drill-down basis, looking at each triggered event and then uncovering the services that enable it, all the way down to the hardware. A website designer can detect the main cause of load errors or delayed response times by switching between these two displays.
#5 Dynatrace
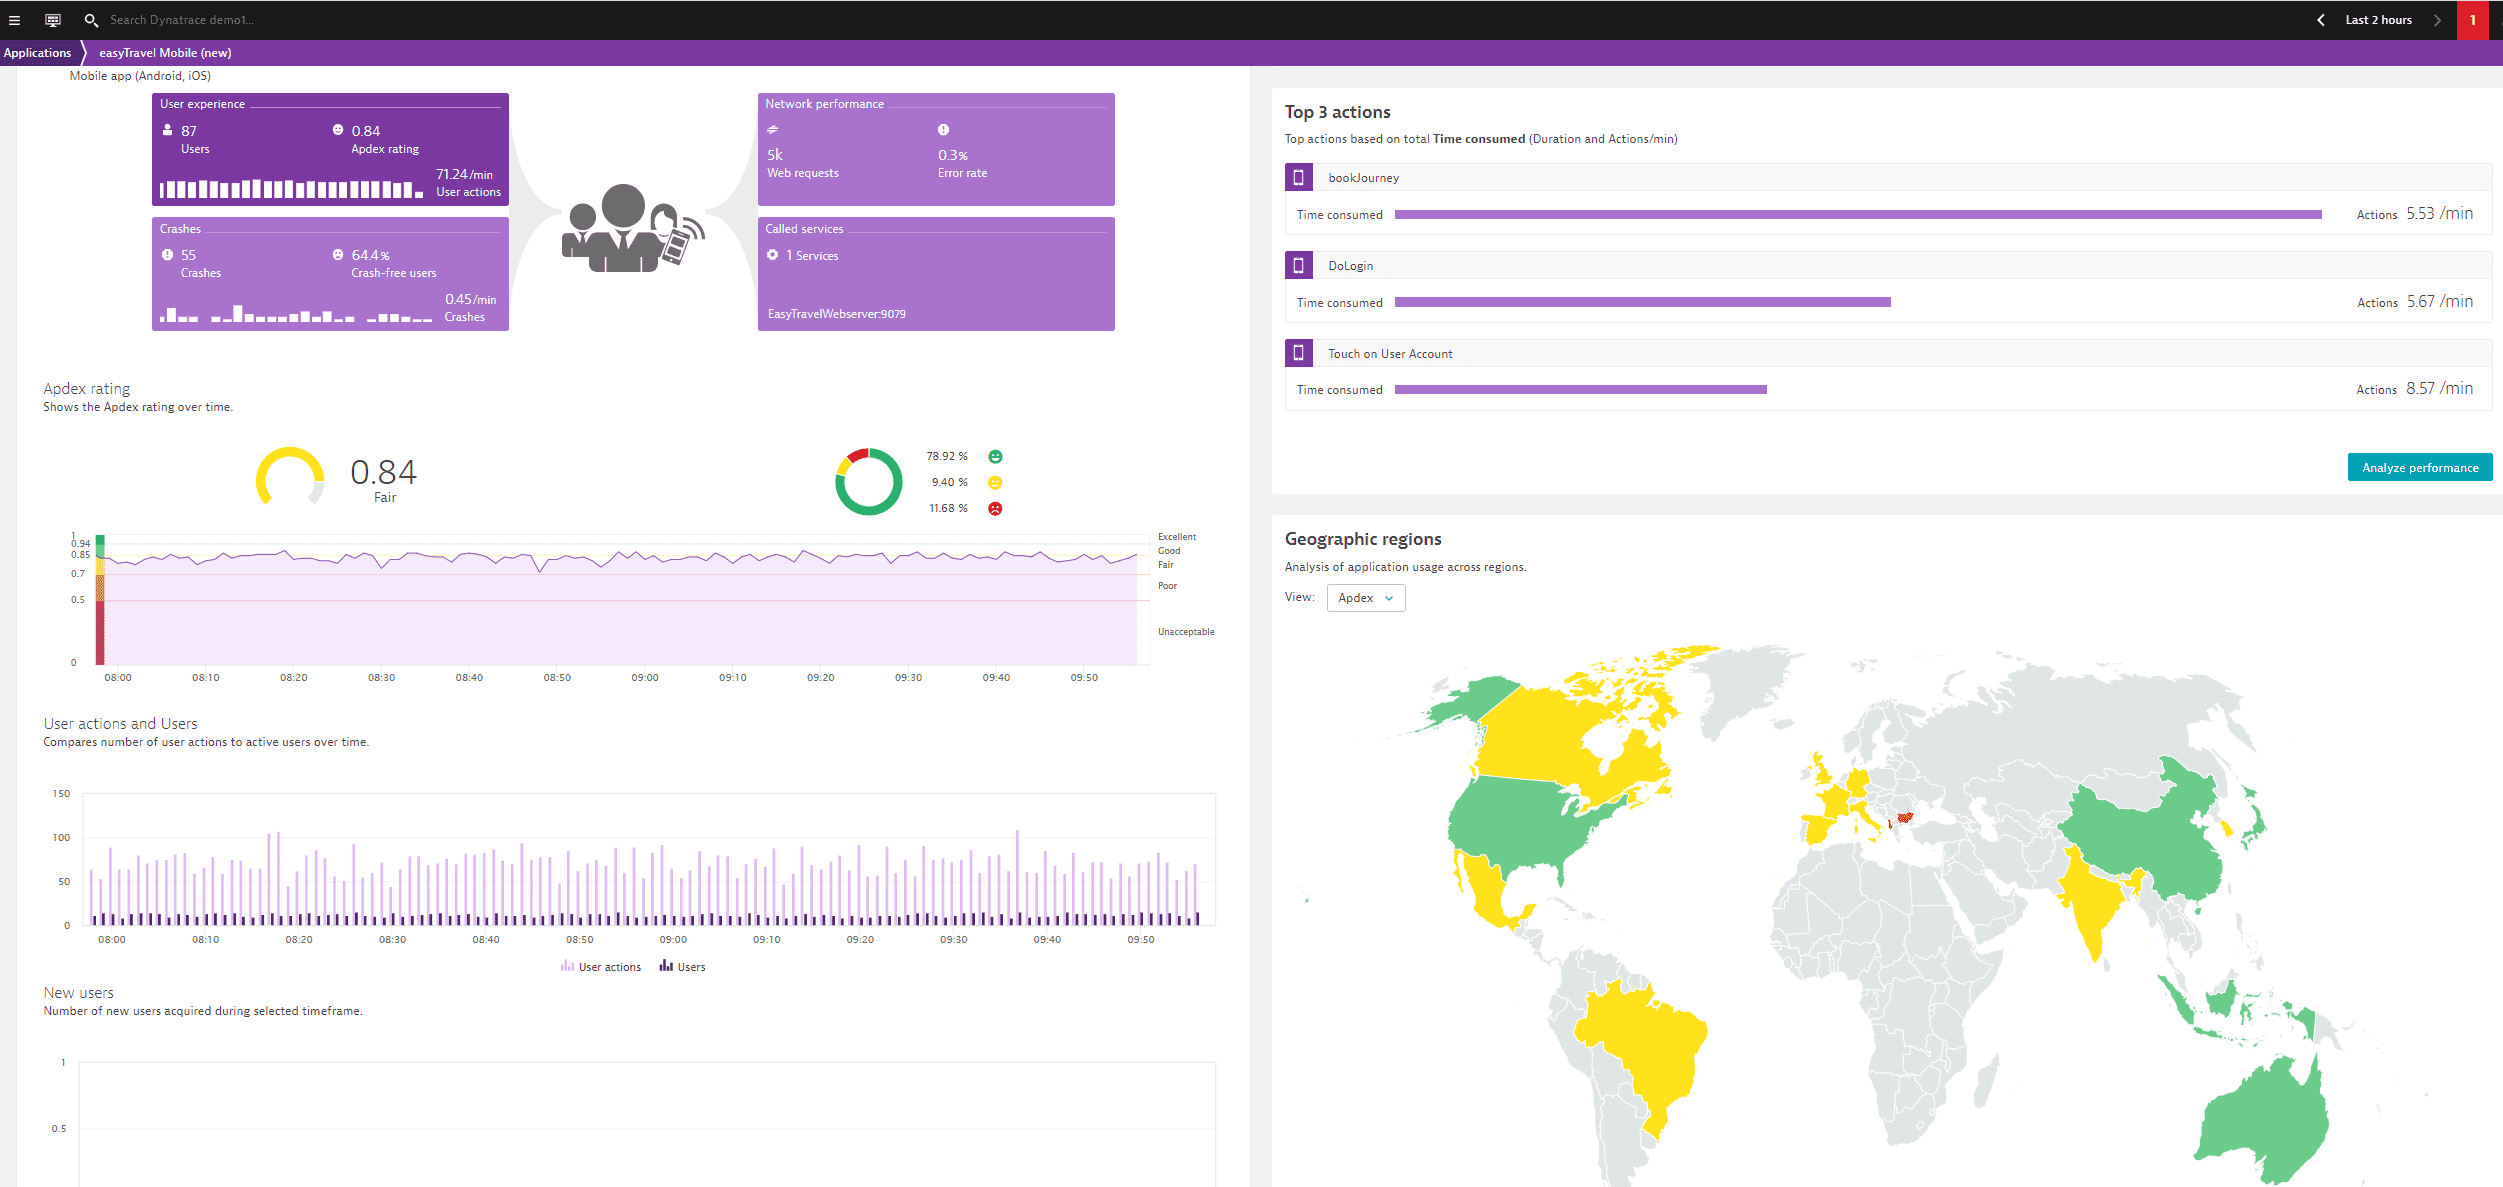
Dynatrace includes a complete set of synthetic modelling and real-time user monitoring capabilities, as well as a session replay feature. After purchasing a block of credits, the customer must choose which service to utilize them on. Dynatrace's Real User Monitoring capabilities provide a run-through trace of an individual user's actions on a site as well as aggregated data that determine the performance of each site element.
The Dynatrace service has a one-of-a-kind session recording feature. It allows a technician to monitor the screen as if it were a remote desktop view of a user's live actions after a session has ended. A technician can pinpoint which behaviours resulted in mistakes using both historical data and session run-throughs. These qualities are also beneficial to marketing analysts who are attempting to determine which services generate the most user activity.
#6 New Relic
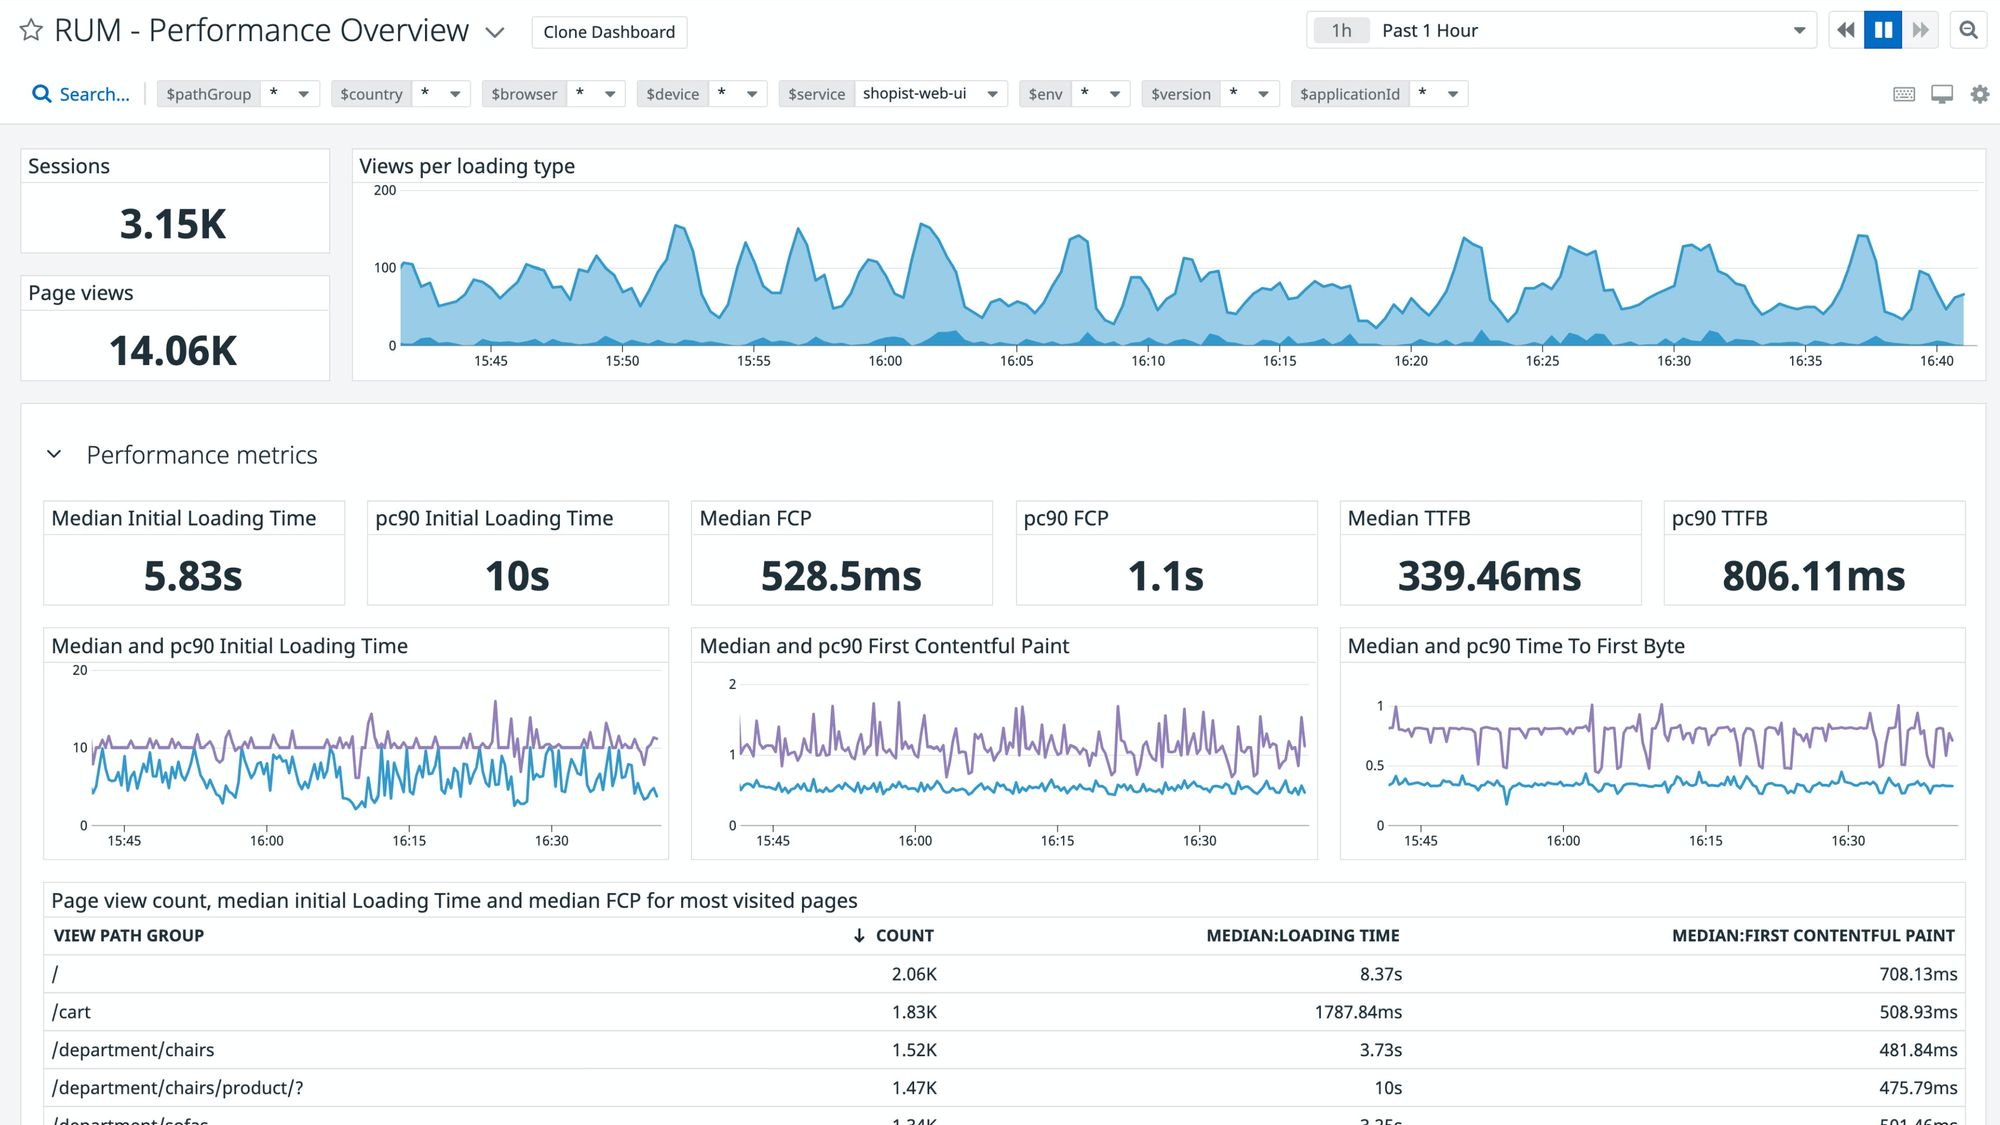
New Relic's real user monitoring tool focuses on browser monitoring and performance optimization. Since it is part of their platform, businesses must install an agent to use it. With New Relic's end-to-end insight, you can spend less time on-call and more time optimizing the customer experience. Using distributed tracing, quickly debug errors and assure successful deployments using synthetic lab and real-world data.
It contains extensive RUM features that focus on browser performance and give you access to insights from the users' perspective. It tracks a page's or view's complete life cycle, from the moment users open the app until they exit. Regardless of which JavaScript framework you use, you can view Single Page Application route change performance.
Low-level instrumentation with powerful low-level capabilities can also capture interactions beyond route changes that can be changed via API, allowing monitoring specific to your application's architecture, such as for custom frameworks. To test and improve the end-user experience for their dynamic pages, web performance teams can employ more sophisticated metrics than just page load time.
#7 Datadog
Datadog's RUM service competently monitors load times, error rates, and service dependencies, and delivers performance data on a cluttered graphics-packed dashboard. Performance expectation thresholds and notifications for when those levels drop are included in the real user monitoring service. As a result, website managers will only need to access the dashboard when they are alerted to potential issues.
Even while the dashboard's crowded data screens can be a lot to take in, the dashboard's congestion of information eliminates the need to switch between screens to gain a complete picture of a website's performance. Deep dive screens are less congested, and they include tools for debugging common errors and determining the source of delivery issues.
The user can view aggregated data by country, device, browser, OS, and session type on the analysis screens. This interactive data explorer allows you to choose between different data representations and time horizons. It is also possible to investigate actions and events.
#8 Uptrends
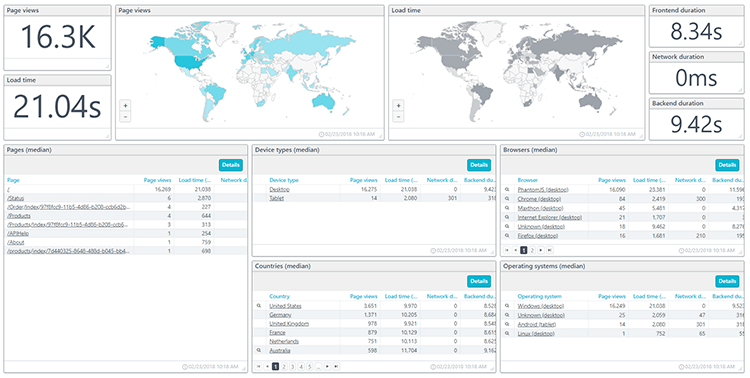
RUM from Uptrends is a simple and intuitive tool for real-time data analysis. It supports multi-browser monitoring and provides API and server monitoring. It's a flexible platform with a simple UI and quick reporting capabilities. It also has a fully customizable dashboard, in-depth page views vs. performance research, load time breakdown per dimension, and the ability to see how users are distributed geographically.
You only need to copy and paste a code snippet on your web pages to use the Uptrends RUM. After then, the Uptrends script will start gathering data about your users' experiences. This data feeds a set of RUM dashboards that you can use right away to evaluate key metrics like page usage, performance by nation, browser usage, and more.
You may use web analytics tools like Google Analytics to evaluate how your site functions from the perspective of users and gain insights into profiling these users. In minutes, the data appears in your dashboards, allowing you to see the big picture by collecting data from all page views.
#9 Pingdom
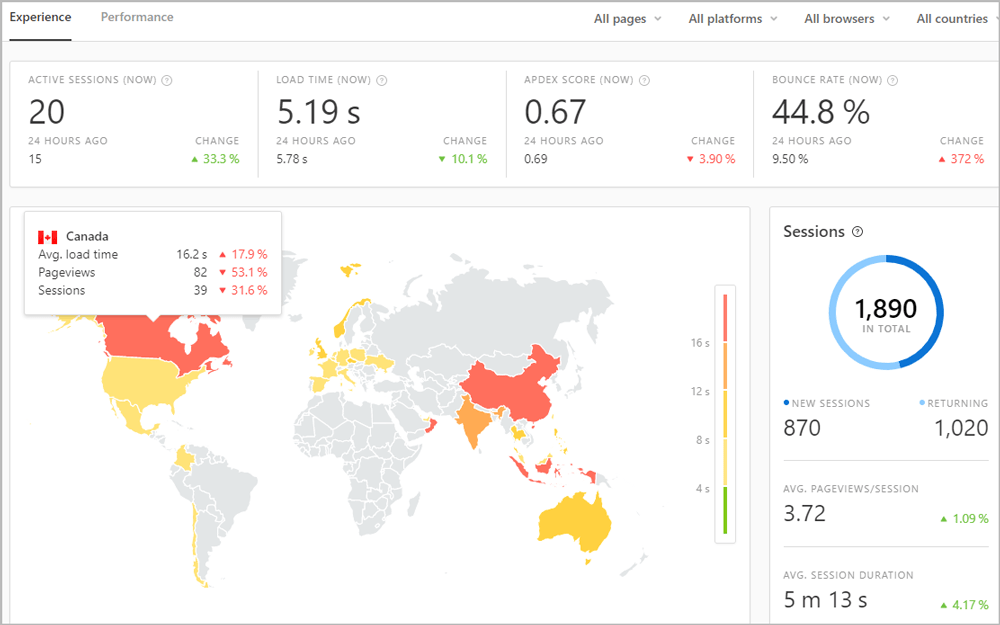
Pingdom's Real User Monitoring service provides data on the performance of marketing efforts and the performance of website services. The Pingdom Real User Monitoring dashboard's main screen displays a world map with color-coded traffic levels by nation. This map depicts the site's load times when accessed from various countries.
The number of live connections to the site and the ongoing bounce rate observed over the previous 24 hours is two more significant indicators that are instantly available. For the user experience and system performance, the dashboard is separated into screens. The most commonly used access device and browser types are shown in the user experience data. The tool also keeps track of customer satisfaction.
Performance thresholds are included in the service. If a site's response times fall below an acceptable threshold, these will send out alerts. Since these requirements are segmented, you'll be notified if mobile device access decreases but overall averaged access times stay acceptable.
The performance data is saved on the Pingdom server and can be analysed over time. This is important for identifying performance issues that may arise as a result of the addition of new pages or features. Marketers will benefit from it since they will be able to observe which pages draw the most visitors and where those visitors are coming from.
So, Which One You Choose???
If you're going to devote the time and resources necessary to create sophisticated applications, you should do everything you can to ensure that they function exactly as intended. Otherwise, you'll lose a lot of time producing something that frustrates users and makes achieving your goals that much more difficult.
There are a lot of strategies you can employ to improve the user experience, one of which is to use a RUM tool like Atatus RUM. Try it out to see if it suits your company requirements! You can try the software for 14 days for free to see how it works.
#1 Solution for Logs, Traces & Metrics
![]() APM
APM
![]() Kubernetes
Kubernetes
![]() Logs
Logs
![]() Synthetics
Synthetics
![]() RUM
RUM
![]() Serverless
Serverless
![]() Security
Security
![]() More
More