9 Best Application Performance Monitoring Tools on the Market and Why Should You Use One
The Application Performance Monitoring (APM) tools make managing your applications simple and easy, ensuring that your business software performs at its best. It's one thing to keep track of IT infrastructure and networks, but it's frequently the applications that demand the greatest care. It's not just the fact that there could be a lot of them; it's also the fact that they tend to update regularly, which can lead to software conflicts and unexpected hardware issues.
This is where APM software tools may help IT managers save time and resources by offering a single platform to monitor all applications instead of having to monitor and troubleshoot each one separately.
As a result, we've examined the best APM tools, which may be used not only for monitoring but also for general optimization as part of a larger IT strategy.
We will cover the following:
- What is Application Performance Monitoring?
- Why Should You Use One?
- Tips for Choosing APM Tools
- 9 Best APM Tools
What is Application Performance Monitoring?
Application Performance Monitoring (APM) is a software performance monitoring system. To fully manage and monitor an application's performance, a large number of different sorts of data must be collected and monitored. APM ensures that customers receive services to the specified level and identifies issues with application performance. Different categories, such as load time, application response time, and so on, can be used to monitor or track application performance.
Why Should You Use One?
APM is a single platform where you can monitor and manage all of your applications. An application performance monitoring tool ensures that your applications not only perform as expected or respond immediately, but also that they do so consistently. Your customers will be able to use your applications at any time of day. Maintaining a great user experience requires ensuring a consistent experience.
What happens if the number of people who use the application triples? What impact would this have on CPU, memory, and disc usage?
The use of an APM tool facilitates capacity planning. Being able to estimate performance depending on user load allows you to always provide a high-quality experience to your users.
Another reason for the importance of application performance monitoring tools is that they can handle a wide range of technologies, programming languages, frameworks, and integrations. This eliminates the need for your teams to use several, incompatible tools. Complex and dynamic applications are common in today's world.
APM tools can be used at any stage of the application development process, from development to testing to production, allowing teams to design and deploy higher-quality applications more quickly. Today's businesses rely on applications to generate revenue and grow. To provide a great user experience and drive the bottom line, the correct application performance monitoring solution is essential.
Tips for Choosing APM Tools
Traditionally, application performance monitoring tools were only available to larger businesses and were used by IT operations to monitor critical applications. They've been used for business transaction monitoring, as I like to call it. APM tools have become more inexpensive and essential for all companies in recent years. They are increasingly being utilized for application performance monitoring by developers, not just IT operations. APM is an essential element of the DevOps movement.
Platforms, operational systems, applications, networks, and other components make up your IT environment. The alignment between business goals and IT investments is more crucial than ever, which is why it's critical to not just identify, review, and evaluate multiple APM solutions inside your department, but also to have them audited by other departments, ensuring that the tool you choose matches the needs of your company.
Other key elements include:
- Pricing
- Plugins and integrations
- Support for emerging technologies
- Options for advanced alerting and reporting
- Global monitoring network
- Supported programming languages and frameworks (PHP, Java, Python, Node.js, Ruby, Laravel, Magento, etc.)
- Cloud support (Azure, AWS, Heroku, etc)
- SaaS vs On-premise
- Ease of use
A comparison of APM tools side by side should immediately highlight which feature sets are critical for your company. Your applications will most likely be accessible from everywhere in the world, using a variety of browsers, devices, and connection speeds. Finding an application performance monitoring tool isn't only provides real-time visibility into your websites, web services, infrastructure, and networks, but also comes with features that complement your monitoring purposes, such as performance testing, which is critical to developing and release a quality application.
9 Best APM Tools
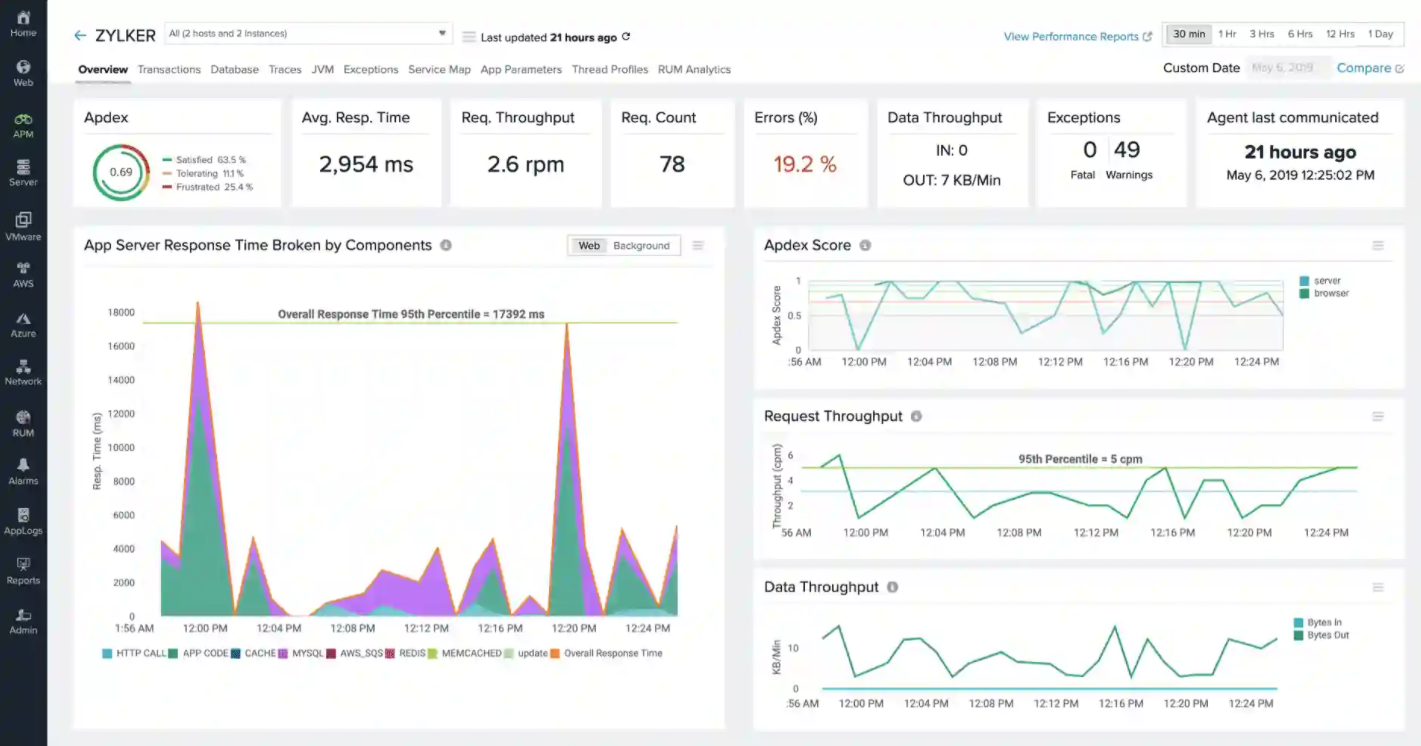
#1 Atatus
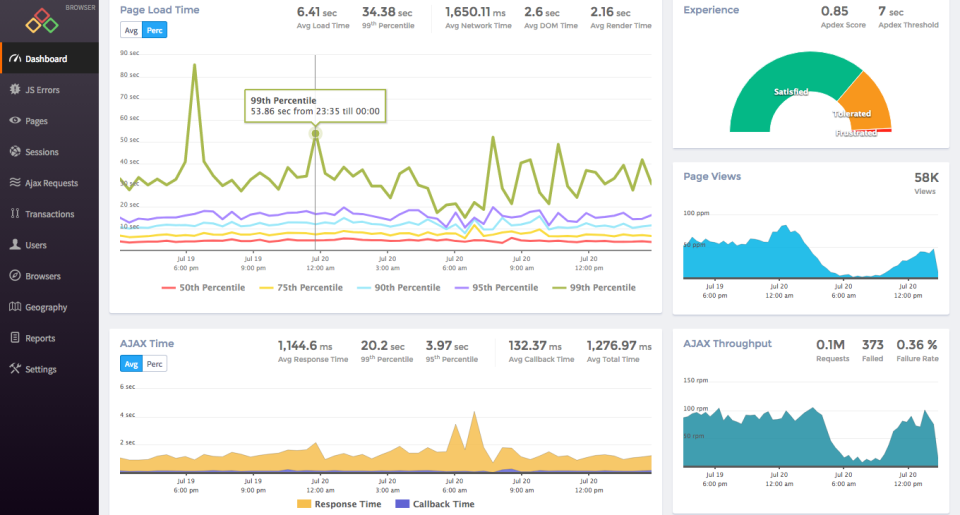
Atatus is a SaaS-based application performance management system that offers full transaction diagnostics, performance control, root-cause diagnosis, server performance, trace individual transactions in one place. Our platform can capture millions of performance data points across your applications in real-time, allowing you to quickly resolve issues and ensure digital user experiences. And it all happens in production, with the option of cloud or on-premise deployment.
With actionable information, Atatus makes application monitoring easy, allowing you to isolate and manage application performance issues holistically. You may receive a full overview of your requests and then drill down to uncover the slowest layers that are affecting your customers. So that you may use the histogram and percentiles, as well as the error rate, to troubleshoot request performance issues.
With in-depth diagnostics, you can see the broader context of each error and figure out exactly what went wrong and how to solve it. Stack trace, request parameters, environment, affected users, host, and more are all available in one location. You can also add deployment markers to track how your customers are reacting to the most recent code release by viewing the performance of your application before and after deployment, including a list of slower requests, new errors, and more.
#2 Dynatrace
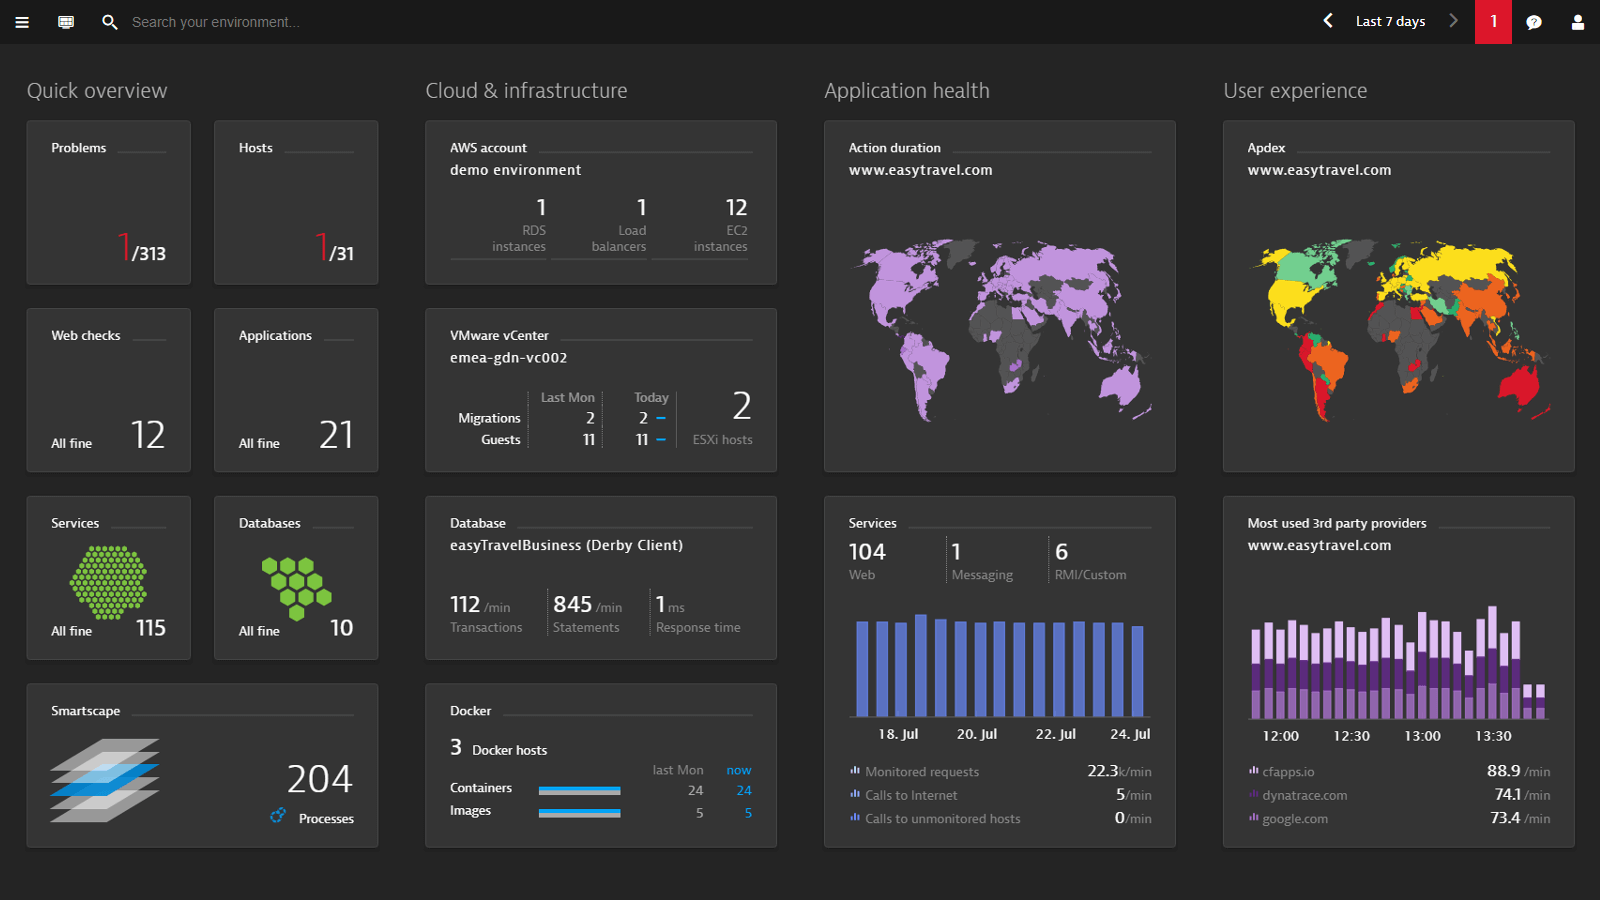
Dynatrace specializes in cloud-based systems and web enterprise support software. The software can be installed in-house or accessed over the cloud. Even if you use the system online, you must still install a component known as OneAgent. This is the data-gathering monitor that sends information to the analytical engine, which might be located on your server or controlled remotely.
With one package, Dynatrace provides Cloud infrastructure, while another package includes applications, hosts, and services for in-house systems. Apart from that division of service, the software isn't provided as specialized modules, therefore the application performance management system includes infrastructure monitoring and user experience tracking.
The Dynatrace approach examines the performance of your application from two perspectives. One perspective focuses on delivery mechanics, which extends down into infrastructure performance and generates metrics on application execution throughput. The other perspective is user experience. Each visitor is tracked by the software, which evaluates application usage and response times every session.
#3 New Relic
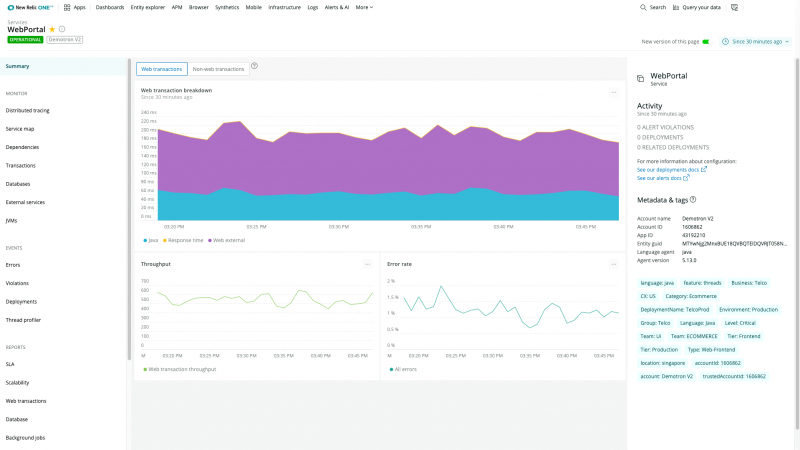
New Relic system is an online service, and if your infrastructure includes Cloud services, the monitoring software will work in unison with them. All of your internet traffic, including traffic from mobile applications, is monitored by the APM. This service is designed specifically for online enterprises like information websites and online marketplaces.
The tool can aid with application migration from on-premises servers to cloud services, as well as managing the launching of new products or updating existing online services. Encryption and user authentication are used to protect data transfers to New Relic's Cloud server as well as data storage.
The dashboard provides a number of graphics to assist you in quickly discover issues and performance successes. The application monitoring display contains all of the essential information such as response times, throughput metrics, and error rates will be displayed as both figures and time-sampled graphs.
#4 AppDynamics
AppDynamics is aimed at larger businesses and offers both a SaaS and on-premise APM solution. The service's dashboard is quite busy, focusing on your applications and the services that support them. Another version of performance data follows user cases to indicate delivery speed and demand for your company's various services and applications.
In a real-time monitoring display, the application stack map explains the performance trends of all active applications on your system. The services that support those applications are also mentioned, and difficulties with those supporting systems may reveal status issues. These concerns with the underlying infrastructure would require a different monitoring package to evaluate.
The software continuously monitors your application and collects historical data, allowing it to establish a performance baseline. If it performs poorly, this alone may cause you to make modifications to your capacity provision. If everything seems OK at the baseline, you can move on to the diagnostic tool to see if the applications run smoothly 24 hours a day, seven days a week. This is an excellent tool for both business analysis and application performance monitoring.
#5 Datadog
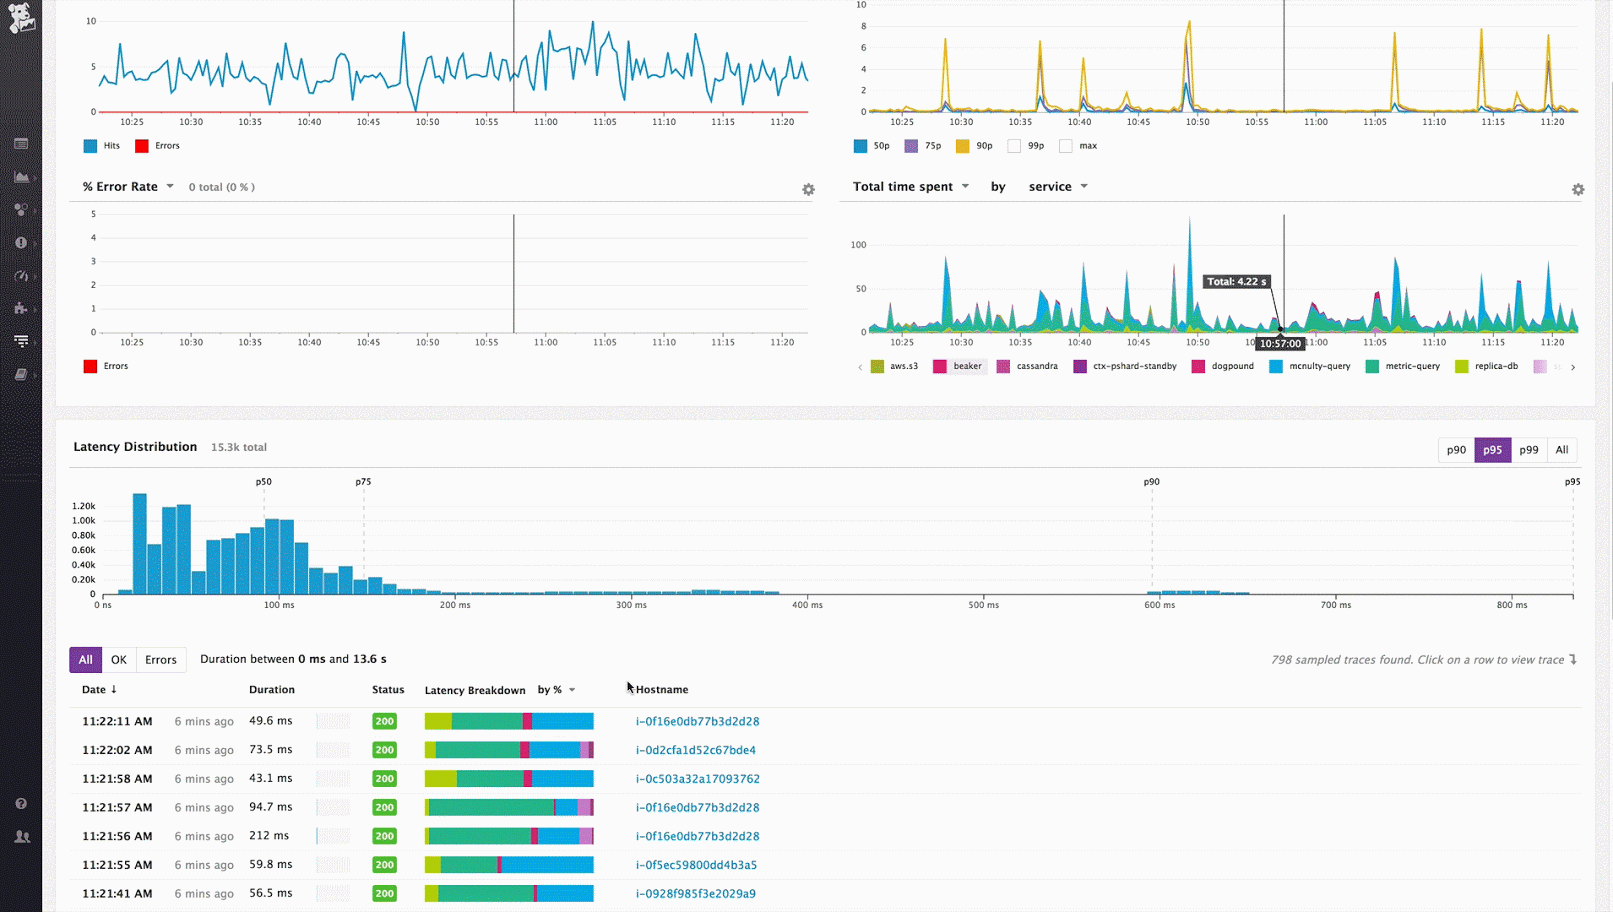
Datadog provides cloud-based infrastructure, application, and event log monitoring. It tracks every request for an application and monitors its delivery by looking at events all the way down the application stack. An alert is triggered if any irregularities arise during the application's delivery. Those notifications will build, and you'll be able to observe in real-time in the dashboard which application is having issues and which service appears to be the source of the issue.
You may personalize the dashboard and even assign various views to various team members. You may also integrate aspects of the dashboard into your own corporate system monitoring sites. The ability to interface Help Desk software with Datadog eliminates the need for support workers to transfer between applications in order to link human error reporting with automated notifications.
#6 Retrace
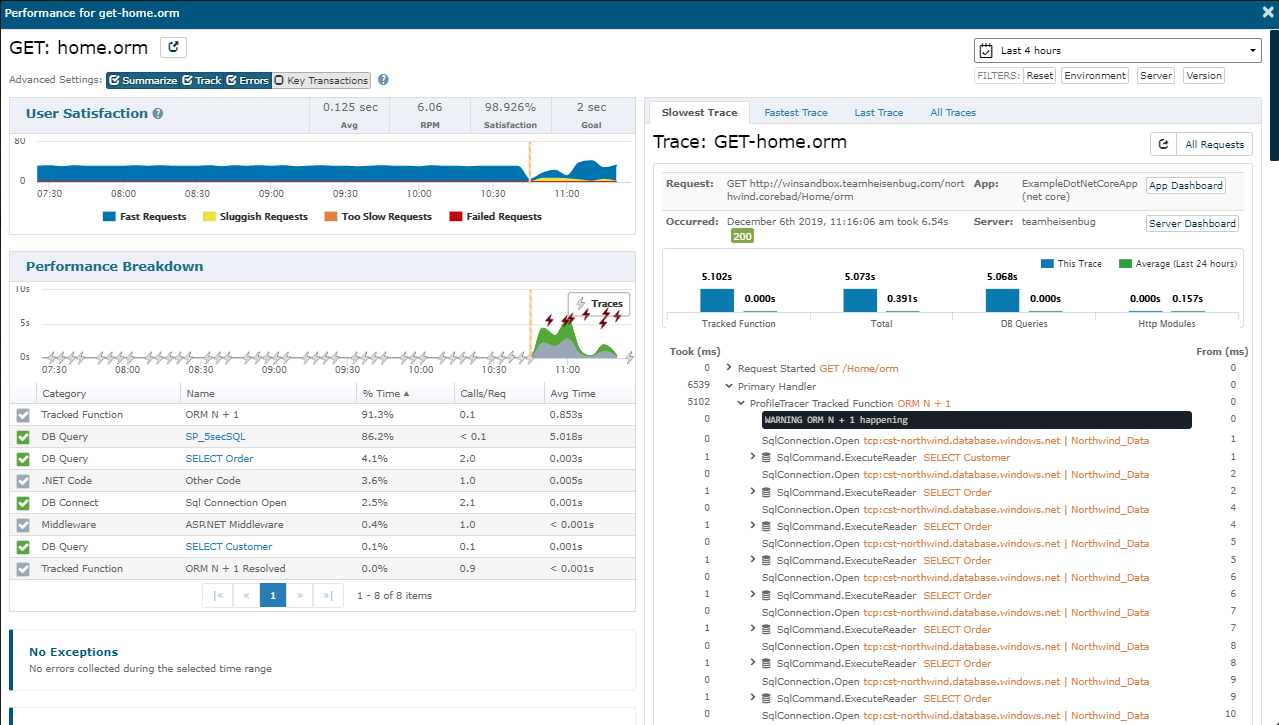
Stackify Retrace is a tailored ‘devAPM' system that provides development professionals with the tools they need to efficiently detect and resolve issues. The platform notifies developers when problems and issues are discovered, and it can be used to boost speed on test and production servers.
Retrace is built to give you visibility, data, and actionable insights about your application's performance and issues. When problems occur, alerts are sent to a variety of locations, including email, SMS, and Slack. The code performance and analytics, as well as errors and logs, are displayed on a single dashboard.
Stackify is also compatible with the majority of common application stacks, and it's a highly scalable SaaS solution that's simple to set up and use.
#7 Loupe
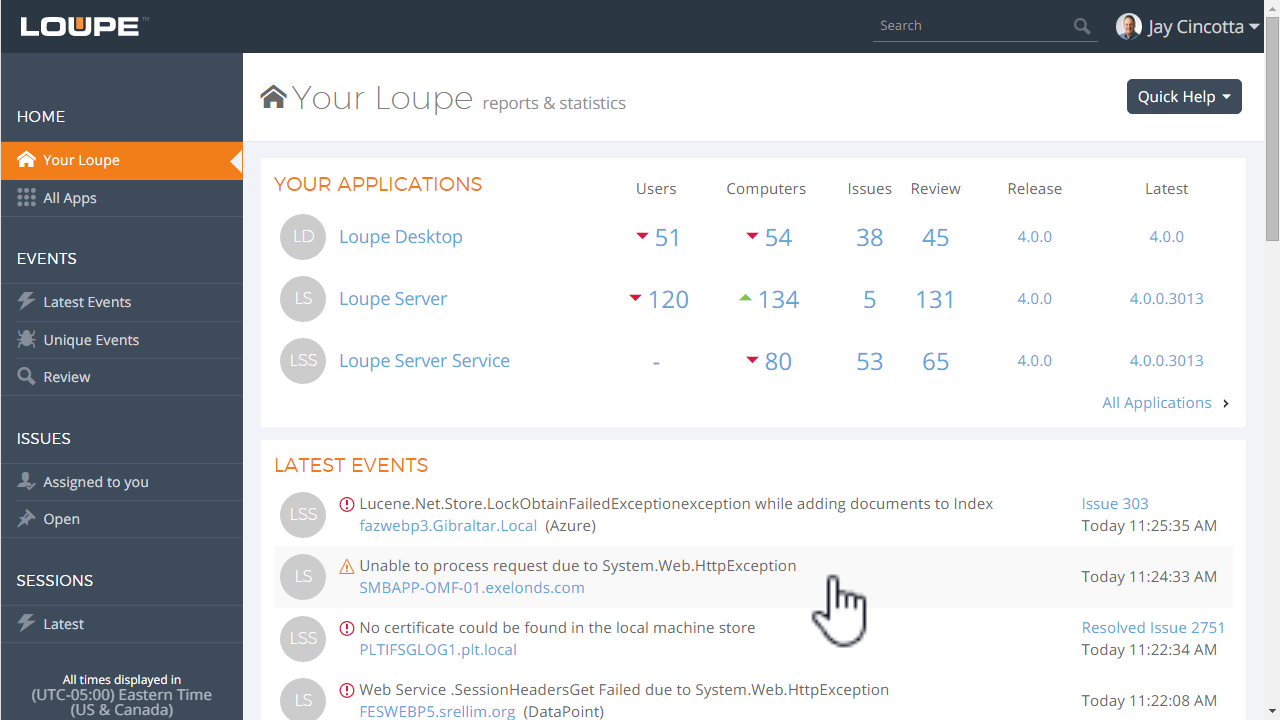
Loupe is a simple APM tool that can be installed in your own data centre or given as a SaaS solution in the cloud. The platform integrates with a variety of tools in your tech stack and records telemetry to give you the most relevant data to quickly resolve issues.
Loupe covers all of the essentials you'd expect from an APM suite, although it doesn't handle as many applications like some other APM solutions. Automatic grouping of your log events is one of the most useful tools, as it saves you time hunting for the source of an issue. There's also a fantastic web client that allows you to access your data from any computer or device.
#8 Site24x7
The Site24x7 Application Performance Monitoring platform is a cloud-based monitoring solution for analysing the performance of applications running on a variety of platforms. Since the tool is managed remotely, it can analyse applications running on any platform, including cloud servers and mobile devices.
You can dive down to the exact line of code and identify the needle in the haystack with Site24x7 APM Insight. This low-level analysis allows you to figure out why a program method or function call is taking so long, as well as identify potential bottlenecks. Databases are included in performance analysis.
The tool assists you in identifying delayed queries and determining which supporting service is to blame. You can also get real-time transaction analytics and reports for various time periods. You can set performance alerts or allow Site24x7 to figure out appropriate threshold levels for you using machine learning and AI. You can also look at how users feel about your online services from a variety of perspectives.
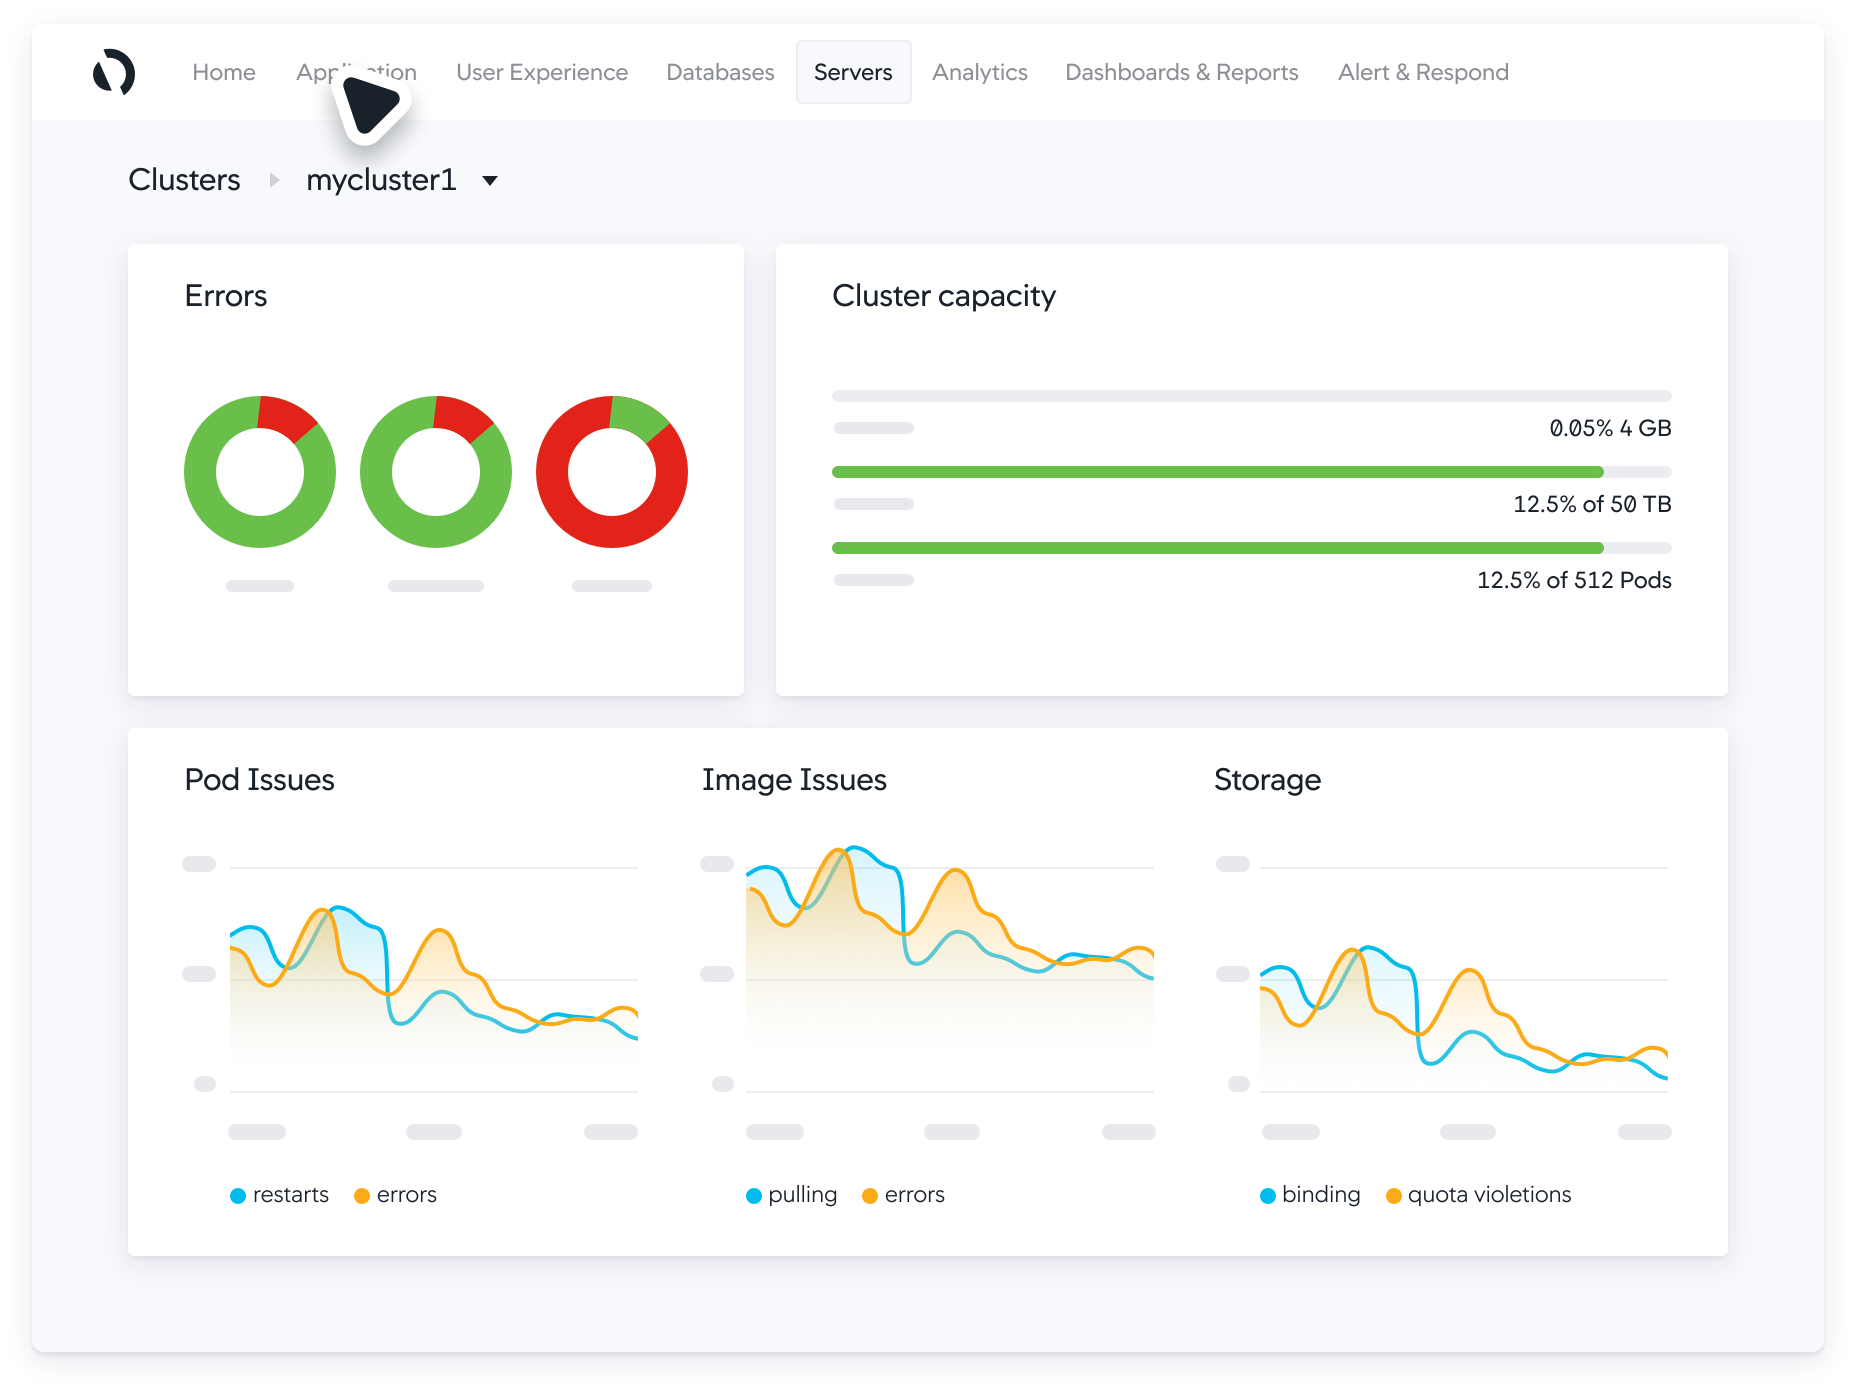
#9 Instana
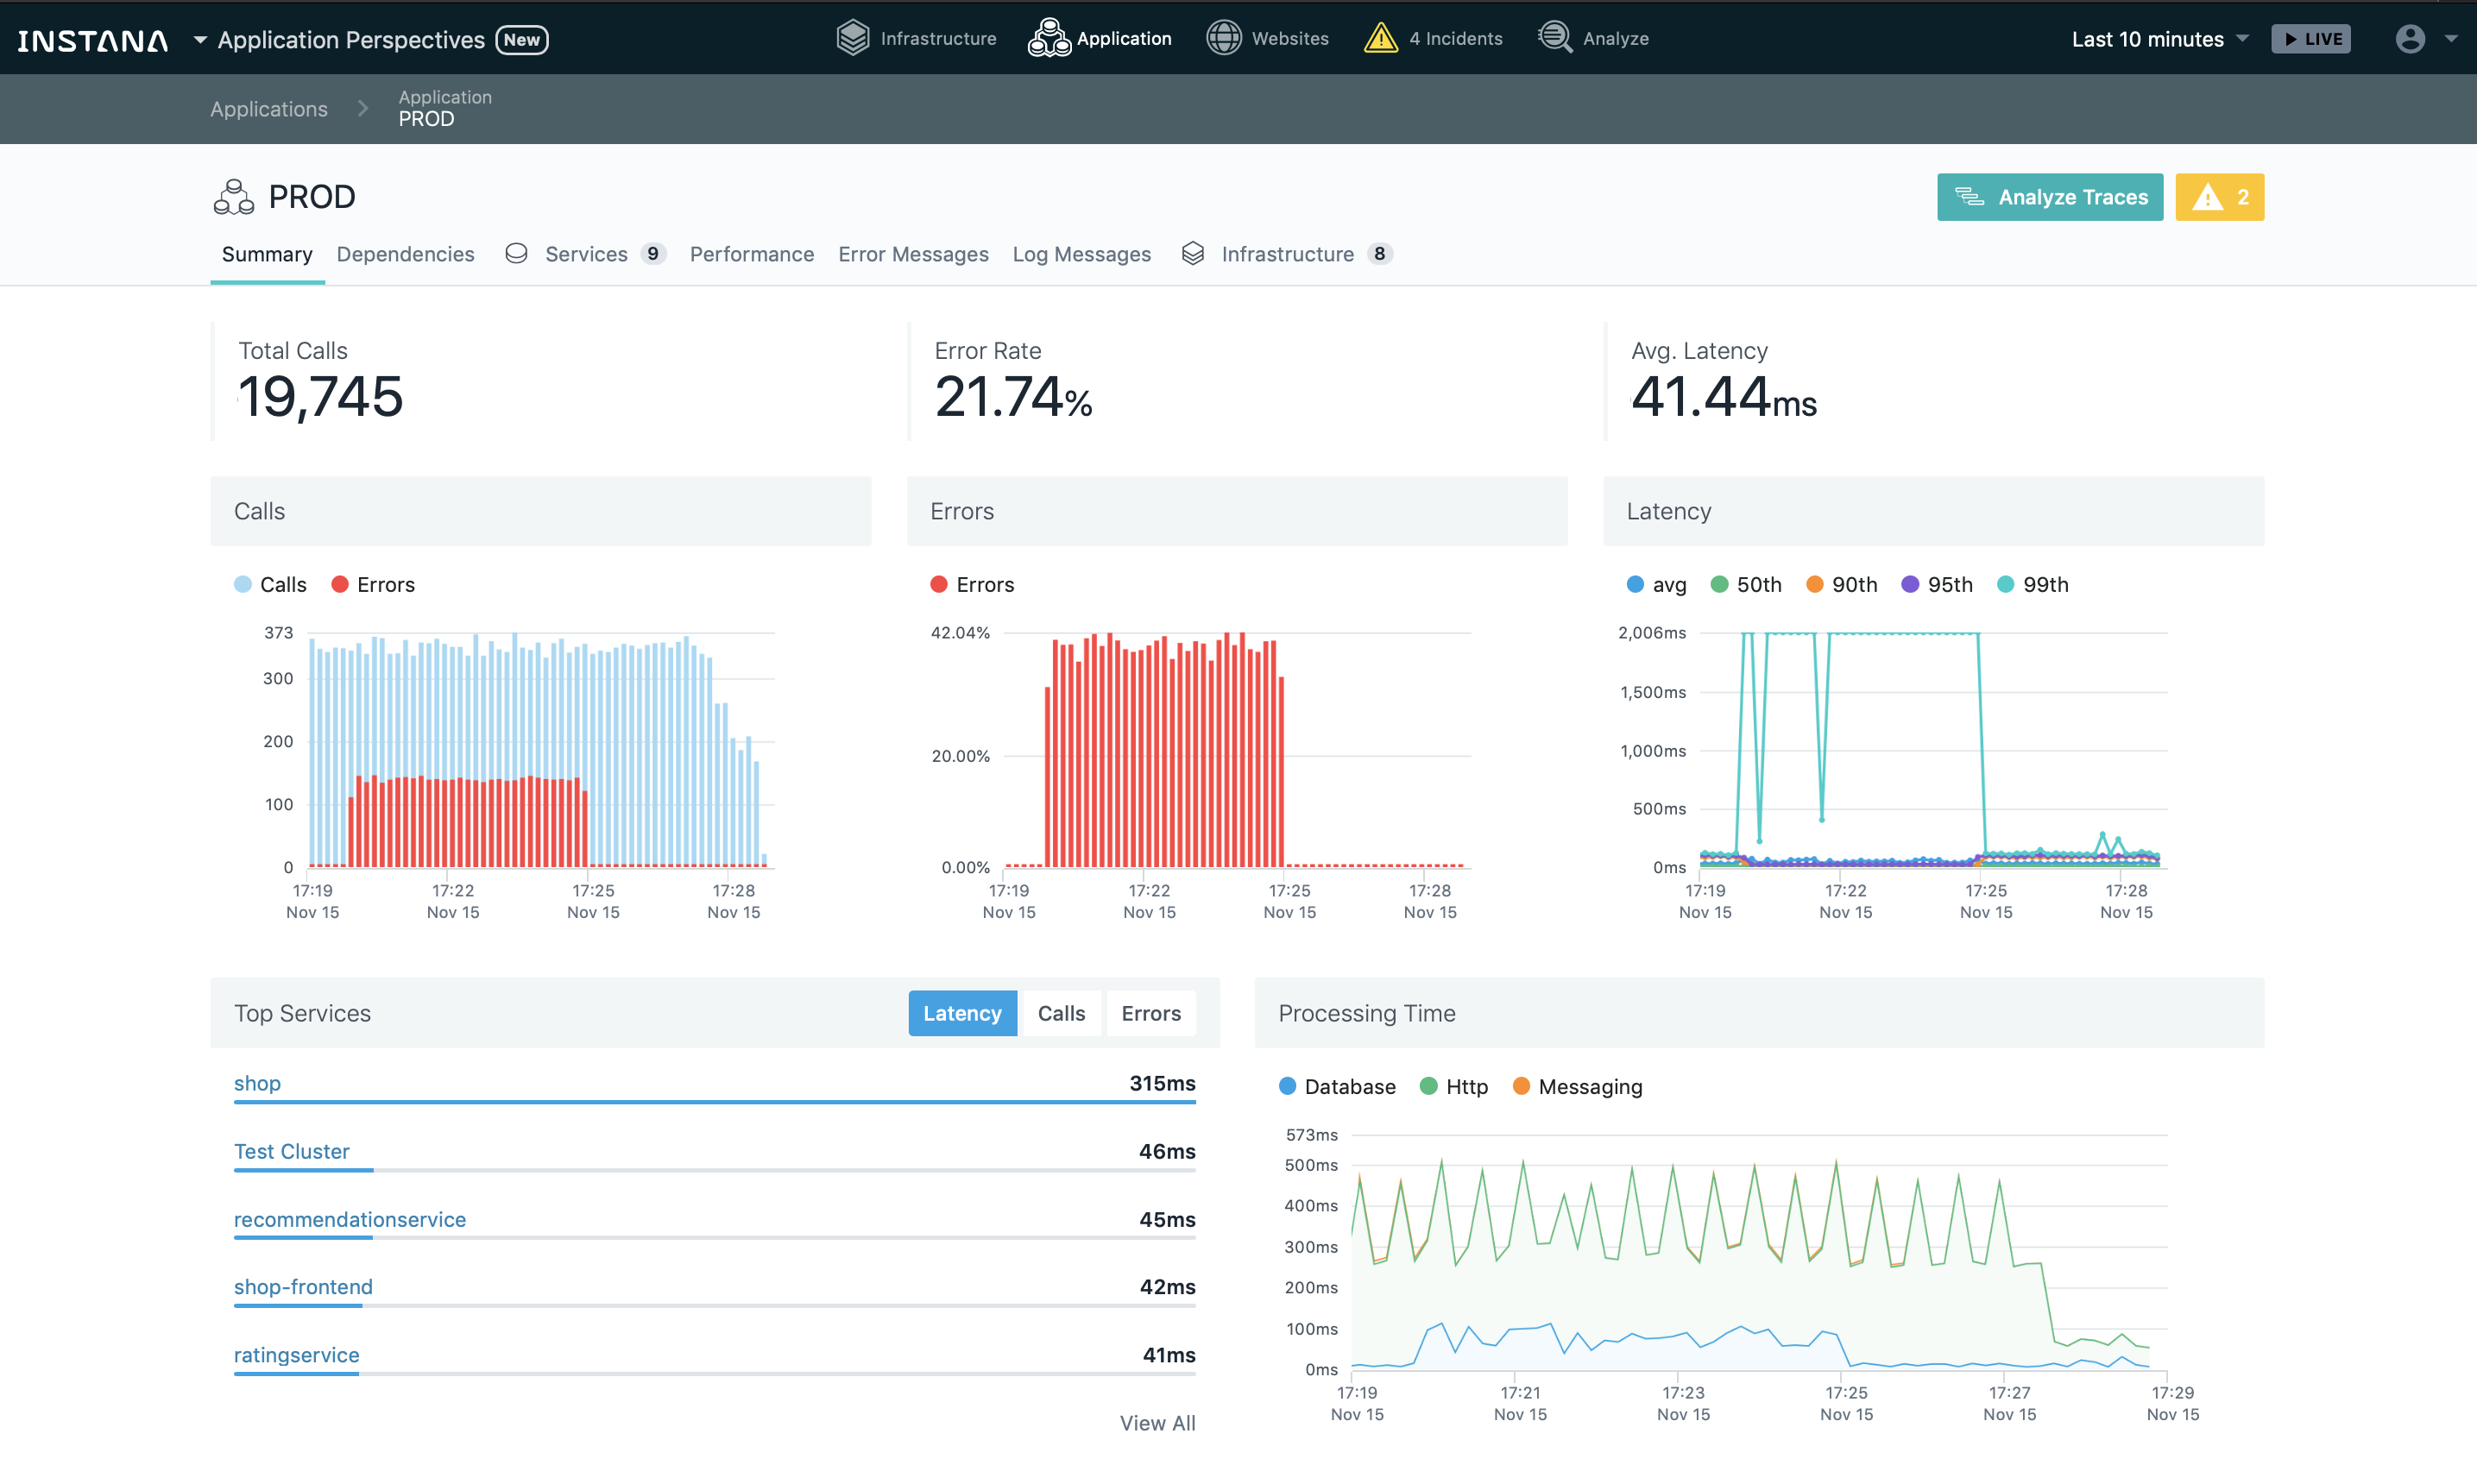
Instana is a completely automated application performance monitoring system with service, infrastructure, container, and website administration capabilities. For total visibility, the solution provides continuous full observability of all server and application components, as well as automatic distributed tracking. It offers application views, which logically aggregate application components, services, and transaction requests for analysis, visualization, and alerting via user interface configurations.
Instana's software solution is designed specifically for monitoring and managing the performance of software used in microservice architectures, and it allows for 3D visualization of performance via graphs generated using machine learning algorithms, as well as automatic performance notifications. Instana's APM solution is primarily intended for monitoring software used in "container orchestration," which is a modular technique of offering software services.
Finally!!!
Application performance management is a critical role for the IT department, regardless of the type of organization. Customers' only contact with a company is through the applications in online businesses, so application performance must be assured. Application performance is still a critical component of the IT system for all other sorts of businesses, and preventing difficulties will keep the company going and reduce the number of Help Desk calls.
#1 Solution for Logs, Traces & Metrics
![]() APM
APM
![]() Kubernetes
Kubernetes
![]() Logs
Logs
![]() Synthetics
Synthetics
![]() RUM
RUM
![]() Serverless
Serverless
![]() Security
Security
![]() More
More


![New Relic vs Splunk - In-depth Comparison [2025]](/blog/content/images/size/w960/2024/10/Datadog-vs-sentry--19-.png)
![New Relic vs Sentry - Which Monitoring Tool to Choose? [2025]](/blog/content/images/size/w960/2024/10/VS--1-.png)