11 Best Bugsnag Alternative You Should Try
It's going to be challenging to choose the best Bugsnag alternatives for error monitoring. Many software providers might make it hard to identify between their features, pros, and cons. Let's look at the top 11 alternatives to Bugsnag to see how we can make this process go more smoothly.
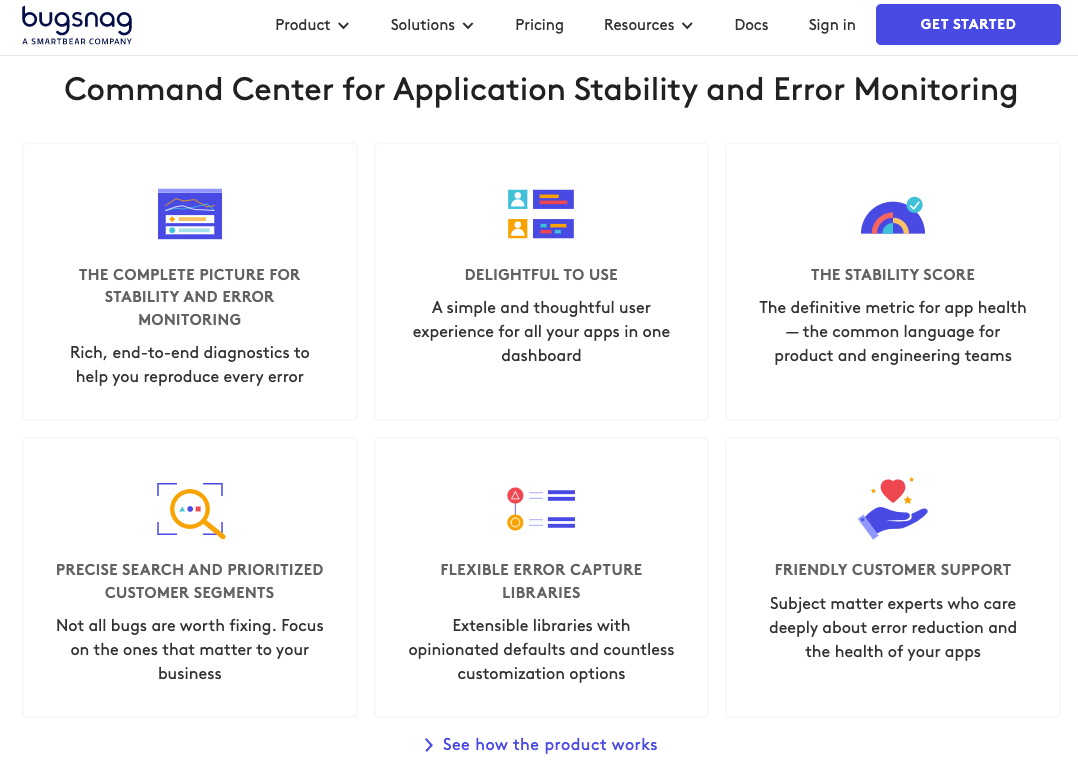
Bugsnag is a stability error monitoring solution that captures unhandled exceptions, diagnostic data, and version information in the browser, mobile, and server-side applications via open source SDKs for 50+ software platforms.
By default, Bugsnag libraries capture all crashes (handled exceptions are optional), version numbers, and session information to help engineering teams proactively surface issues and save time fixing bugs.
Besides capturing key diagnostic data (including stack traces, breadcrumbs, environment info) with crashes, custom diagnostics (such as A/B testing variants or customer tiers) can be added to error reports.
Bugsnag is an error-monitoring tool that allows your developers to identify, prioritize and replicate bugs in a time-efficient and enjoyable manner.
It creates an ownership mentality with all developers by enabling them to proactively see the effects of their code. This helps them address the issues before they escalate, creating a joyful experience for both customers and engineers.
It is created to help developers take full ownership of the code they ship, while at the same time creating an enjoyable experience when fixing errors.
Though it offers tons of features, it is still only an error tracking solution but does not offer an application performance monitoring facility.
Here is a list of better bugsnag alternatives:
#1 Atatus
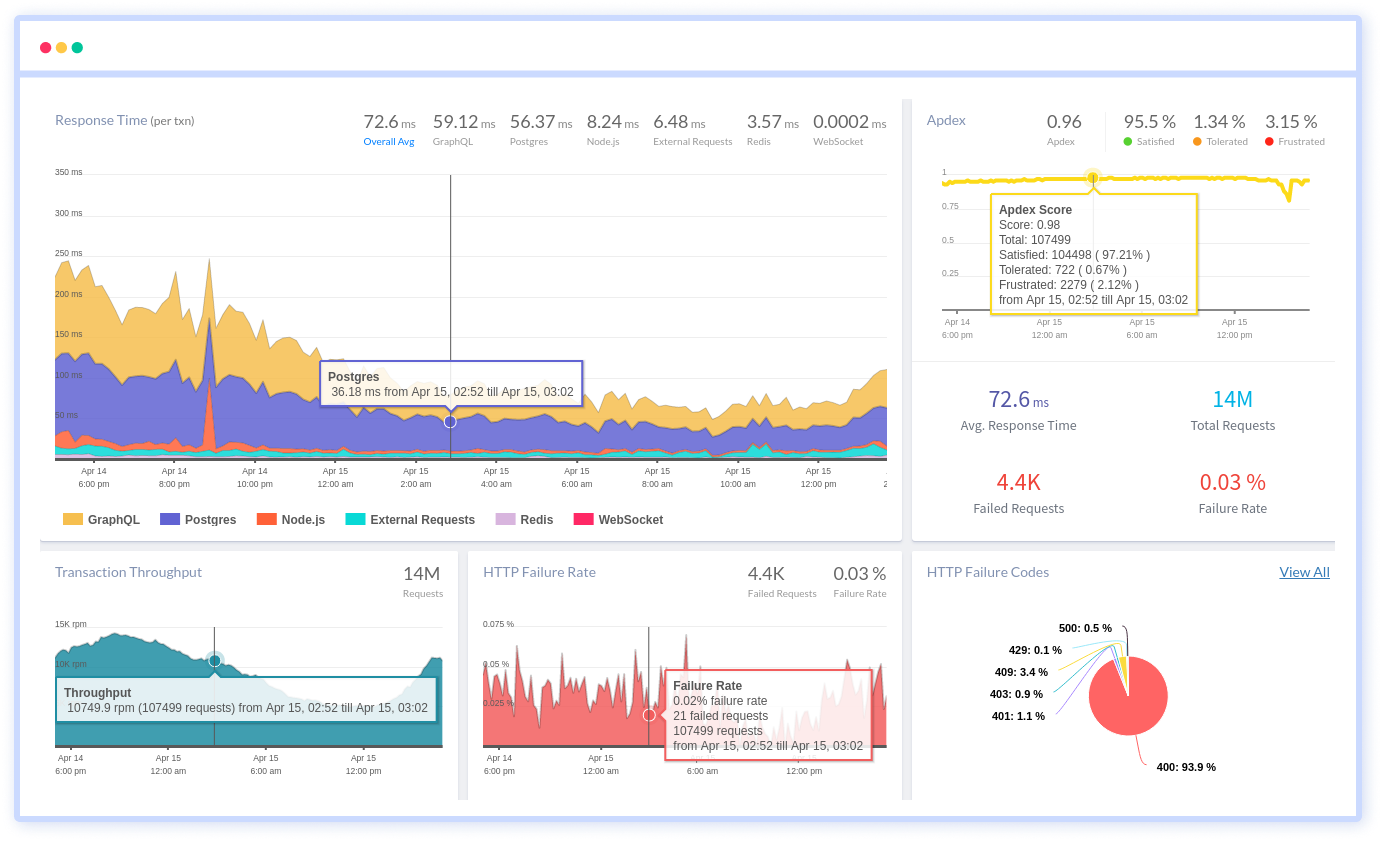
Atatus is considered to be one of the best bugsnag alternatives. It is a SaaS-based application performance management that provides full-stack visibility for all of your applications and servers.
It allows you to collect millions of performance data points across applications in real-time, allowing you to quickly fix problems and improve digital customer experiences.
Also, with cloud or on-premise deployment flexibility, such things happen in real-time. You can optimize end-user performance by understanding the complicated frontend performance issues caused by slow page loading, delayed static assets, and ajax queries using Real User Monitoring.
You can also keep track of JavaScript issues that have an impact on your customers' experience.
You can assess your backend performance and analyze transaction traces, slow database queries, and external calls to other services with Application Performance Monitoring (APM).
PHP, Node.js, Java, Ruby, Python, and React are all supported by Atatus. Atatus has 4.8 / 5 stars in g2.
#2 Datadog
Datadog is a monitoring and analytics tool for information technology (IT) and DevOps teams that can be used to determine performance metrics as well as event monitoring for infrastructure and cloud services.
The software can monitor services such as servers, databases, and tools. Datadog monitoring software is available for deployment on-premises or as software as a service (SaaS).
Datadog supports Windows, Linux, and Mac operating systems. Support for cloud service providers includes AWS, Microsoft Azure, Red Hat OpenShift, and Google Cloud Platform.
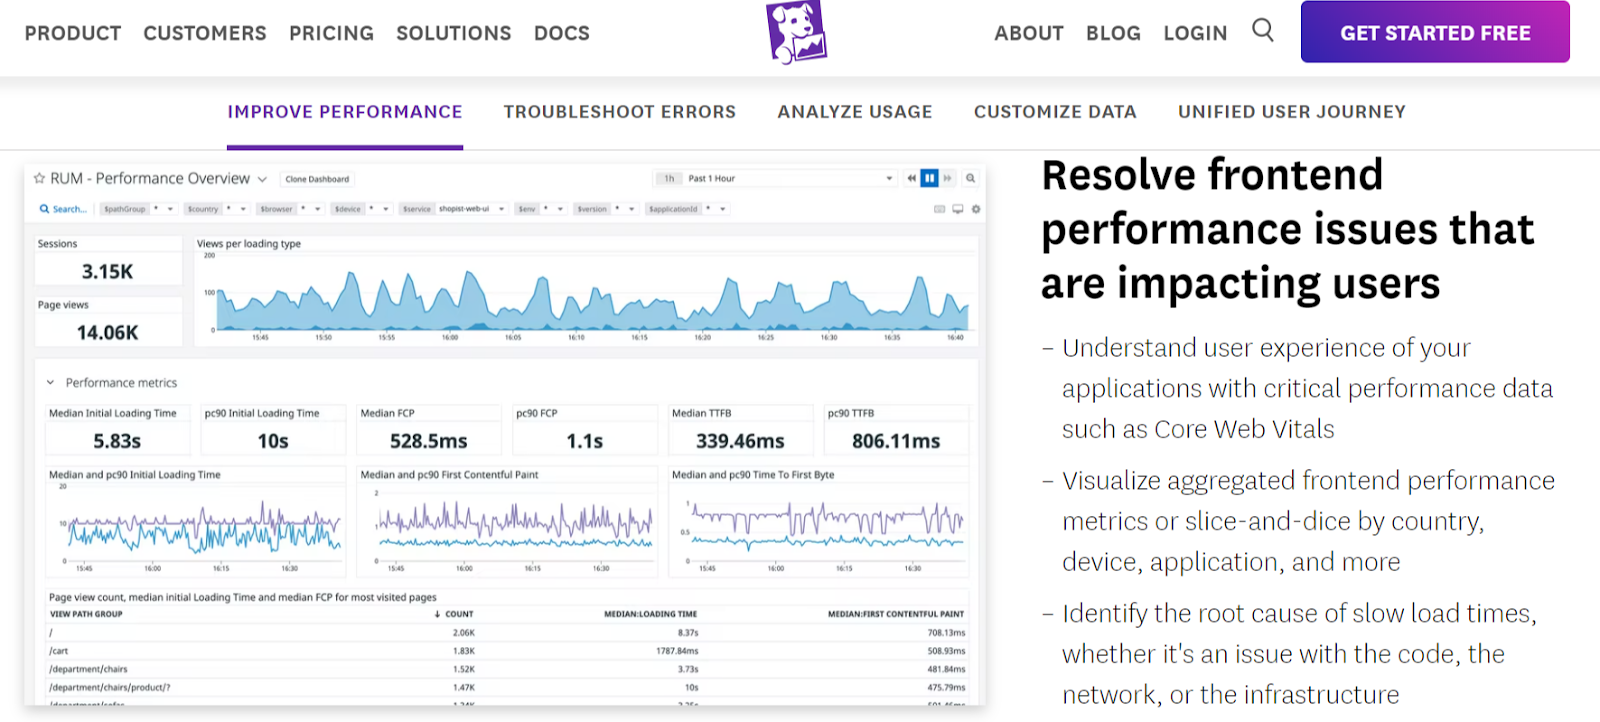
It provides an IT/DevOps team with a single view of their infrastructure (including servers, apps, metrics, and other services).
It allows for access to the API. Dynatrace supports applications written in languages such as Java, Python, PHP, .NET, Go, Node and Ruby. It has 4.2 / 5 stars on g2.
#3 Dynatrace
Dynatrace is a performance monitoring tool that assists users with proper performance monitoring, ensuring consistent availability throughout the system.
The tool is fast and reliable and uses many digital applications to stay relevant to technology.
Any single transaction is monitored and logged so that they have a trace of any end-to-end transaction from browser to database.
The infrastructure is also monitored. Whenever a performance issue arises, the tool checks the servers, databases, and codes to find the underlying cause.
Dynatrace cannot be easily understood due to its complex nature and has more developed technology within it. This is considered a pure application performance management tool.
APM tool checks the performance and monitors them on a large scale for applications with end-to-end transaction details provided. All these details are stored on a server. It has 4.5 / 5 stars on G2.
#4 Trackjs
Production error monitoring and reporting for web applications. TrackJS is another one of the best Bugsnag alternatives that provide deep insights into real user errors.
See the user, network, and application events that tell the story of an error so you can fix them.
More than just an error the Telemetry Timeline shows the user, network, and console events that preceded an error, like an airplane's Black Box for your webapp.
Compare the hits and errors for your webapp over time. See if a recent change is causing failures, and where to prioritize debugging.
More than just an error. Compare the hits and errors for your webapp over time. See if a recent change is causing failures, and where to prioritize debugging. It has 4 / 5 stars on G2.
#5 Raygun
Use Raygun to track, manage, and report your software errors. Raygun gives you a window into how users are experiencing your software applications.
Detect, diagnose and resolve issues that are affecting end users with enhanced speed and accuracy.
It has an error, crash, and performance monitoring, in one platform. It supports every major programming language and platform. It has 4.4 / 5 stars on g2.
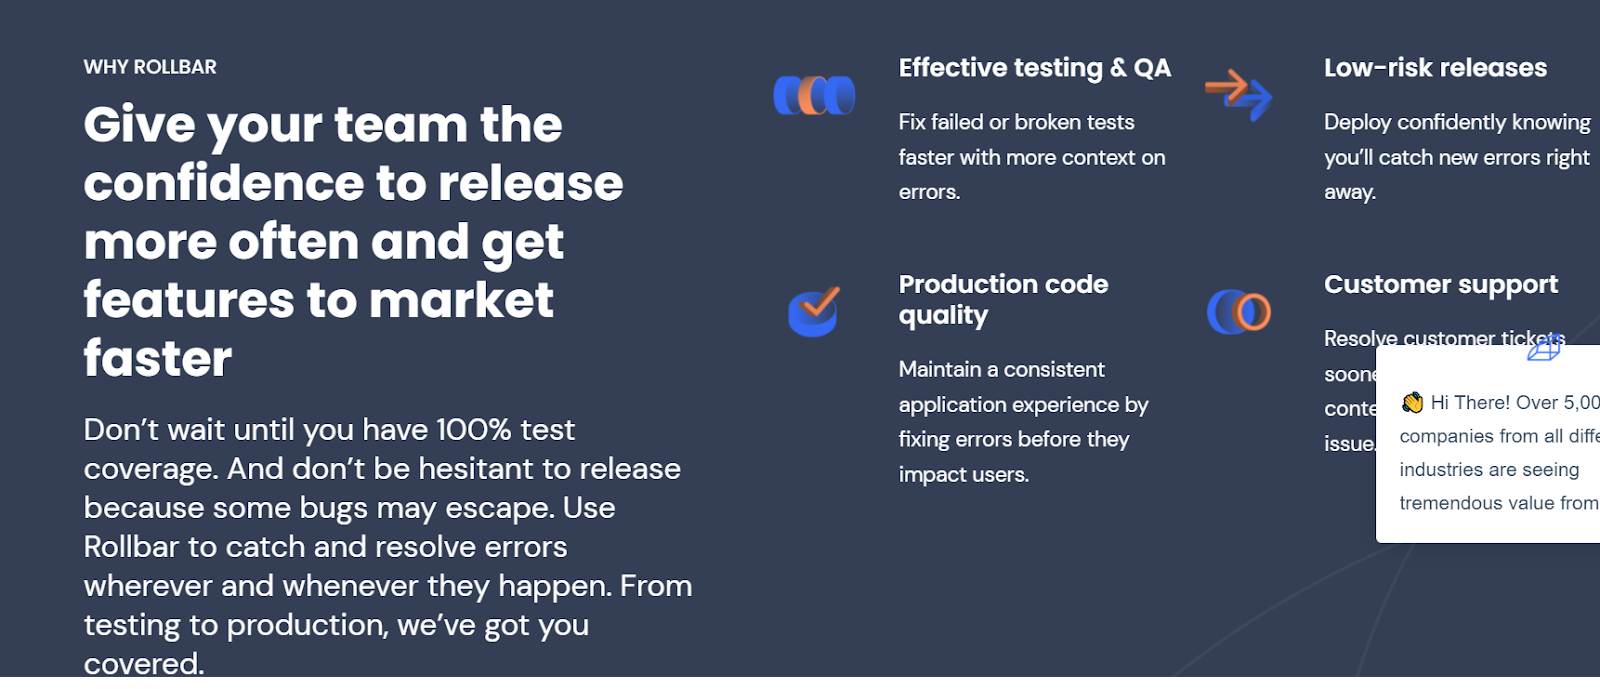
#6 Rollbar
Rollbar is a cloud-based bug tracking and monitoring solution that caters to organizations of all sizes.
Rollbar supports multiple programming languages and frameworks like JavaScript, Python, .NET, Drupal, WordPress, and Pyramid.
The solution can also be deployed on-premises at the user end. Rollbar provides automatic error grouping based on an error root cause and also gives users the option to customize these grouping rules.
Notification filters help users to set and prioritize notifications by error type. The solution also offers workflow control capabilities that allow users to tag issues as active, resolved, or muted.
Our platform automatically groups similar errors to reduce noise and give you trustworthy alerts. Say goodbye to all the false or missed alarms.
Our industry-leading Automation-Grade Grouping uses machine learning to regularly identify relevant patterns to keep up with continuously changing stack traces — something hardcoded grouping algorithms can’t do. It has 4.5 / 5 stars on G2.
#7 Appoptics
SolarWinds® AppOptics™ is a simple, powerful, and affordable SaaS-based infrastructure & application monitoring tool for custom on-premises, cloud, and hybrid systems.
By enabling quick identification of performance problems across the stack from the application, to underlying infrastructure, down to the line of code, AppOptics helps reduce MTTR. Its website performance monitoring the vital reason SolarWinds is listed in the Bugsnag alternatives.
AppOptics enables you to align infrastructure and application performance objectives side by side with business objectives.
AppOptics was thoughtfully designed for simple setup and use by all IT professionals with powerful features to quickly and automatically pinpoint performance issues removing the guesswork from troubleshooting. It has 4.2 / 5 stars on G2.
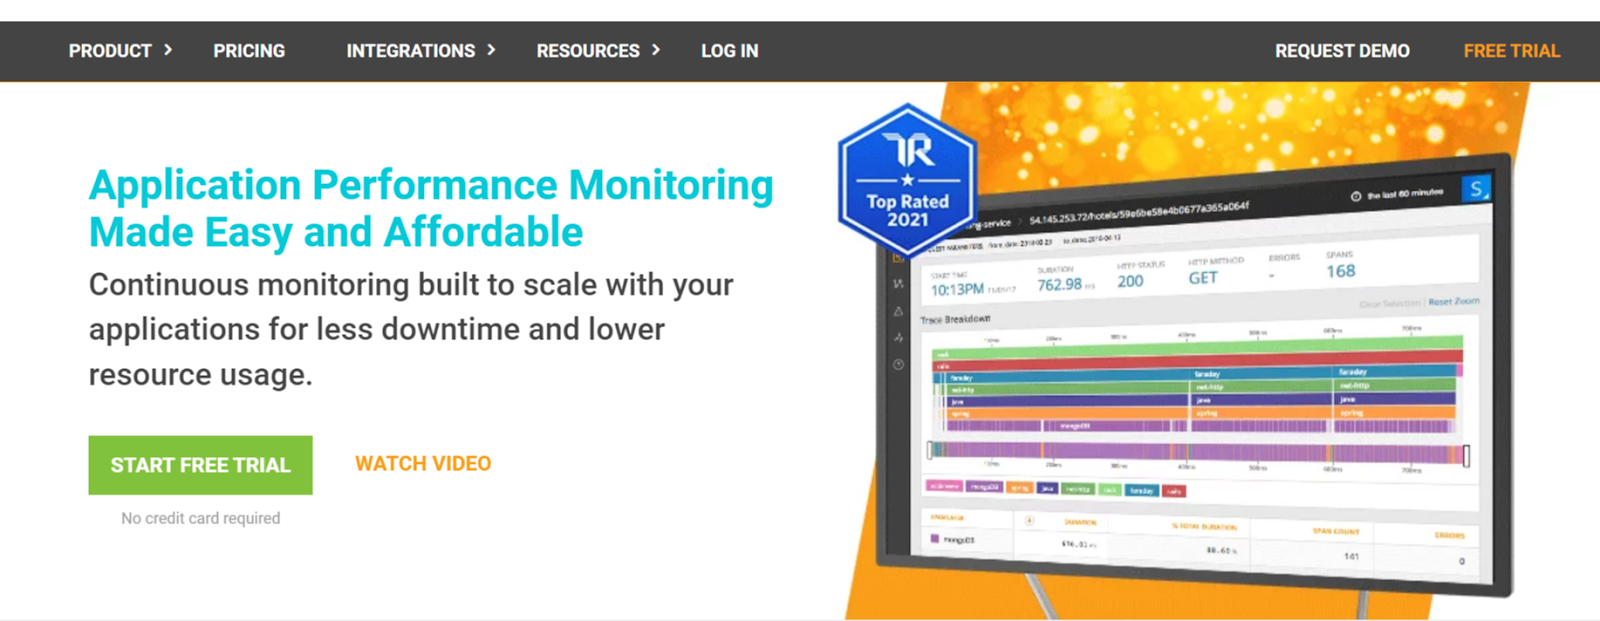
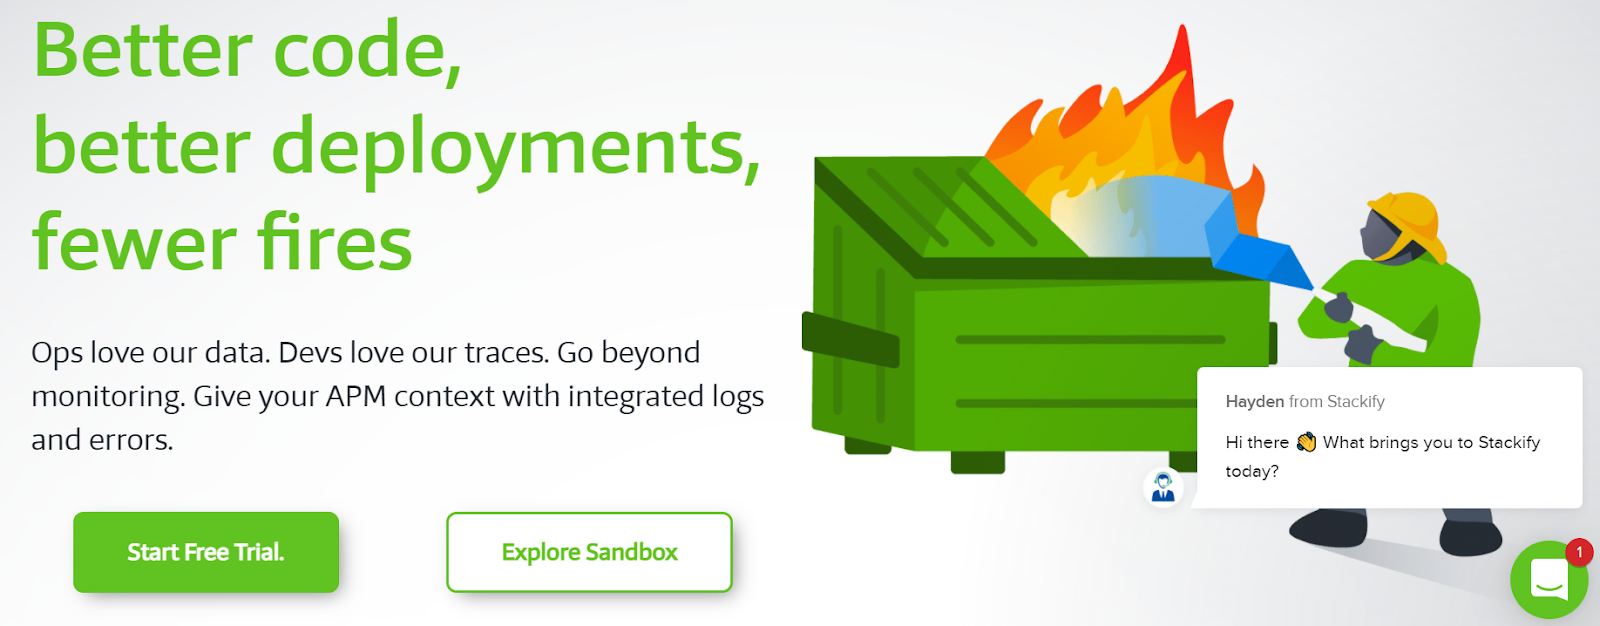
#8 Stackify
Developers can access their applications, servers, and databases through Stackify, regardless of where they are deployed.
Developers don’t have to log into the servers to grab information (usually they don’t have access or permission).
Stackify allows them to access everything they need to support and troubleshoot the applications that they create.
Besides, it also revokes production access to people who currently have too much access to any application, server, or system. It is hosted on the Windows Azure platform and requires a data collector during installation.
This data collector performs application discovery, server monitoring, file access, and other data collection needed for Stackify to operate.
There are a few requirements for it to work. For example, you must have a Stackify server installed. Next, Stackify software connects from your location via SSL, without any firewall changes required.
Next, it will install a simple data collector at each of your data center locations on one server. Finally, the installation process requires a lightweight service on each Linux server that exposes the interfaces. It has 4.2 / 5 stars on G2.
#9 New Relic
New Relic is a Software as a Service offering that focuses on performance and availability monitoring. It uses a standardized Apdex (application performance index) score to set and rate application performance across the environment in a unified manner.
New Relic is an observability platform that helps you build better software. You can bring in data from any digital source so that you can fully understand your system and how to improve it.
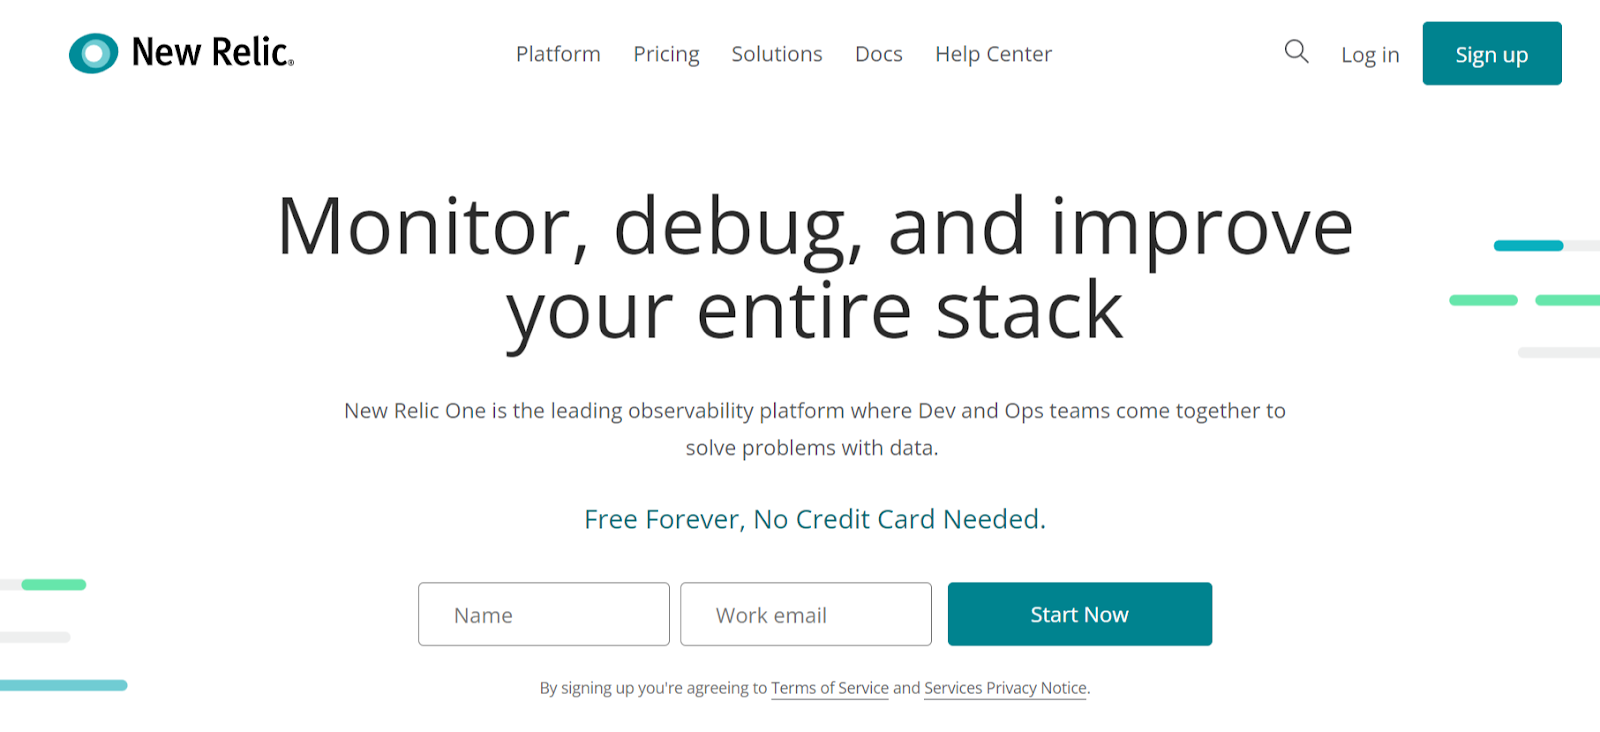
It instruments everything and imports data from across your technology stack using our agents, integrations, and APIs and accesses it from a single UI.
It helps to get all your data at your fingertips to find the root causes of problems and optimize your systems. Build dashboards and charts or use our powerful query language.
New Relic supports several application runtimes. This scenario uses a simple microservices-based online store example to demonstrate how to install the New Relic agents and monitor application behavior. It has 4.2 / 5 stars on G2.
#10 Appdynamics
AppDynamics, itself, is designed to manage the operations and performance of the applications available. As we don’t know the application’s capacity and the working range, it is difficult to assess the app performance.
Here, AppDynamics helps identify and manage the working of applications in the cloud environment and on the servers. The availability of the applications, along with their working range, is also notified with AppDynamics. It is one of the best Bugsnag alternatives to consider if you decide to look for it.

The complex environment is generally difficult to manage and scale. AD allows enterprises to monitor, analyze, and optimize the environment to any extent needed so that it is understood by the people who manage the application.
They will not need any external help if any issues occur in the application. Also, it is very difficult to understand the working of an application in the cloud environment as it works by taking input from different servers.
AppDynamics is effective at managing applications in the cloud environment. It has 4.3 / 5 stars on G2.
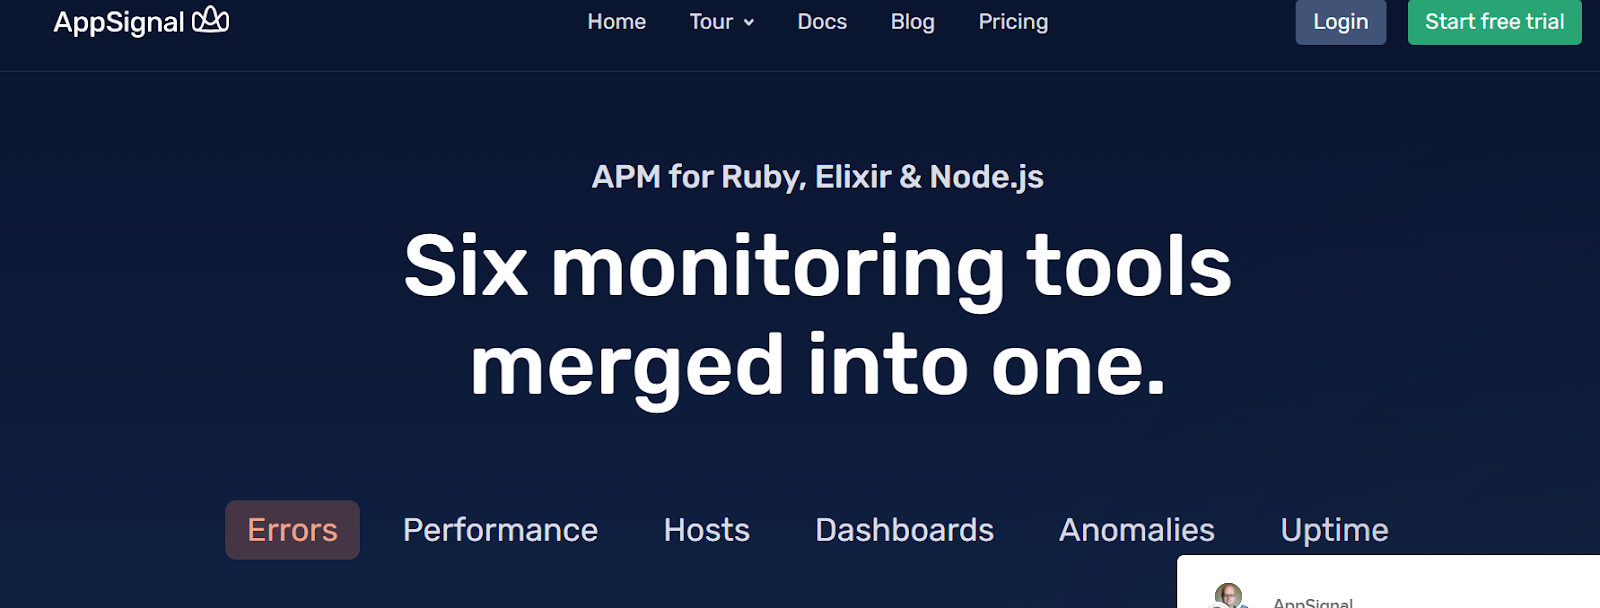
#11 Appsignal
Monitoring for Ruby and Elixir. By developers, for developers. AppSignal gives you and your team alerts and detailed metrics about your Ruby or Elixir application. Sensible pricing, no aggressive sales & support by developers.
AppSignal belongs to the "Performance Monitoring" category of the tech stack, while Sentry can be primarily classified under "Exception Monitoring".
It catches errors and makes sure they happen again. App signal keeps your team focused on building high-quality apps. Get alerts in real-time when your application is down.
It finds performance issues before you and collects metrics and visualizes with a few lines of code. It has 4.7 / 5 stars on g2.
Wrap Up
There are plenty of Bugsnag alternatives on the market from which to choose. Almost all of these tools have improved on the areas where Bugsnag fails to perform.
All of the above tools are easy to set up, offer plenty of features, and require very low technical expertise to manage. Some of these Bugsnag alternatives might even show you new ways of managing error monitoring in your applications.
Choosing an appropriate error monitoring tool from the ocean of competent and competitive tools requires deliberate reconnaissance and careful decision-making. There is rarely a one-size-fits-all solution in such cases.
So what works in one project might not fit others, and vice versa. Therefore the best way to find the perfect tool for yourself is to conduct a thorough analysis of your requirements and research the market’s offerings. Hope this article will enable you to make the final choice.
#1 Solution for Logs, Traces & Metrics
![]() APM
APM
![]() Kubernetes
Kubernetes
![]() Logs
Logs
![]() Synthetics
Synthetics
![]() RUM
RUM
![]() Serverless
Serverless
![]() Security
Security
![]() More
More


![New Relic vs Splunk - In-depth Comparison [2026]](/blog/content/images/size/w960/2024/10/Datadog-vs-sentry--19-.png)