
Continuous Profiling Explained: CPU, Memory, and Flame Graphs in Production
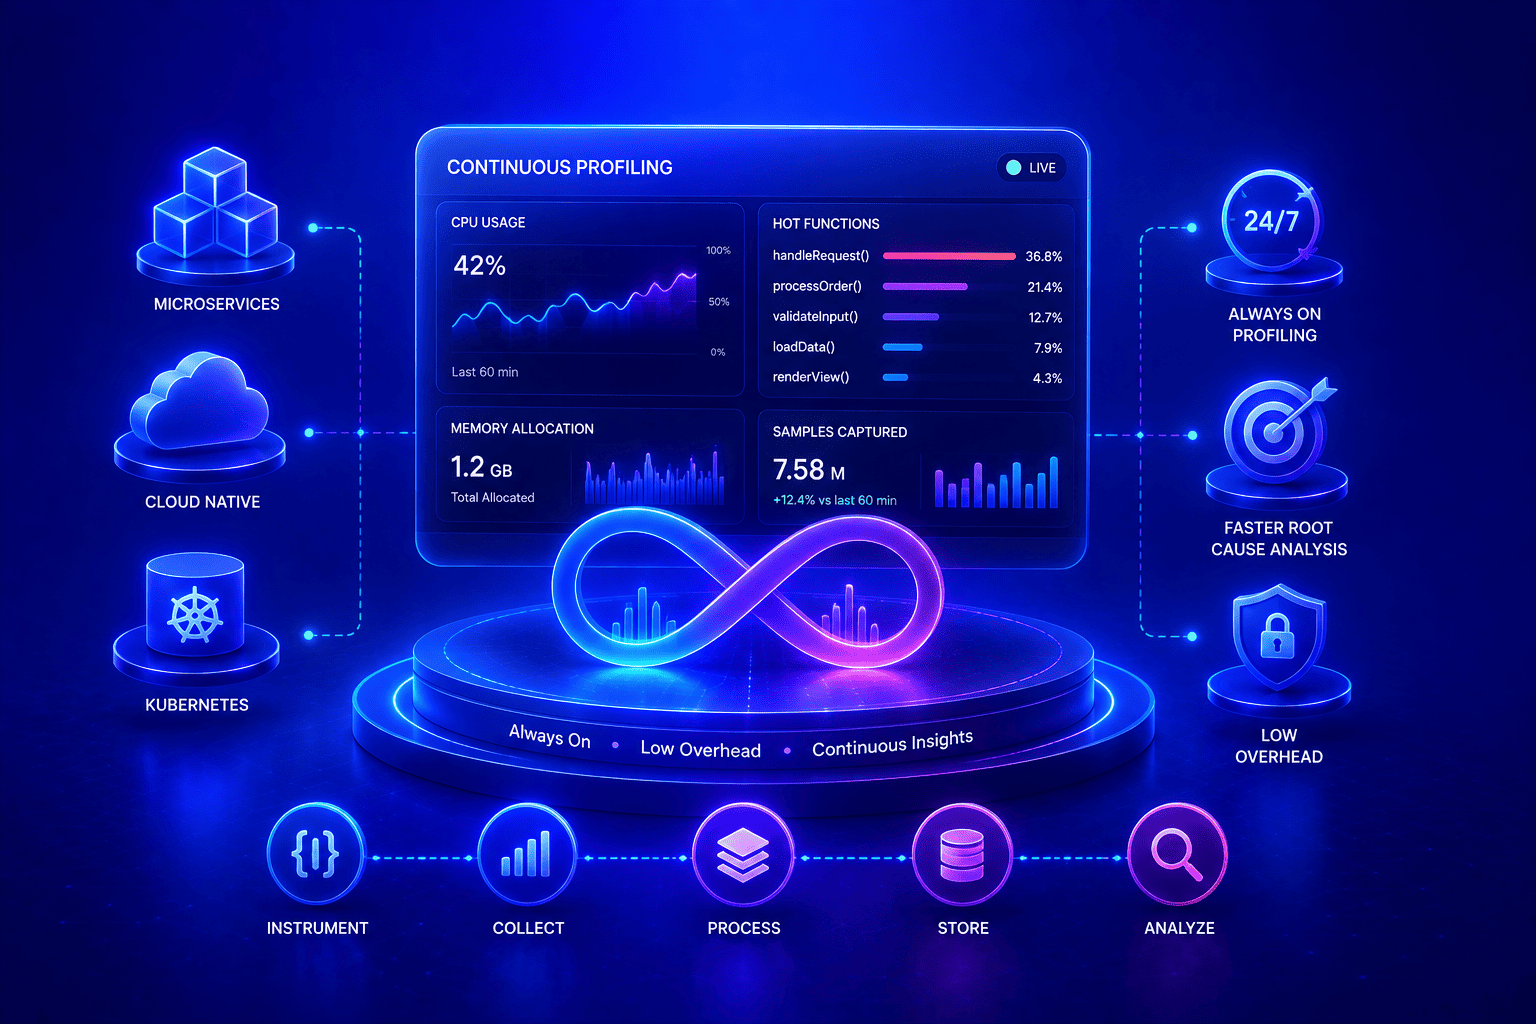
Backend systems rarely fail in obvious ways. More often, they degrade over time. CPU usage slowly increases, request latency creeps up, and costs rise without a clear explanation. Metrics tell you something is wrong, traces show where requests go, but neither explains why your code behaves the way it does under real load.
Continuous profiling fills that gap.
Atatus continuous profiling runs automatically in production with minimal overhead. It tracks CPU, memory, and execution in real time, not just in testing. You can monitor app performance during deployments, traffic spikes, and scaling. Everything ties directly into your traces and logs, so there's no switching between tools.
What's in this article?
- What Is Continuous Profiling?
- Why Continuous Profiling Matters?
- Continuous Profiling vs. APM vs. Traditional Profiling
- Types of Continuous Profiling
- How Atatus Continuous Profiling Works?
- Understanding Flame Graphs
- Is Continuous Profiling Safe to Run in Production?
- Continuous Profiling in Real Production Environments
- What are the Common Use Cases of Continuous Profiling?
- Top 6 Best Practices for Using Continuous Profiling
What Is Continuous Profiling?
Continuous profiling is the practice of continuously collecting performance data from running applications using low-overhead sampling. Instead of attaching a profiler only during incidents, profiling runs all the time and builds a historical view of how CPU, memory, and execution time are actually used in production.
Unlike traditional profiling, continuous profiling:
- Runs safely in production
- Observes real traffic patterns
- Captures performance trends over time
- Surfaces regressions without manual intervention
For backend and platform teams, this means fewer blind spots and fewer assumptions when performance issues appear.
Why Continuous Profiling Matters?
Logs, metrics, and traces are essential, but they stop short of explaining internal execution cost.
Common scenarios where teams get stuck:
- CPU usage rises even though request volume stays flat
- p95 latency increases without obvious slow spans
- Autoscaling adds instances but response times remain high
- A new release feels slower but benchmarks look fine
In these cases, the real issue is often inside the process itself: inefficient loops, heavy allocations, serialization overhead, or library behavior under concurrency.
Continuous profiling matters because it exposes where time and resources are spent inside your code, under real production conditions.
See where your app actually spends CPU
Enable Atatus profiling and get flame graphs from live traffic in minutes
Continuous Profiling vs. APM vs. Traditional Profiling
It's easy to confuse these three, but they answer different questions:
| Approach | Question It Answers | When It Runs |
|---|---|---|
| APM (traces & metrics) | Which request or service is slow? | Continuously, per request |
| Traditional profiling | Why is this specific process slow right now? | On-demand, attached manually |
| Continuous profiling | Where does my code spend CPU, memory, and time all the time, in production? | Continuously, in the background |
APM tells you a request took 800ms and which service it touched. Continuous profiling tells you why, which function, loop, or allocation inside that service consumed the time. They're complementary, not competing: traces show you where to look, profiles show you what's actually happening at the code level once you're there.
Types of Continuous Profiling
| Type of Profiling | Focus / Use Case |
|---|---|
| CPU Profiling | Shows where CPU time is spent. Helps identify high request latency, CPU saturation, and algorithmic inefficiencies. |
| Memory Profiling | Tracks allocation patterns and retention. Helps identify allocation-heavy code paths, garbage collection pressure, and memory growth over time. |
| Wall-Time Profiling | Measures execution time including I/O waits. Useful when latency is high but CPU usage appears normal. |
| Lock & Contention Profiling | Surfaces synchronization bottlenecks in concurrent systems. |
How Atatus Continuous Profiling Works?
Atatus is built for fast adoption. You can enable continuous profiling in minutes without introducing complex configuration or separate profiler tooling.
Quick Setup for Java Profiling:
This section shows how to enable Atatus continuous profiling for Java applications. The setup is lightweight and works with most modern Java frameworks.
1. Install the Atatus Java Profiling Agent
Download the atatus-agent.jar and add the Atatus SDK dependency to your project:
<dependencies>
    <dependency>
        <groupId>com.atatus</groupId>
        <artifactId>atatus-agent-sdk</artifactId>
        <version>1.0.0</version>
    </dependency>
</dependencies>
Place the atatus-agent.jar file in a known location on your server or container image.
2. Configure Atatus
Set the required configuration values using environment variables before starting your application:
export ATATUS_SERVER_ADDRESS="your-server"
export ATATUS_API_KEY="your-api-key"
export ATATUS_APPLICATION_NAME="service-name"
export ATATUS_PROFILER_EVENT="type"
Supported profiler types:
cpu
wall
alloc
ctimer
itimer
These settings control where data is sent, how the service is identified, and which profiler is enabled.
3. Run Your Application
Start your Java application with the Atatus Java agent:
java -javaagent:/path/to/atatus-agent.jar -jar your/app.jar
No application code changes are required. Once the application starts, continuous profiling begins automatically.
Within seconds, the Atatus dashboard starts collecting real-time profiling data from live traffic, including CPU usage, memory allocations, and execution hotspots.
4. Track Performance Across Deployments
To identify performance regressions early, tag your application version during startup or deployment.
This allows you to compare profiles across releases, spot CPU or memory spikes after deployments, and validate performance improvements with real data from production workloads.
Also read: What is Java Performance Monitoring? [A 2026 Guide to DevOps Engineers]
Understanding Flame Graphs

A flame graph is a visual representation of where your application spends its resources, most commonly CPU time. It aggregates thousands of stack samples into a single view, making performance hot paths immediately visible.
Each rectangle in a flame graph represents a function in the call stack.
- Width shows how much time the function consumes relative to others. Wider blocks matter more.
- Vertical depth represents the call stack. Functions at the top call the functions below them.
- Horizontal position has no time meaning. The order is purely for grouping similar stacks.
Flame graphs are built from sampled data, not traces. That means they highlight where time accumulates, not when a specific request occurred. This makes them ideal for spotting systemic inefficiencies rather than one-off slow requests.
How to read a flame graph effectively?
Start from the widest blocks, not the tallest ones. A shallow but wide function often causes more performance impact than a deep but narrow call chain.
Look for:
- Wide blocks high in the stack, which indicate expensive logic close to request handling
- Repeated patterns across stacks, which suggest shared bottlenecks
- Unexpected framework or library calls dominating width, often a sign of misconfiguration or inefficient usage
What the Flame Graph Reveals?
Flame graphs excel at exposing:
- CPU-heavy code paths
- Inefficient loops or serialization logic
- Performance regressions that grow gradually over time
They are less useful for understanding request timelines or individual slow transactions. Their strength lies in answering one core question clearly:
Where does the system spend most of its time?
When paired with continuous profiling, flame graphs evolve from a one-time diagnostic tool into a reliable way to track performance behavior as your code and traffic change.
Is Continuous Profiling Safe to Run in Production
The biggest hesitation teams have before enabling profiling in production is overhead. Continuous profilers avoid this by sampling instead of instrumenting every function call.
- Sampling interval: Atatus samples stack traces at a fixed rate (e.g., every 10ms) rather than tracing every execution, keeping CPU overhead typically under 1-2%.
- No code instrumentation: unlike tracing, profiling doesn't wrap every function, so it doesn't add per-request latency.
- Adjustable sampling rate: teams running cost-sensitive or high-throughput services can lower sampling frequency further without losing statistical accuracy.
Because of this, continuous profiling is designed to run at all times in production, not just during an incident which is what makes historical, trend-based analysis possible in the first place.
Continuous Profiling in Real Production Environments
Production systems are dynamic:
- Traffic shape changes throughout the day
- Data size varies per request
- Libraries behave differently under concurrency
- Runtime behavior shifts with GC cycles
Continuous profiling captures these realities over time. This historical context allows teams to:
- Compare performance before and after releases
- Identify gradual regressions
- Validate optimizations with confidence
What are the Common Use Cases of Continuous Profiling?
Backend and platform teams commonly use continuous profiling to:
- Identify CPU hot paths in request handlers
- Detect performance regressions after deployments
- Reduce cloud costs by eliminating wasted CPU
- Understand framework and library overhead
- Validate scaling and capacity decisions
Instead of reacting to incidents, teams proactively improve performance.
Turn flame graphs into fixes
Atatus ties profiling, traces, and logs together in one dashboard
Top 6 Best Practices for Using Continuous Profiling
Continuous profiling delivers the most value when it is used deliberately and consistently. Below are practical best practices followed by experienced backend, SRE, and platform teams.
#1 Profile Continuously, Not Just During Incidents
Running a profiler only when something breaks limits its usefulness. Many performance issues build up gradually and never trigger alerts.
Continuous profiling ensures you always have historical data to:
- Understand baseline performance
- Spot slow regressions over days or weeks
- Investigate issues after they have already passed
The goal is trend visibility, not just incident debugging.
#2 Compare Profiles Across Time and Releases
Single snapshots rarely tell the full story. Profiling becomes powerful when you compare:
- Before vs after a deployment
- Normal load vs peak traffic
- Last week vs today
This approach helps teams spot performance regressions quickly and prevent issues from reaching users.
#3 Focus on the Widest Blocks First
In flame graphs, width matters more than depth.
- The widest blocks represent the highest cumulative cost
- Deep stacks are not always expensive
- Small-looking functions can be costly if called frequently
Start with the widest application-level functions and work downward.
#4 Separate Application Cost From Framework and Runtime Overhead
Frameworks, runtimes, and libraries will always consume some resources. The key is understanding how much good profiling practice involves:
- Identifying expected framework overhead
- Tracking changes in library or runtime cost
- Prioritizing optimization in application logic first
This keeps optimization efforts focused and realistic.
#5 Validate Optimizations With Real Traffic
Local benchmarks and staging tests often fail to reflect production behavior.
After making changes:
- Compare profiles before and after the fix
- Validate improvements under real load
- Ensure gains persist during peak traffic
If the flame graph does not change, the optimization likely did not matter.
#6 Treat Profiling as an Ongoing Engineering Practice
Continuous profiling works best when it is part of regular engineering workflows:
- Review profiles during performance reviews
- Include profiling checks in release validation
- Use profiling data during capacity planning
When profiling becomes routine, performance issues stop being surprises.
Final Thoughts
Continuous profiling gives backend engineers and platform teams visibility into how code behaves under real production conditions. Flame graphs turn raw execution data into something engineers can understand and act on quickly.
By combining low-overhead profiling with clear visual analysis, Atatus helps teams move from reactive debugging to systematic performance optimization.
For modern backend systems, continuous profiling is no longer optional. It is a core part of running reliable, efficient services at scale.
Turn production traffic into performance wins in 10 minutes
Run Atatus profiling instantly to expose CPU waste, allocation spikes, and latency bottlenecks before they hit users
FAQS About Continuous Profiling
1) How often should continuous profiling run in production?
It can run continuously or in scheduled intervals. Modern tools are designed to minimize overhead, so running in production is safe.
2) Can continuous profiling detect memory leaks?
Yes. By tracking memory allocation and retention over time, profiling reveals code paths causing memory growth or leaks.
3) How does continuous profiling help during high traffic periods?
It shows which parts of your code consume resources under load, helping optimize performance during spikes or peak usage.
4) Which applications benefit most from continuous profiling?
Apps with high traffic, backend-heavy processing, or complex algorithms benefit most, as profiling highlights inefficiencies that impact performance.
5) Can continuous profiling integrate with logging and tracing tools?
Yes. Integrating profiling with logs and traces provides a complete picture of performance issues without jumping between tools.
6) What languages and frameworks support continuous profiling?
Commonly supported languages include Node.js, Python, Java, Go, Ruby, and PHP. Most modern frameworks are compatible.
7) Will continuous profiling slow down my application?
When using sampling-based profiling, the performance impact is minimal, allowing safe operation in production environments.
8) How can teams act on continuous profiling data?
Teams can optimize slow code paths, reduce memory usage, prevent regressions, and improve app reliability with actionable insights.
9) What's the difference between continuous profiling and APM?
APM (traces, metrics, logs) shows which request or service is slow. Continuous profiling shows why, which function, loop, or allocation inside the code is consuming CPU or memory. They work together rather than replacing each other.
10) Does continuous profiling use eBPF?
Some profilers use eBPF for kernel-level, zero-instrumentation sampling. Others, like language-specific agents, sample at the runtime or VM level (e.g., JVM, Python interpreter, Go runtime). Both approaches aim for low overhead without code changes.
11) How much overhead does continuous profiling add?
With sampling-based profiling, overhead is typically under 1-2% CPU, since the profiler captures stack snapshots at intervals rather than tracing every function call.
#1 Solution for Logs, Traces & Metrics
 APM
APM
Kubernetes
Logs
Synthetics
RUM
Serverless
Security
More

![New Relic vs Splunk - In-depth Comparison [2026]](/blog/content/images/size/w960/2024/10/Datadog-vs-sentry--19-.png)
![New Relic vs Sentry - Which Monitoring Tool to Choose? [2026]](/blog/content/images/size/w960/2024/10/VS--1-.png)