Docker Monitoring with ELK Stack
Dockers are containerization platforms where you can store multitudes of data in a single package ( by dividing them into different containers). Since these are high-volume entities, managing and monitoring them should be a top priority. I’ll tell you why. Because when it grows out of our capabilities, we won't be able to control any errors popping up in it. So, as the saying goes, prevention is better than cure.
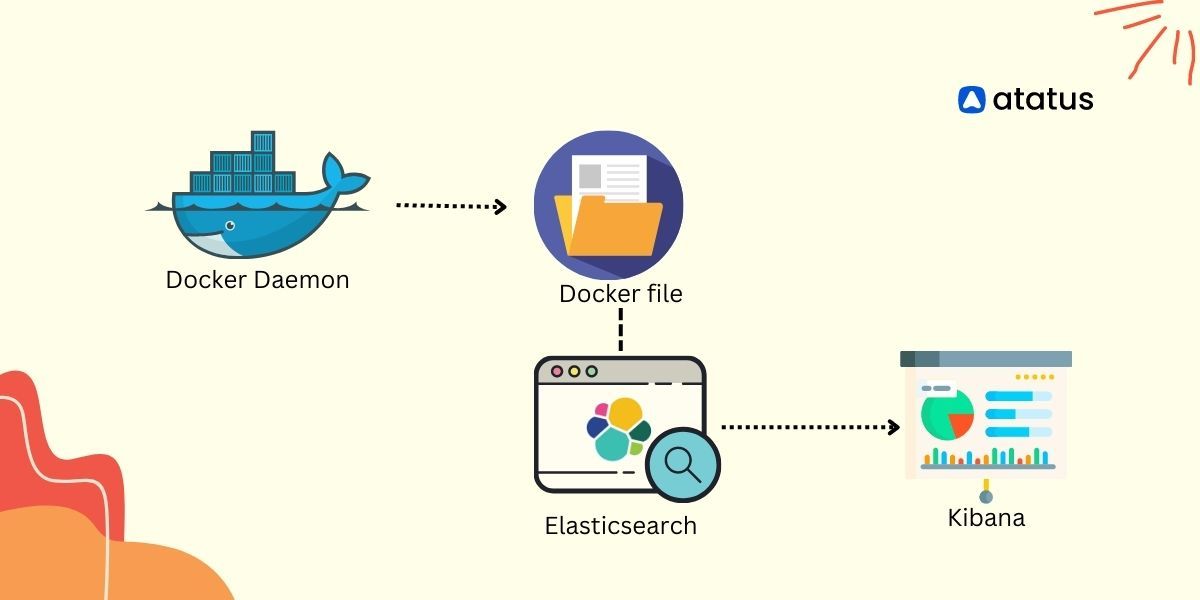
ELK stack is a premium confluence of three high-performing tools - Elasticsearch, Kibana, and Logstash/ Metricbeat . While Logstash feeds data into Elasticsearch, the latter transfers it to Kibana to present vivid and informative visualizations.
Elastic has now brought in a new integration feature - Docker integrations. It can fetch metrics on default topics like CPU, health check, disk io, memory, network, etc., from docker containers and give us pictorial insights via Kibana.
Thus reiterating the necessity of monitoring docker containers, we will get into the nuances of the process.
Let's look at the following
- Overview of ELK Stack
- Installing ELK Stack for Docker Monitoring
- Creating a Docker file
- Configuring Docker to send logs to ELK Stack
- Creating dashboards in Kibana
- Best practices for monitoring Docker containers with ELK Stack
Overview of ELK Stack
Elasticsearch is a search engine that is used to store and search logs. Logstash is a data processing pipeline that ingests data from multiple sources, transforms it, and sends it to Elasticsearch. Kibana is a web interface that is used to visualize and explore data stored in Elasticsearch. Download the latest version of these from the official website and install it on your system. ELK Stack requires Java to run. Make sure you have Java installed on your system.
Open the Elasticsearch configuration file (elasticsearch.yml) and set the following configurations:
- Set the cluster name to a unique name. This is used to group Elasticsearch nodes together.
- Set the network host to the IP address of your machine. This allows Elasticsearch to bind to the correct network interface.
- Set the HTTP port to a non-default value (such as 9201). This is used to access Elasticsearch via HTTP.
Installing ELK Stack for Docker Monitoring
1. Install Elasticsearch
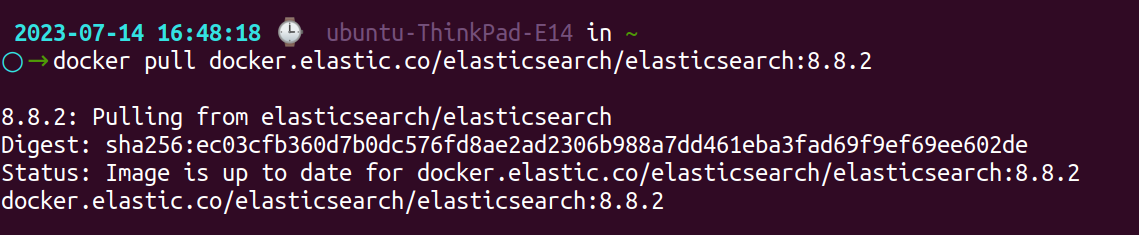
i.) Pull the Elasticsearch image: To pull the official Elasticsearch Docker image, open a terminal window or use a command prompt and run the following command:
docker pull docker.elastic.co/elasticsearch/elasticsearch:8.8.2
ii.) Start Elasticsearch in Docker: Once the image is downloaded, you can use the following command to create a Docker container:
docker run --name es01 --net elastic -p 9200:9200 -it docker.elastic.co/elasticsearch/elasticsearch:8.8.2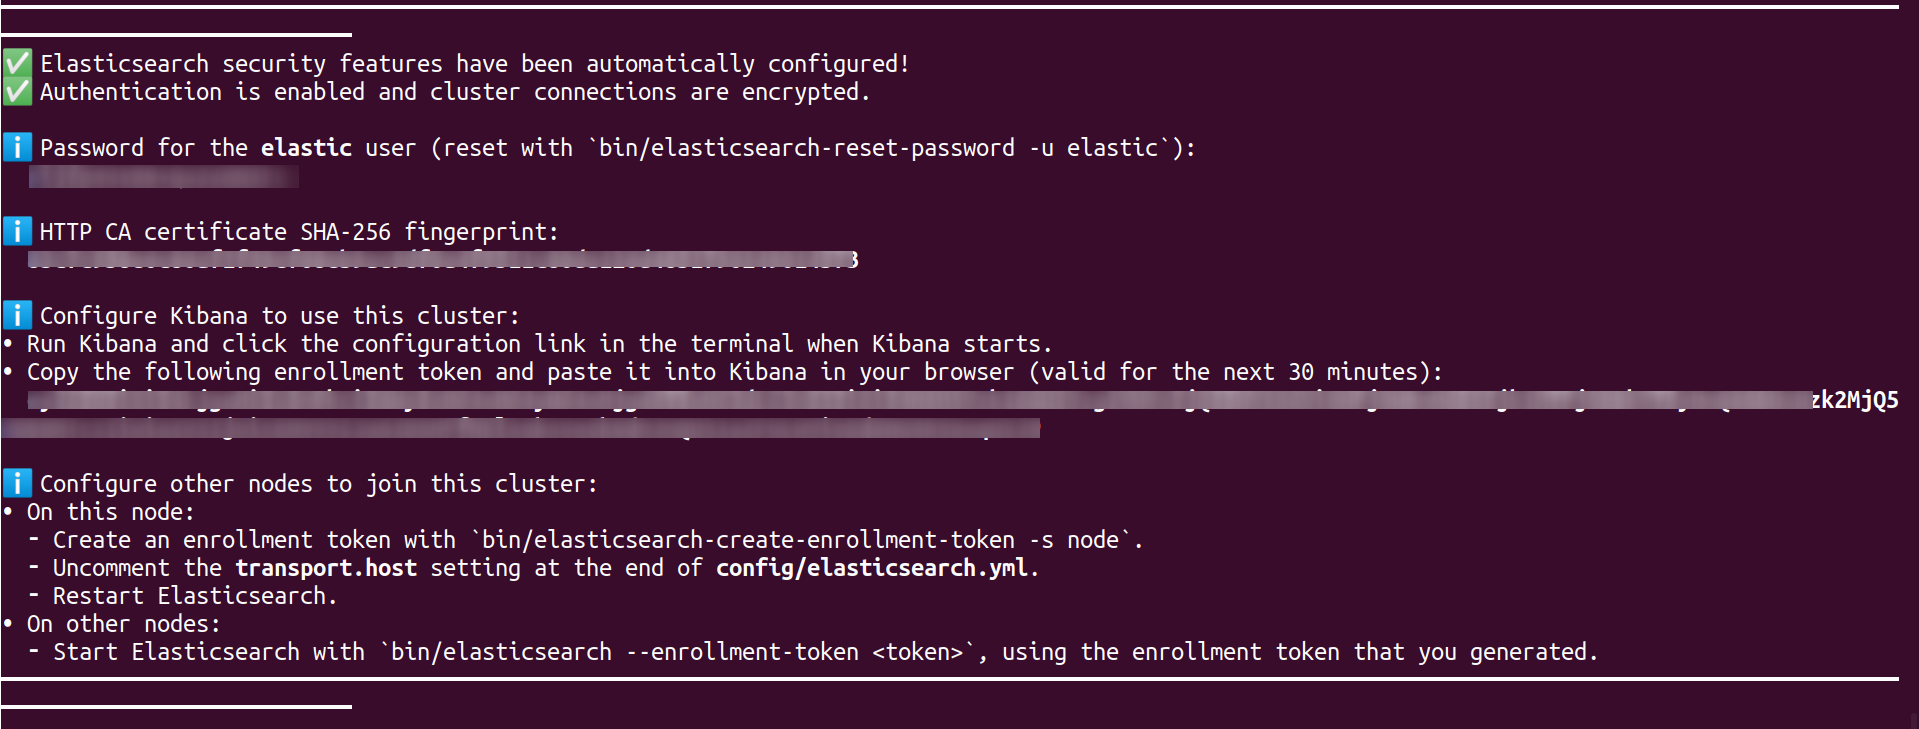
A password is generated for the elastic user and output to the terminal, along with a token for enrolling in Kibana.
iii.) Verify Elasticsearch is running: After running the container, you can check if Elasticsearch is running by accessing the following URL in your web browser or using a tool like cURL:
http://localhost:9200If Elasticsearch is running successfully, you should see a JSON response with information about your Elasticsearch cluster.
2. Install Logstash
- Go to the Logstash downloads page: https://www.elastic.co/downloads/logstash.
- Choose the suitable version for your operating system and download the package.
- Extract the contents of the downloaded package to a directory of your choice.
- Navigate to the config directory within the extracted Logstash directory.
- Create a new configuration file (e.g.,
my-config.conf) and define your input, filter, and output configurations. Refer to the Logstash documentation for configuration options - Save the configuration file.
- Open a terminal or command prompt and navigate to the Logstash directory.
- Start Logstash and specify the path to your configuration file by running the command:
- On Linux/Mac:
./bin/logstash -f path/to/my-config.conf - On Windows:
bin\logstash.bat -f path\to\my-config.conf
- On Linux/Mac:
- Logstash will begin processing data according to your configuration.
3. Install Kibana
Pull the Kibana Docker image by running the following command:
docker pull docker.elastic.co/kibana/kibana:8.8.2Using the following command, you can create a Docker container once you have downloaded the image:
docker run --name kib-01 --net elastic -p 5601:5601 docker.elastic.co/kibana/kibana:8.8.2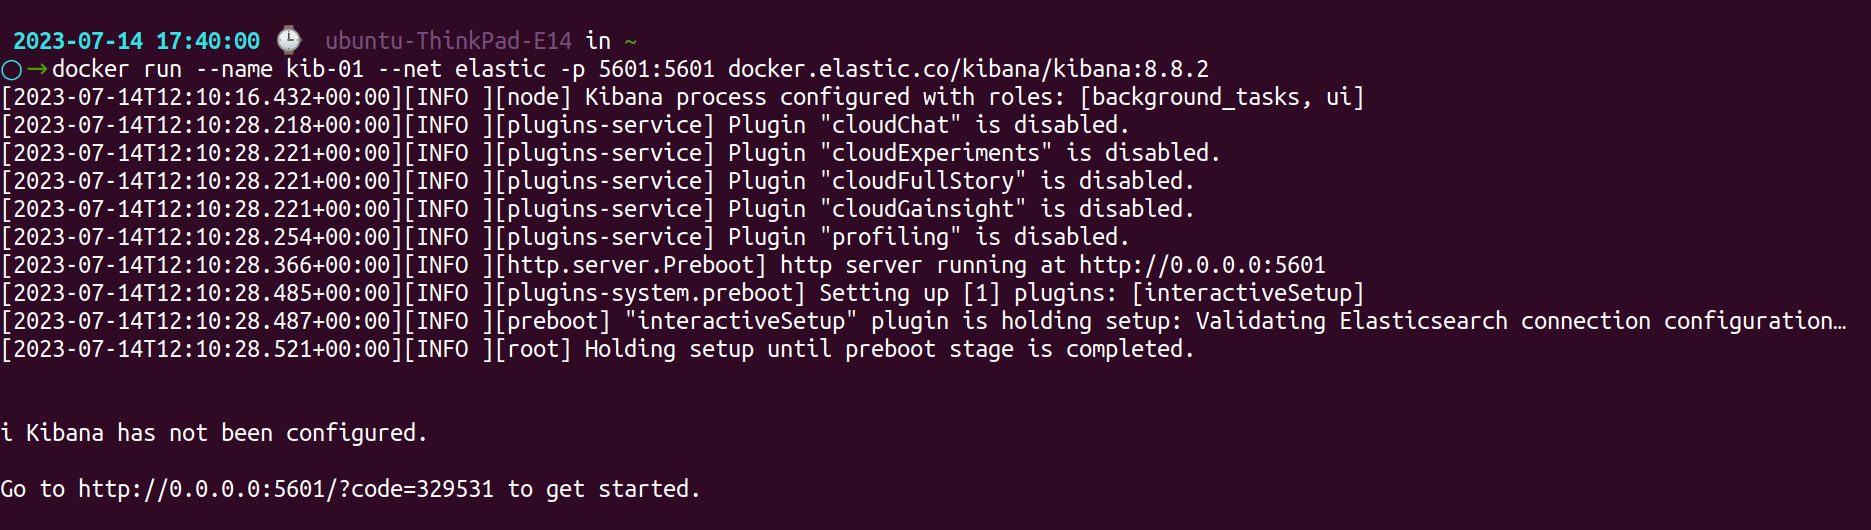
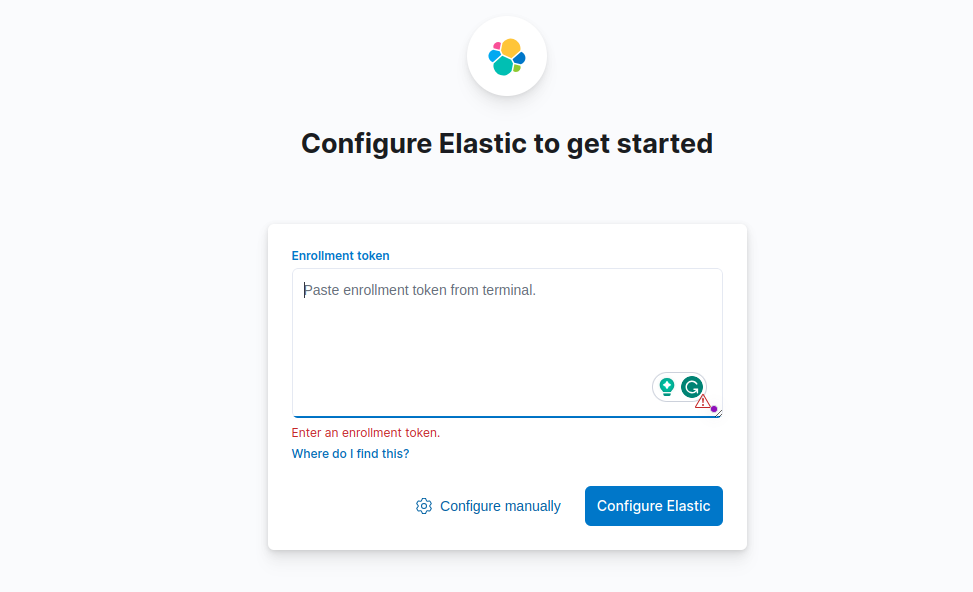
You will be prompted to enter an enrollment token, to access the Kibana Dashboard. Copy the enrollment token from your Elasticsearch instance and paste it into the corresponding field.
Creating a Docker file
Creating a docker file is easy. Firstly, you choose the base image (you can choose it from the docker hub or by custom creation), then write a working directory for the container where your code will reside. After this, copy the application code to this directory and install the required packages.
Example: Installing a Python web file
# Use an official Python runtime as a parent image
FROM python:3.7-slim

# Set the working directory to /app
WORKDIR /app

# Copy the current directory contents into the container at /app
COPY . /app

# Install the required packages
RUN pip install --trusted-host pypi.python.org -r requirements.txt

# Expose port 80 for the application
EXPOSE 80

# Define the command to run the application
CMD ["python", "app.py"]
After installing the dockerfile, you can build your docker image using docker build command:
docker build -t myimage Once the image is built, try running the code to see if it starts the container with your myimage on the mentioned port.
Configuring Docker to send logs to ELK Stack
To configure Docker to send logs to Logstash, you need to update the Docker daemon configuration. Here are the steps:
Edit the Docker daemon configuration file. This file location varies depending on your operating system:
- Linux:
/etc/docker/daemon.json - Windows:
C:\ProgramData\docker\config\daemon.json - macOS:
~/Library/Containers/com.docker.docker/Data/docker.json
{
"log-driver": "syslog",
"log-opts": {
	"syslog-address": "tcp://localhost:514",
	"tag": "{{.ImageName}}"
	}
}
This configuration tells Docker to use the syslog driver to send logs to the localhost on TCP port 514. The tag parameter sets the name of the Docker image as the syslog tag.
Restart the Docker daemon to apply the new configuration by running the following command:
sudo systemctl restart dockerVerify that the syslog configuration is correct by running the following command:
sudo journalctl -u docker.service | grep "Using syslog"In order to receive logs from Docker and send them to Elasticsearch, you need to create a Logstash configuration file. Create a file called logstash.conf (or any other name you prefer) in a directory of your choice and add the following configuration:
input {
	syslog {
		port => 514
		type => "syslog"
	}
}
Add a new filter plugin to the Logstash configuration to parse Docker logs:
filter {
    if [type] == "syslog" {
        grok {
            match => {
                "message" => "%{SYSLOGTIMESTAMP:syslog_timestamp} %{SYSLOGHOST:syslog_hostname} %{DATA:syslog_program}(?:\[%{POSINT:syslog_pid}\])?: %{DATA:log_level}%{SPACE}%{DATA:container_id} %{GREEDYDATA:message}"
            }
            add_field => ["received_at", "%{@timestamp}"]
            add_field => ["received_from", "%{host}"]
        }
        date {
            match => ["syslog_timestamp", "MMM  d HH:mm:ss", "MMM dd HH:mm:ss"]
        }
        mutate {
            replace => {
                "message" => "%{message}"
            }
            remove_field => ["syslog_timestamp", "syslog_hostname", "syslog_program", "syslog_pid"]
        }
    }
}
This tells Logstash to parse Docker logs that are received as syslog messages using the grok filter plugin. The date filter plugin is used to parse the timestamp of the log entry. The mutate filter plugin is used to clean up the log entry by removing unnecessary fields.
Add a new output plugin to the Logstash configuration to send the parsed logs to Elasticsearch:
Output:
{
	elasticsearch {
		hosts => ["localhost:9201"]
		index => "docker-logs-%{+YYYY.MM.dd}"
	}
}
This tells Logstash to send the parsed logs to Elasticsearch using the Elasticsearch output plugin. The index parameter sets the name of the Elasticsearch index to use. Restart Logstash to apply the new configuration.
Creating Dashboards in Kibana
After launching Kibana on port 5601, define the Elasticsearch indexes that Kibana needs to use when making visualizations.
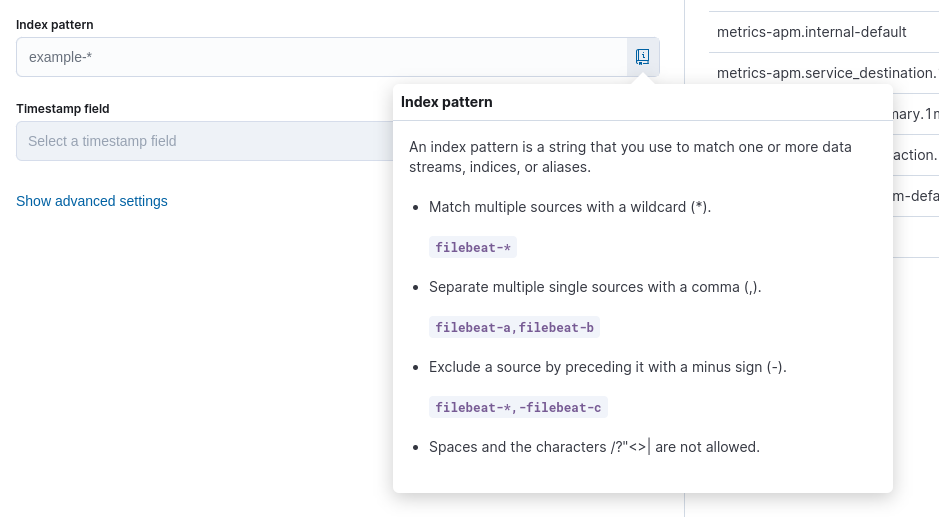
1. Define an index pattern
a.) Under "Management" click on "Stack Management" in the sidebar.
b.) Under "Kibana," select "Data Views" (Index Patterns has been renamed to Data Views).
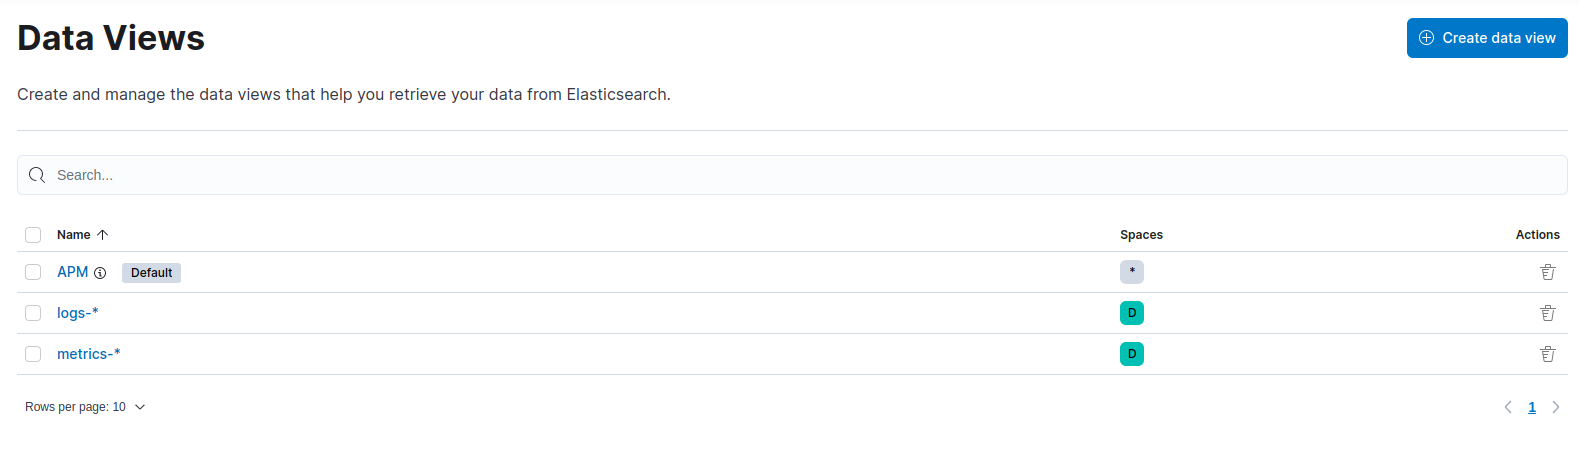
c.) Click on "Create Data View".
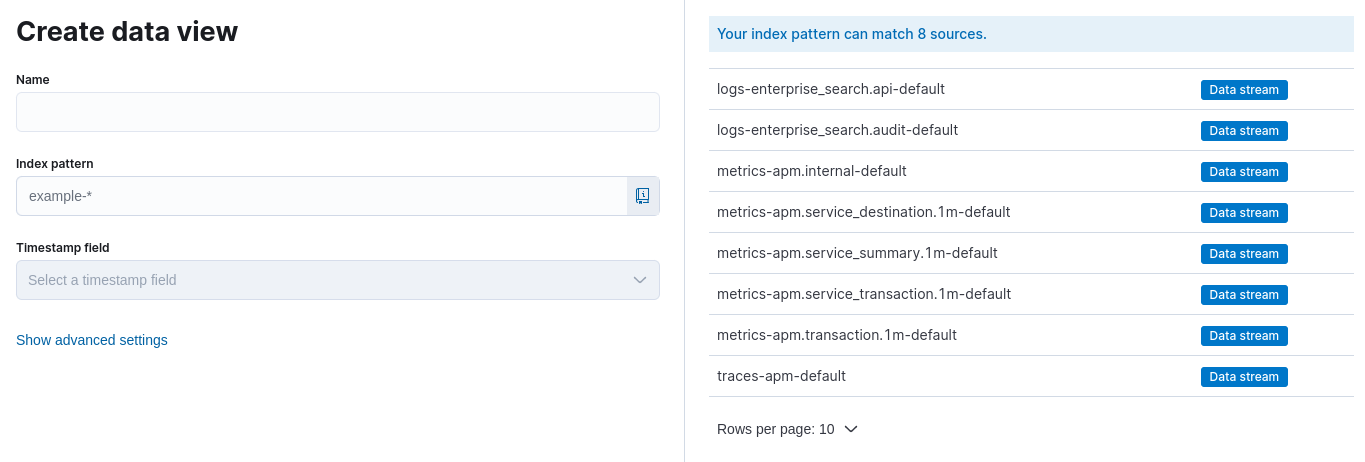
d.) Specify the name of your index pattern (e.g., logs-* or docker-*).
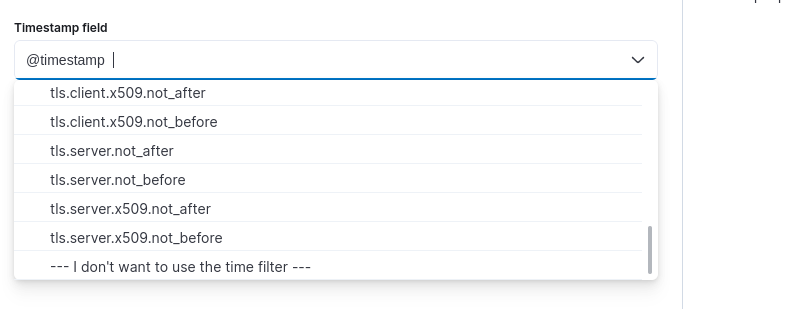
e.) Choose the appropriate time filter field or opt for "I don't want to use the Time Filter" if timestamps aren't available.
f.) Click on "Save data view to Kibana" to save.
2. Create a new dashboard
a.) Click on "Dashboard" in the Kibana sidebar.
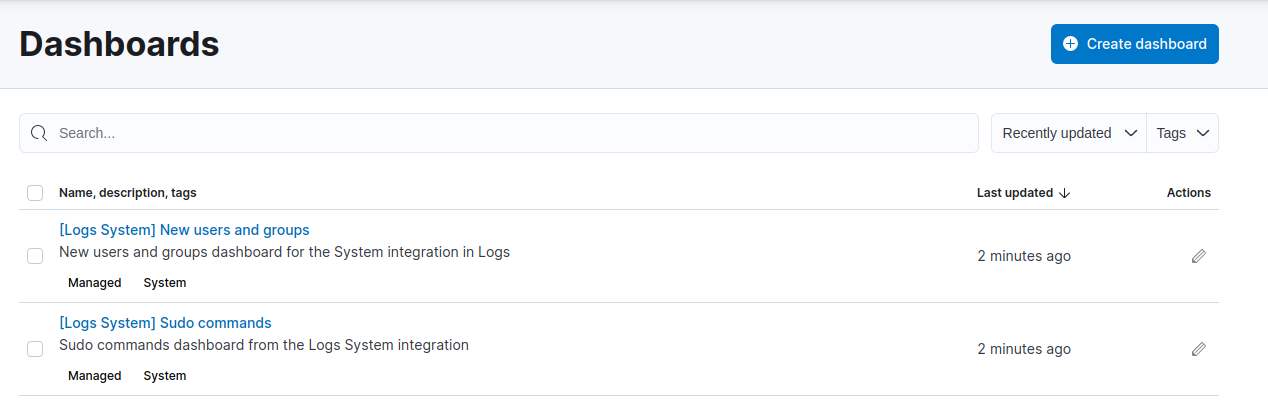
b.) Select the "Create new dashboard" button.
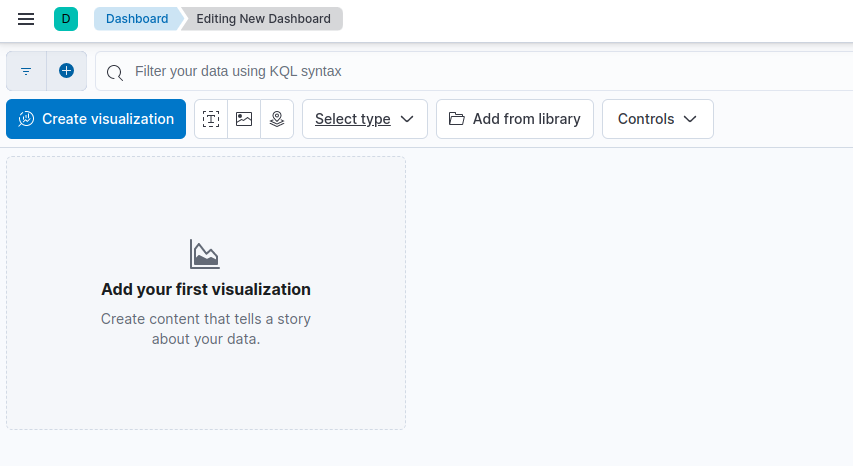
3. Add visualizations to the dashboard
a.) Click on the "Add" or "Visualize" button.
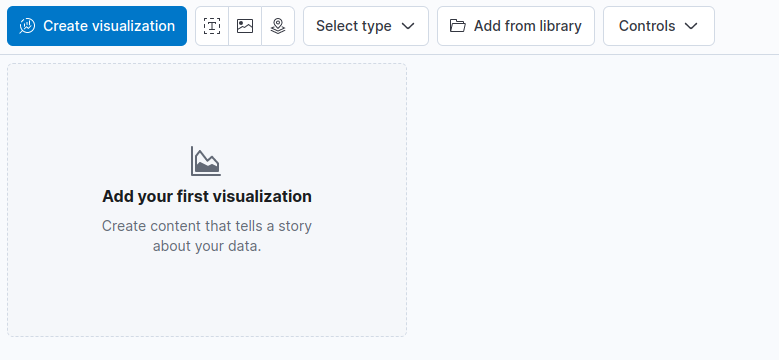
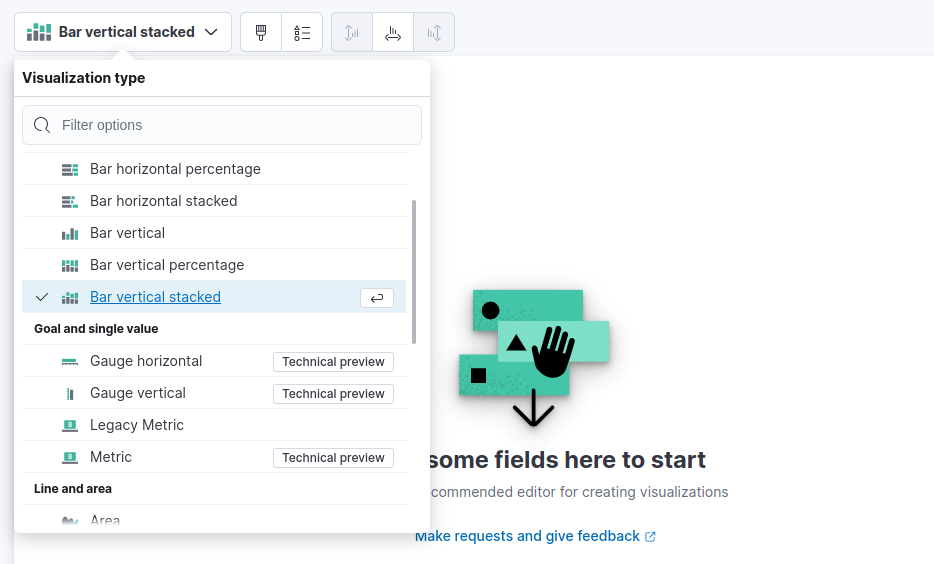
b.) Choose a visualization type (e.g., bar chart, line chart, pie chart).
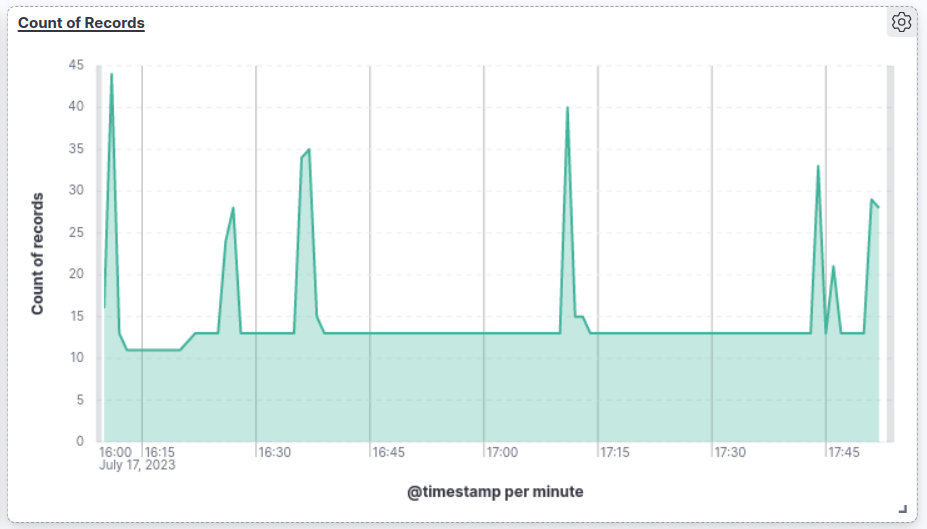
c.) Configure the visualization by selecting the index pattern and specifying fields and settings.
d.) Customize the visualization as needed (e.g., aggregations, filters).
e.) Save the visualization and return to the dashboard.
4. Arrange and organize the dashboard
- Drag and drop visualizations from the toolbar onto the dashboard canvas.
- Resize and reposition the visualizations to suit your layout.
- Utilize toolbar options to further customize the layout, add panels, or apply filters.
5. Save and share the dashboard
- Click on the "Save" button.
- Provide a name and description for the dashboard.
- Choose the desired save location, such as "Default space."
- Click on "Save" to store the dashboard.
Your dashboard is now saved and accessible from the Kibana sidebar. You can share the dashboard URL with others to grant access.
Kibana offers advanced features like filters and drill-downs that can be utilized to enhance the functionality and interactivity of your dashboards.
Best practices for monitoring Docker containers with ELK Stack
Here are some of the industry best practices that can guide you with monitoring your docker containers:
- Collect only the necessary metrics: To avoid overwhelming the system with too much data, it's important to focus on collecting only the metrics that are necessary for monitoring the Docker environment. This includes both system-level metrics such as CPU usage and memory usage, as well as application-level metrics such as HTTP response codes and error messages.
- Set up alerts and notifications: It's important to set up alerts and notifications in Elasticsearch to notify users of potential issues or problems in Docker containers based on threshold values set for specific metrics.
- Keep the dashboard organized and clean: To ensure that the dashboard remains easy to read and navigate, it's important to keep it organized and clean. This can be done by grouping related panels together, using consistent colors and labels, and removing any unnecessary elements.
- Monitor and analyze metrics regularly: To get the most value from Docker monitoring with ELK Stack, it's important to monitor and analyze metrics regularly. This can help identify trends and patterns in container behavior over time, as well as potential issues or problems before they become critical.
- Use the right visualizations for the right metrics: To ensure that the dashboard is easy to read and understand, it's important to use the right visualizations for the right metrics. For example, line charts can be used to display changes in CPU usage over time, while pie charts can be used to display the distribution of container status.
- Customize the dashboard for specific use cases: To ensure that the dashboard is tailored to the specific needs of the Docker monitoring environment, it's important to customize it for specific use cases. This might include adding panels for specific metrics or rearranging panels to better reflect the most important metrics.
- Regularly review and update the ELK Stack configuration: As the Docker environment changes over time, it's important to regularly review and update the ELK Stack configuration to ensure that it is collecting the necessary metrics and alerts.
Summing Up!
Docker monitoring is important for developers as it helps them track bugs and enhance security, for IT Professionals, it can benefit with flexible integration of existing processes and so on. For enterprises, they get to have all of their applications within a single broad ecosystem rather than fragmented out-of-reach programs.
In this article, we have emphasized on the usage of ELK Stack for Docker Monitoring, as it has a new Docker Integration feature added with it recently. Although such direct integrations might not fare upto Logstash or Metricbeats level, we surely get to have a organized view of all the processes and requests going through our system.
And this idea(of how our system is running) is extremely essential if we got to backup for those errors and faults arising within our programs and give a seamless experience to our customers.
Atatus Docker Logs Monitoring
Docker Logs Monitoring with Atatus is a powerful solution that allows you to gain deep insights into the logs generated by your Docker containers. It provides seamless integration with Docker, enabling you to collect, analyze, and visualize the logs generated by your Docker containers in real-time.

With Atatus's Docker log monitoring, you can centralize and aggregate logs from multiple containers across your infrastructure, making it easier to identify patterns, detect anomalies, and gain a holistic view of your application's behavior.
You can quickly search through your log data using keywords, specific container names, or custom-defined filters, making it effortless to pinpoint and troubleshoot issues within your Docker environment.
Additionally, Atatus's built-in log parsing and alerting features allow you to create custom alerts based on specific log events or patterns, ensuring that you are promptly notified of any critical issues.
#1 Solution for Logs, Traces & Metrics
![]() APM
APM
![]() Kubernetes
Kubernetes
![]() Logs
Logs
![]() Synthetics
Synthetics
![]() RUM
RUM
![]() Serverless
Serverless
![]() Security
Security
![]() More
More


![New Relic vs Splunk - In-depth Comparison [2025]](/blog/content/images/size/w960/2024/10/Datadog-vs-sentry--19-.png)
![New Relic vs Sentry - Which Monitoring Tool to Choose? [2025]](/blog/content/images/size/w960/2024/10/VS--1-.png)