JSON Logging: 7 Must-Know Tips
The performance of a applications and company's infrastructure is critical to its success. We all know how crucial logs are when it comes to diagnosing performance and availability issues. Is troubleshooting, however, the sole function of logs? Obviously not.
You've probably discovered they're vital in other ways as well throughout the years. The visualisation of business dashboards is another use of logs. Here's why JSON logging is the ideal format for storing logs.
Typically, we keep track of application data in a file. However, we require a more suitable framework. We can simply search fields with a JSON key if we record logs in JSON.
Furthermore, the organised format will make performing an application log analysis much easier for us.
What is JSON Logging?
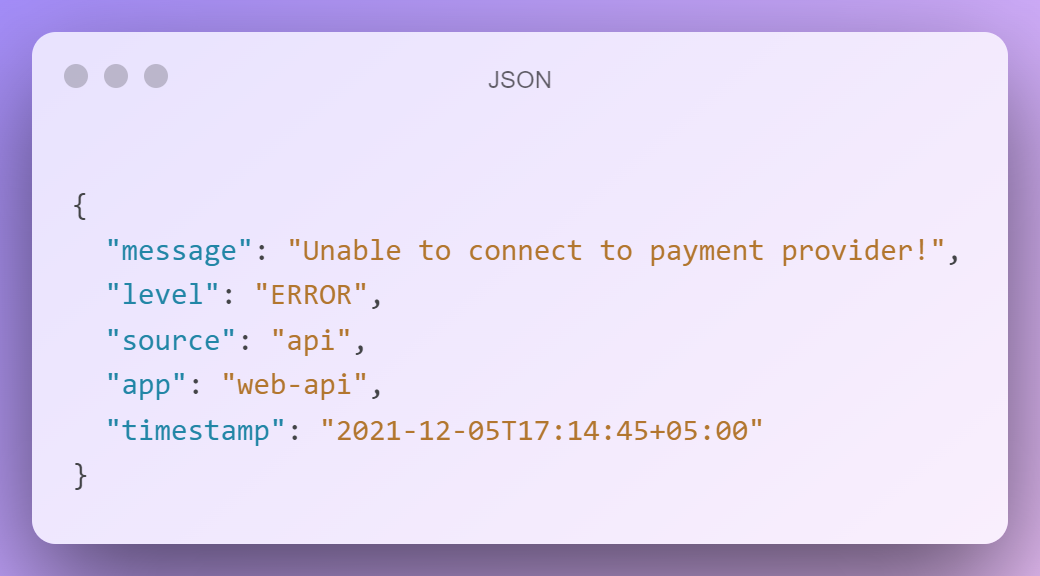
JSON is a file format that is also known as JavaScript Object Notation. JSON is a human-readable language format for storing and maintaining data. The format is made up of attributes and associated data types, which are recorded as an array. An example of a JSON array is shown below.
When you run a programme or take an action on it, log files are created. The text format of log files is typically complex.
JSON logging is a type of structured logging in which log data is interpreted and saved in a JSON format.
Tips for the Most Effective JSON logging
Here are some suggestions and options to think about while creating JSON logging.
#1 Verify your JSON
Since JSON is so simple to create, it's important to make sure you're working with genuine JSON data. Tools and programmes won't be able to process your JSON correctly if it's invalid.
Validating JSON entails ensuring that the syntax is proper, but it does not assign any meaning to the data because any meaning is unique to the data being communicated. Many online tools, such as JSON Linter or JSON Beautifier, allow you to paste your JSON data and have it validated.
After you've confirmed that your JSON is legal, double-check that your properly structured JSON says what you meant it to say. And you'll need a schema for that.
#2 Make a Standardised Schema
Once you've confirmed that your log data is legitimate JSON, you'll want to assign meaning to each field so you know where to look when examining JSON logs. Schemas are ideal for the job.
They let you to specify the desired format of JSON logs, allowing all users to view the semantics of each field. JSON Schema and other projects like it assist you in creating descriptions of your JSON data, which you can use to validate JSON data you receive and transmit.
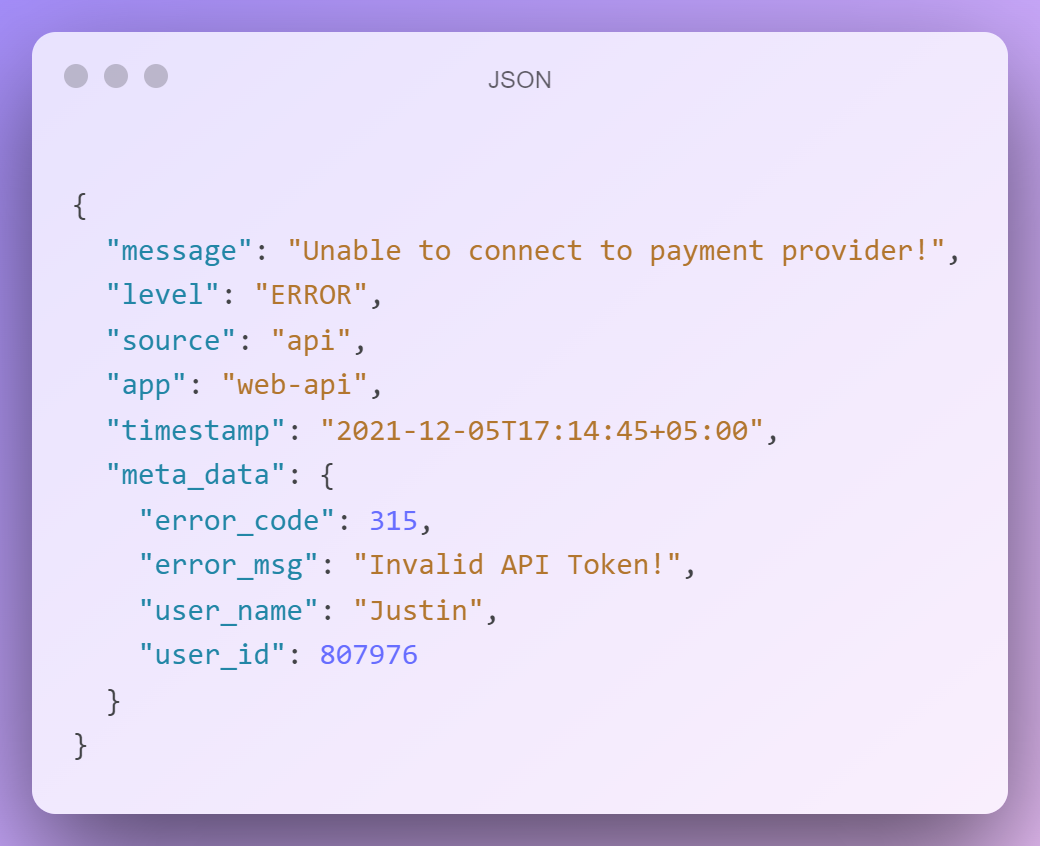
#3 Make Your JSON Logging Statements More Contextual
You can record the name of the application, the hostname, the degree or severity of the log message, the name of the file or class where the problem occurred, or data about the current request/transaction. This is automatically included by libraries like Log4j, and you can provide more context using NDC fields.
You should also keep track of numbers that are easily searchable, such as request IDs, user IDs, session IDs, or transaction IDs. This is particularly handy for transaction tracing, in which you want to observe how a single transaction was handled by multiple internal components or services.
Include an identification for the request if you have a service that returns an error message to the client. You'll be able to determine which request caused which issue this way.
Context adds a lot of value to messages, such as:
#4 Detailed Error and Behavior Logging
Include enough information to log errors and their behavior as you add new code. This will come in handy while debugging or assessing the problem. Assume your project is currently in the support phase.
A customer reports an unexpected problem. The first step is to examine the logs. If the logs contain adequate information, your support team will be able to quickly determine what action caused the mistake and contact the development team.
#5 Always use the same data type for each field
Along with string and integers, JSON enables nested JSON objects. Each field should have a consistent data type to make filtering and searching considerably easier. Let's say you have a field called ID in a JSON file. You wrote the JSON as a string in one of the logs.
{ id: "322" }
You wrote the JSON in number format in one place, but not the other.
{ id: 564 }
What do you think will happen? If you use the string filter to look for the ID field in all the data, you'll miss all the fields with data in numerical format. The importance of consistency cannot be overstated.
#6 JSON Compression
Even though JSON's textual representation is short, compressing the data may allow you to transmit and receive JSON messages faster. Using a compression method like gzip or bzip2 can help you shrink your JSON data by up to 90%. That's equivalent to reducing a 130MB JSON payload to 13MB.
#7 Distinguish Message Types Using Logging Levels
The several logging levels used to characterize the severity of a log message, such as INFO, WARN, and CRITICAL, are familiar to most developers. You may make it easier for current tools to look through log data and locate the most relevant information when you need it by carefully using these levels in your JSON messages.
Using log levels encourages you to keep track of both mistakes and behavioral data. Both are crucial in different ways, especially when it comes to diagnosing problems: errors show you what went wrong, whereas behavioral messages explain you why.
WindUp
When it comes to using your JSON logs, there are a few recommended practises to keep in mind to guarantee that your logs are usable when you need them the most. Validating your JSON logging data against a schema ensures that all of the fields you expect are present, and including timestamps adds to your confidence that you'll be able to order events quickly while troubleshooting.
You could do a lot worse than JSON when it comes to log formats. Because JSON is machine and human readable, there are several tools for creating and consuming JSON messages—libraries exist for all programming languages and runtime environments.
With Atatus, You can keep Track of Your Entire Application.
Atatus is a Full Stack Observability Platform that allows you to investigate issues as if they had occurred in your application. Instead of guessing why issues occur or requesting images and log dumps from users, Atatus allows you to recreate the experience and immediately figure out what went wrong.
Application Performance Monitoring, Real User Monitoring, Server Monitoring, Logs Monitoring, Synthetic Monitoring, Uptime Monitoring, and API Analytics are some of the services we provide. It has plugins and works well with any application, regardless of framework.
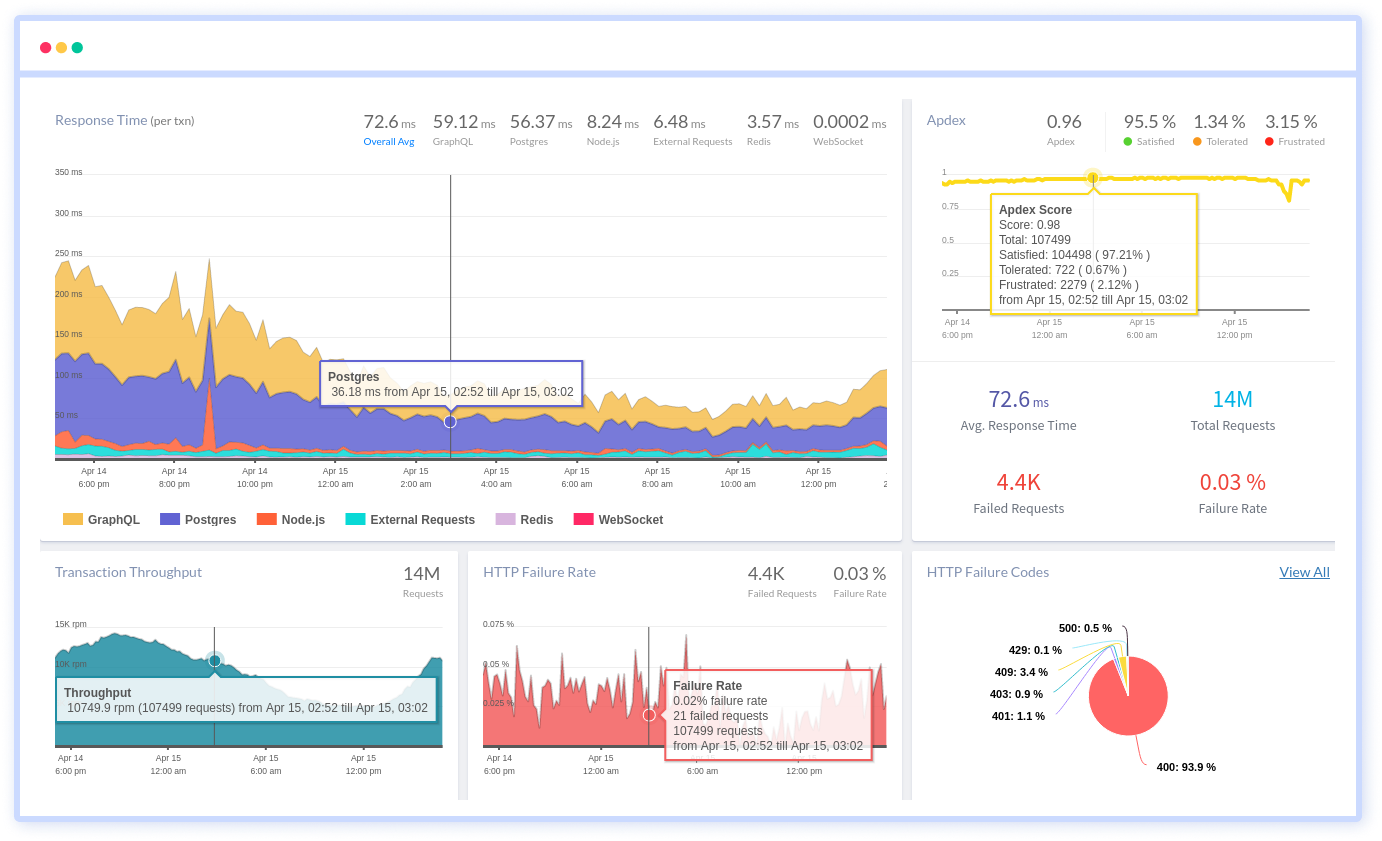
Atatus provides a full view of your application, including how it works, where performance bottlenecks exist, which users are most impacted, and which faults break your code for your frontend, backend, and infrastructure, which can be advantageous to your business.
If you haven't tried Atatus yet, you can do so for free for 14 days.
#1 Solution for Logs, Traces & Metrics
![]() APM
APM
![]() Kubernetes
Kubernetes
![]() Logs
Logs
![]() Synthetics
Synthetics
![]() RUM
RUM
![]() Serverless
Serverless
![]() Security
Security
![]() More
More