Observability vs. Monitoring: Key Differences Explained (2026 Guide)
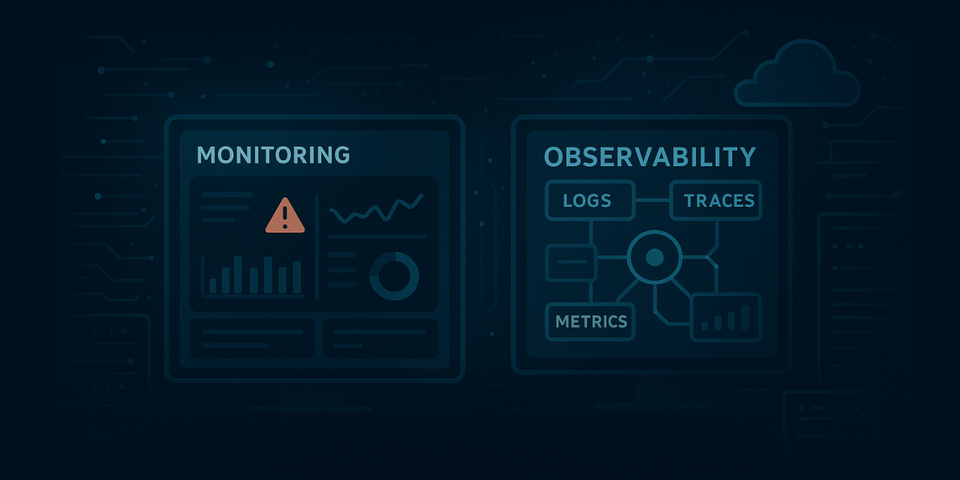
People often get confused between Monitoring and Observability, using the terms interchangeably in DevOps. However, they represent two distinct yet complementary concepts that play a crucial role in ensuring application reliability and performance.
As modern applications evolve, over 90% of new digital services are built using microservices and cloud-native architectures. Traditional monitoring alone can’t provide full visibility into distributed systems.
In this blog, lets break down the key differences between monitoring and observability and why understanding both is essential for maintaining seamless application performance.
In this blog post,
- What is Monitoring?
- What is Observability?
- Observability vs. Monitoring: What are the Similarities?
- Observability vs. Monitoring: What’s the difference?
- Observability vs Monitoring: Use Cases
What is Monitoring?
Monitoring is the systematic process of collecting and analysing telemetry data such as metrics, logs, and events, from infrastructure, applications, and network components to detect and alert on known performance or availability issues.
It relies on predefined thresholds and KPIs (like response time, CPU utilisation, request throughput, or error rate) to determine the system’s operational health.
Example: If the average response time of an API exceeds 500 ms or error rate goes above 2%, monitoring systems trigger an alert for immediate investigation.
By continuously collecting real-time telemetry and applying threshold-based alerting, monitoring enables early anomaly detection, helping teams maintain system uptime and adhere to defined service-level objectives (SLOs).
Benefits Of Monitoring
- Reduces costs: Identifying and resolving issues early minimizes downtime and prevents costly failures.
- Boosts productivity: Monitoring can reveal inefficiencies and help employees and managers optimize workloads and time management.
- Optimizes resources: By tracking the use of resources, monitoring helps ensure they are utilized efficiently.
- Enhances security: Continuous monitoring helps detect security threats and vulnerabilities in real-time, reducing the risk of breaches and insider threats.
- Increases accountability: It provides a transparent record of activity, which can make it easier to track individual and team performance and ensure accountability.
What is Observability?
Observability refers to the system’s capability to expose its internal state and explain behavior through the data it continuously emits, primarily in the form of logs, metrics, and traces.
It enables engineers to understand, debug, and optimise distributed systems without manually instrumenting every potential failure path.
Example: If there is a sudden spike in latency, observability tools can track a user request across all connected microservices and identify exactly where the slowdown happens. for example, a delayed database query in one service.
Observability gives teams a clear view of how their systems behave in real time. It helps find the root cause faster, reduce downtime (MTTR), and improve collaboration between developers, DevOps engineers, and SREs.
Benefits Of Observability
- Faster troubleshooting: Pinpoints the root cause of issues more quickly by providing deep visibility into system behavior, which reduces mean time to resolution (MTTR).
- Proactive issue detection: Identifies anomalies and potential problems before they become user-facing issues.
- Improved performance: Helps resolve performance bottlenecks, leading to faster load times and smoother transactions.
- Enhanced reliability: Helps build more resilient cloud and hybrid environments by providing insights into system performance.
- Better user experience: Creates a more seamless experience for customers by minimizing disruptions and downtime.
- Reduced costs: Lowers operational expenses by reducing the time and resources spent on troubleshooting and problem-solving.
- Improved efficiency: Increases developer productivity by providing them with contextualized data to debug issues faster and optimize workflows.
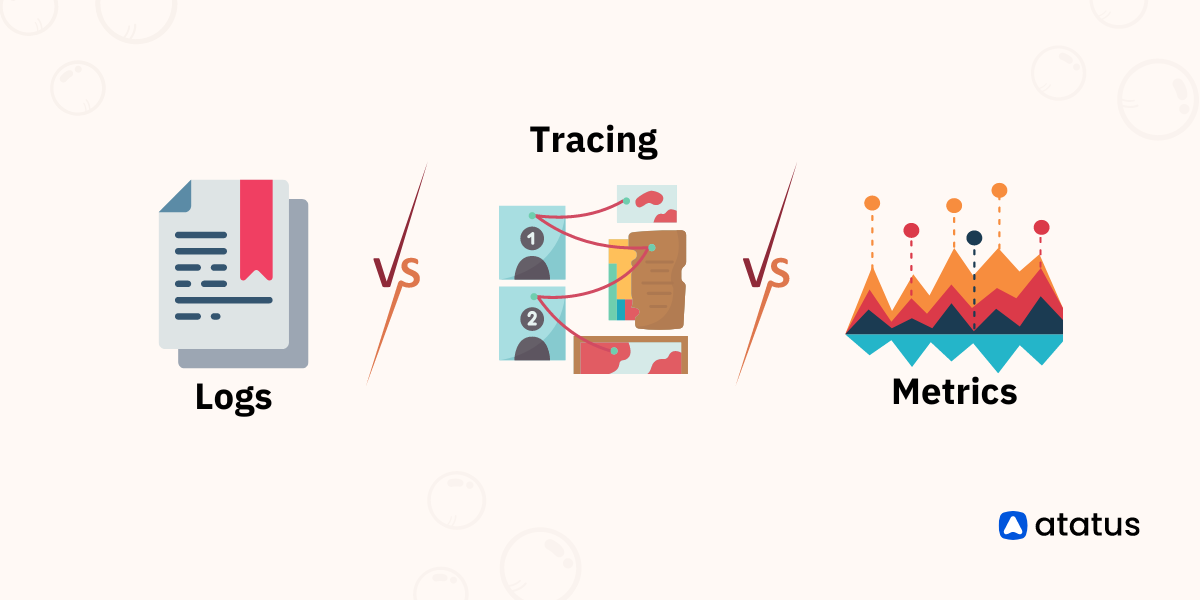
Three Pillars of Observability
Observability helps you understand why a system behaves a certain way by collecting and analyzing three key types of telemetry data, logs, metrics, and traces. Together, these pillars give complete visibility into performance, reliability, and user experience.
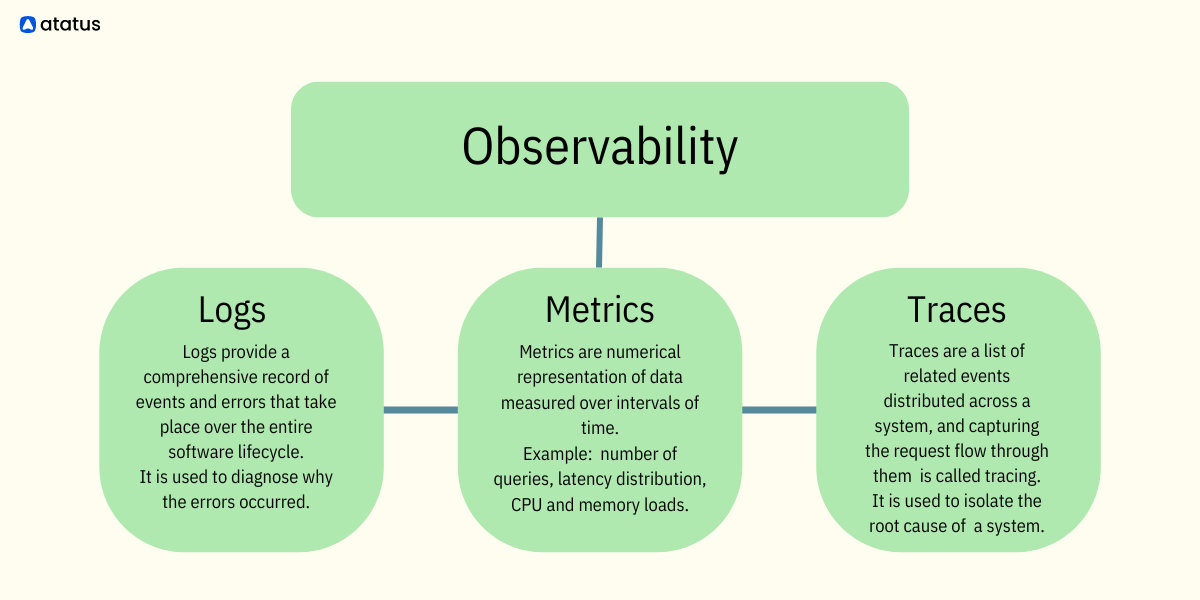
Logs
Logs consist of detailed records of events, activities, and transactions occurring within a system. They capture valuable information such as user interactions, system errors, application events, and infrastructure changes. Logs serve as a chronological record of system activity, enabling developers and operators to troubleshoot issues, trace the root cause of problems, and gain visibility into the inner workings of the system.
Metrics
Metrics are quantitative measurements that track the performance and behavior of a system over time. These measurements include key performance indicators (KPIs), such as response times, error rates, and resource utilization. Metrics help identify deviations from expected behavior. Metrics are quantifiable data of how a system or software works. This can include response time, error rates, throughput, and resource utilization. Metrics help in understanding the overall health and efficiency of a system by providing objective indicators of its performance.
Traces
Tracing involves following the flow of requests or transactions as they traverse through a distributed system. Traces provide visibility into the end-to-end journey of a request, highlighting dependencies, latency, and potential bottlenecks. By correlating traces with logs and metrics, organizations can gain a holistic understanding of system interactions and diagnose complex issues more effectively.
Also read - Logging, Traces, and Metrics: What is the difference?
Why These Three Pillars of Observability Matter?
When combined, logs, metrics, and traces give you a complete, correlated view of your system.
- Metrics alert you that something is wrong.
- Traces show where the issue is happening.
- Logs explain why it happened.
Together, these three pillars transform raw telemetry into actionable insight, enabling faster root cause analysis, reduced downtime, and improved system reliability.
Observability vs. Monitoring: What are the Similarities?
Both Monitoring and Observability aim to inform about system health and behaviour. While monitoring focuses on the metrics alone, observability goes a step further and includes details about where these metrics occurred and how they affect other components of the system.
They aim to generate insights into system health, performance, and reliability, aiding in issue detection and operational support. By integrating both practices, organizations can achieve a comprehensive approach to system management, ensuring operational excellence and addressing a wide range of operational challenges effectively.
Observability vs. Monitoring: What’s the difference?
| Aspect | Monitoring | Observability |
|---|---|---|
| Definition | Collecting and analyzing predefined telemetry (mainly metrics and logs) to detect known issues and trigger alerts. | The ability to infer internal system state from emitted telemetry (metrics, logs, traces) to investigate unknown problems and explain behaviour. |
| Primary Focus | Detection — identifying known issues such as downtime, latency, or SLA breaches. | Diagnosis — understanding why an issue occurred through correlated telemetry data. |
| Telemetry Emphasis | Metrics (time-series), basic logs, and health checks. | Metrics, rich structured logs, and distributed traces for deep visibility. |
| Approach | Rule-based alerts and dashboards for known issues. | Exploratory analysis and correlation for unknown issues. |
| When It Helps | Detecting outages, threshold breaches, and capacity issues. | Understanding complex failures and performance bottlenecks across services. |
| Typical Outputs | Alerts, time-series graphs, and uptime reports. | Correlated traces, contextual logs, and dependency graphs. |
| Examples / Tools | Prometheus, Grafana, Nagios, basic APM alerts. | OpenTelemetry,Dynatrace, Atatus, Datadog, New Relic. |
| Who Benefits | On-call engineers and operations teams focused on uptime. | Developers, DevOps engineers, and SREs investigating complex failures. |
| Limitations | Limited to predefined metrics, can miss unknown issues. | Requires rich instrumentation and higher data management overhead. |
| Business Value | Maintains uptime, reduces outages, ensures SLA compliance. | Reduces MTTR, improves reliability, and enables data-driven optimization. |
Observability vs Monitoring: Use Cases
The main difference between observability and monitoring use cases lies in scope.
Use Cases of Monitoring:
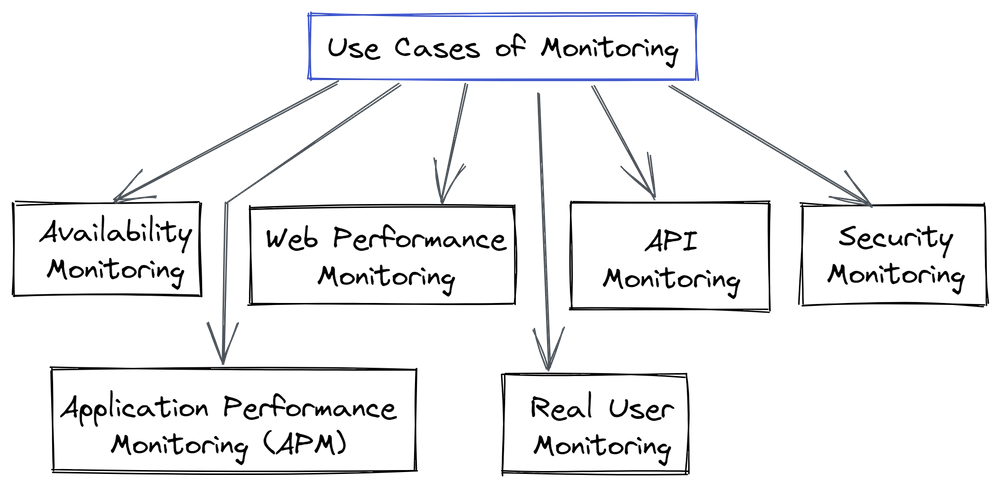
- Availability Monitoring
Tracks uptime and system health to ensure critical services remain accessible and alerts teams during outages. - Web Performance Monitoring
Measures page load times, transaction speeds, and user experience metrics to maintain frontend and backend performance. - Application Performance Monitoring (APM)
Monitors application-level metrics such as response time, throughput, and error rates to maintain high service quality. - API Monitoring
Ensures APIs are responsive, available, and performing within defined SLAs to support dependent services. - Real User Monitoring (RUM)
Captures live user interactions to analyze real-world performance, crashes, and latency issues. - Security Monitoring
Detects abnormal patterns or threats in data flow and access behavior to prevent security breaches.
Use Cases of Observability:

- Application Modernization: Simplifies managing complex, microservices-based, or cloud-native architectures by providing a unified view of system performance and dependencies.
- Cloud Infrastructure Visibility: Breaks down operational silos by correlating data from multiple layers, infrastructure, services, and users to detect and fix performance anomalies faster.
- Cost Optimization: Identifies overprovisioned resources, performance bottlenecks, and inefficiencies to reduce operational costs and improve resource utilization.
- Application Security: Enhances security by detecting anomalies, potential breaches, or misconfigurations in real time using logs, metrics, and traces.
#1 Solution for Logs, Traces & Metrics
![]() APM
APM
![]() Kubernetes
Kubernetes
![]() Logs
Logs
![]() Synthetics
Synthetics
![]() RUM
RUM
![]() Serverless
Serverless
![]() Security
Security
![]() More
More


![New Relic vs Splunk - In-depth Comparison [2026]](/blog/content/images/size/w960/2024/10/Datadog-vs-sentry--19-.png)