Kibana vs Grafana: Battle Of the Dashboards

Every day, we generate tons of data, so much so that we cannot analyze them manually anymore. Visualization is a process by which the generated data will be broken down into smaller packages.
Visualization extensively relies on observability and the triumvirate of Logs, Metrics and Traces. When it comes to visualizations and dashboards, Kibana and Grafana are two prominent names in the market. What makes them stand apart from their peers is their ability to conceive top-notch analytics charts.
Let’s look at how they fair in other parameters. This will assist you in making an informed choice in the future.
Table Of Contents:
What is Kibana?
Kibana is an open-source data visualization and exploration tool specifically designed to work with the Elastic Stack.
As part of its tight integration with Elasticsearch, it is a primary interface for interacting with and analyzing the data stored in Elasticsearch, as well as providing a way of finding complex data through it.
Kibana’s core feature is querying. Users can search for specific data or strings within their dataset for root cause analysis and further diagnosis.
What is Grafana?
Grafana is an open-source analytics and monitoring platform that supports multiple data sources. It provides a unified platform for creating, sharing, and exploring interactive and customizable dashboards. Grafana started out as a branching off kibana where it was able to support metrics from the beginning while kibana was not able to do so.
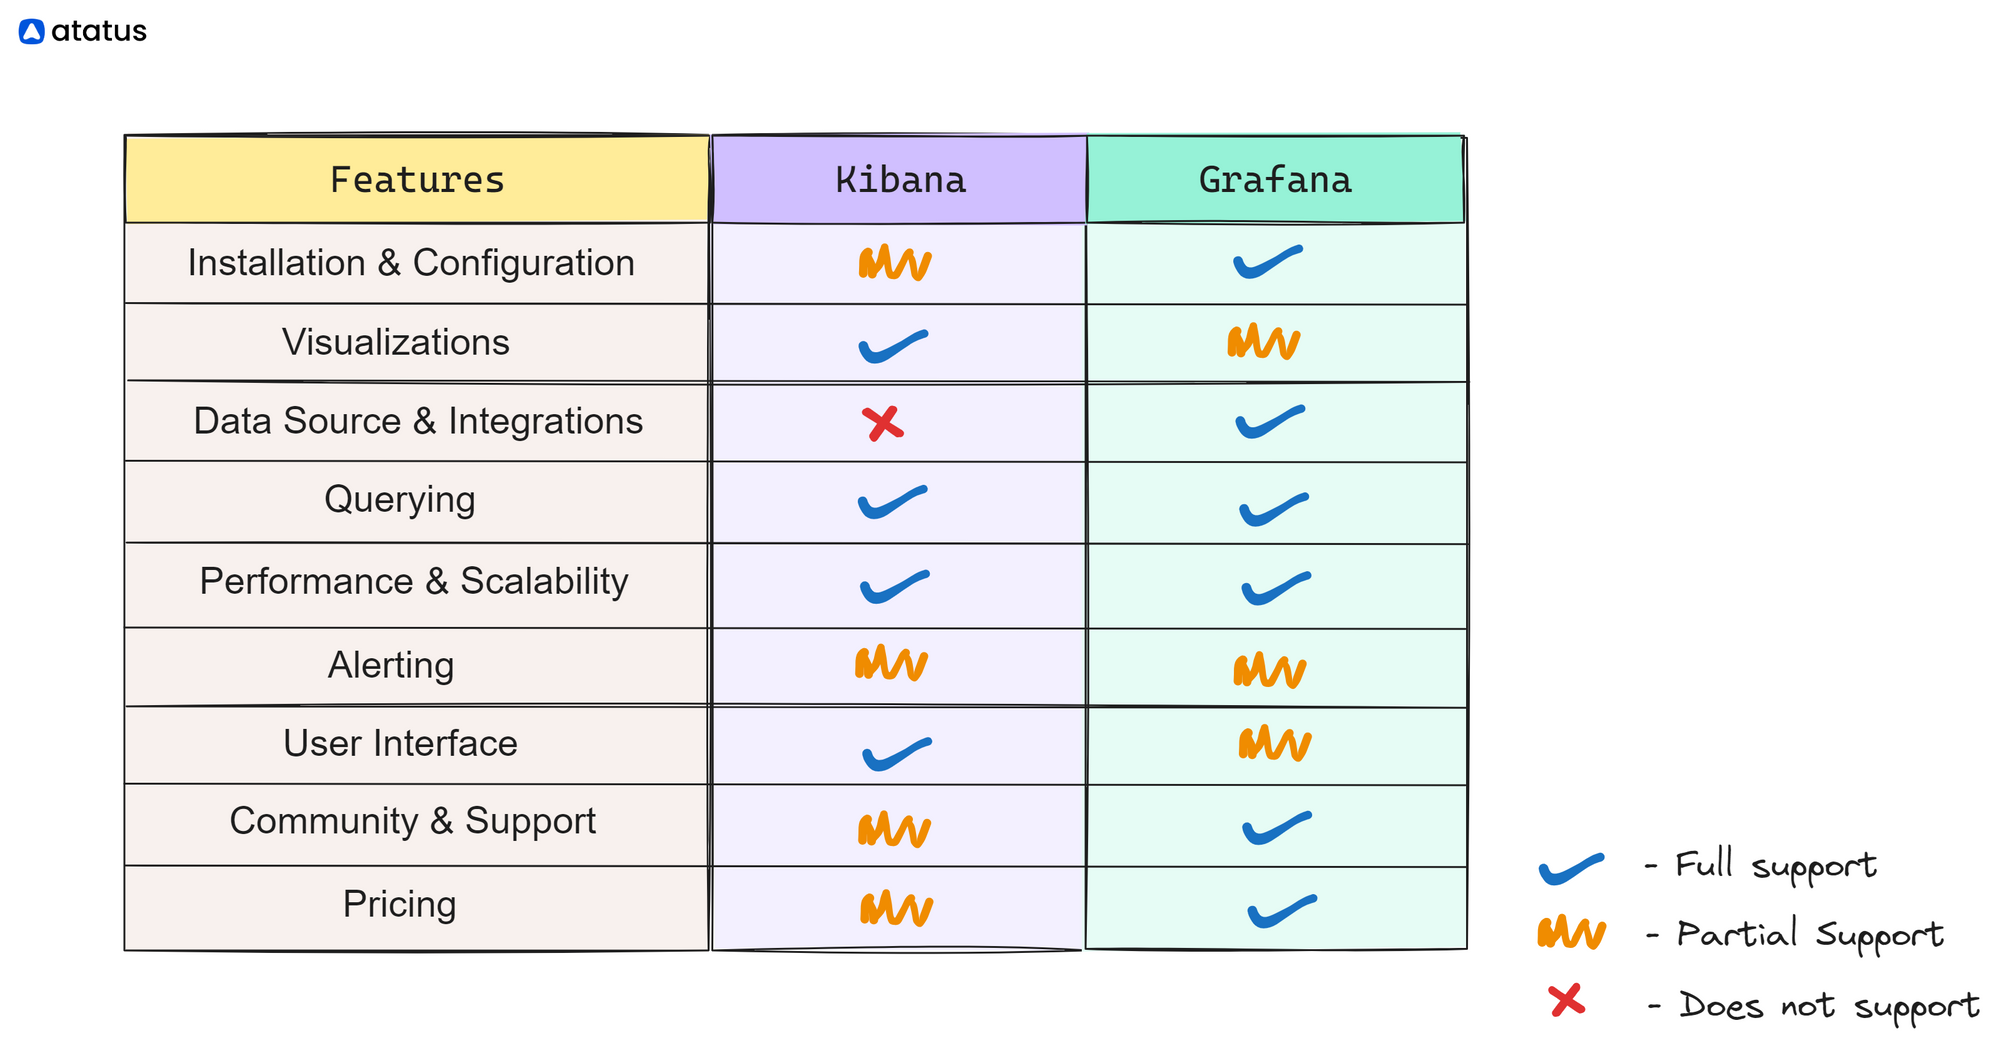
Kibana vs Grafana
1. Setup, Installation, and Configuration
Kibana:
Kibana is part of the Elastic Stack, and its installation and configuration are often done alongside Elasticsearch. It has its configuration settings, and the setup process involves configuring connections to Elasticsearch indices.
Grafana:
Grafana is a standalone application that supports various data sources, including Elasticsearch. It is relatively easy to install and configure, and users can connect it to different data sources based on their requirements. After installation, start the Grafana server. The default port is 3000.
2. Visualization and Dashboards
Kibana:
Kibana specializes in visualizing data stored in Elasticsearch. It offers a wide range of pre-built visualizations and the ability to create customized dashboards. The focus is often on log and event data visualization. Kibana allows users to create a wide range of visualizations such as bar charts, line graphs, pie charts, maps, and more. These visualizations help users gain insights from their data.
Grafana:
Grafana supports multiple data sources, including Elasticsearch, Prometheus, InfluxDB, and more. It provides a flexible and extensive set of visualization options, making it suitable for various use cases beyond log and event data.
3. Data Sources and Integrations
Kibana:
Kibana is tightly integrated with Elasticsearch, and it works seamlessly with data stored in Elasticsearch indices. While it can be extended to work with other data sources, its primary strength lies in Elasticsearch integration.
Grafana:
Grafana is known for its broad range of data source support. It can integrate with databases, time-series databases, and various other data storage solutions, making it versatile for different monitoring and analytics scenarios.
4. Querying and Filtering Data
Kibana:
Kibana uses the Lucene Query Language and Elasticsearch Query DSL for querying data. It provides a user-friendly interface for searching and filtering data. It can be used for full-text search as well as structured queries.
Grafana:
Grafana allows users to create queries using its Query Editor. It supports different query languages depending on the data source, such as PromQL for Prometheus.
5. Performance and Scalability
Kibana:
Kibana's performance is closely tied to the performance of Elasticsearch since it relies on Elasticsearch for data retrieval and analysis. It can scale horizontally by adding more Elasticsearch nodes.
Grafana:
Grafana's performance depends on the underlying data sources. It can handle large datasets and is scalable, but performance considerations may vary based on the chosen data source.
6. Alerts and Notifications
Kibana:
Kibana includes alerting features that allow users to set up alerts based on specific conditions or thresholds in Elasticsearch data. It provides a mechanism for notifying users when certain events occur.
Grafana:
Grafana has robust alerting capabilities that work across different data sources. Users can set up alert rules and receive notifications through various channels, such as email, Slack, or other messaging platforms.
7. User Interface and Ease of Use
Kibana:
Kibana offers a user-friendly interface with a focus on log and event data analysis. It provides a straightforward experience for users familiar with the Elastic Stack.
Grafana:
Grafana is known for its intuitive and user-friendly interface. It provides a consistent experience across different data sources and is often praised for its ease of use.
8. Community and Support
Kibana:
Kibana has a strong community and is well-supported by the Elastic community. Users can find documentation, forums, and community-contributed plugins.
Grafana:
Grafana also has a vibrant community and is widely adopted in the monitoring and analytics space. It has extensive documentation, forums, and a large number of plugins contributed by the community.
9. Pricing
Kibana:
Kibana is open-source and free to use. However, support plans and additional features may be available through Elastic's subscription plans. Kibana can only be brought along with the entire elastic stack, so it comes at a relatively higher pricing - the cheapest option starting at $95 per month.
Grafana:
Grafana is open-source and free to use. Similar to Kibana, additional enterprise features and support are available through Grafana Labs.
Grafana offers Grafana cloud products in three tiers: free, pro and advanced.
The pro version is for smaller enterprises and starts at $8 per month. They offer a volume discount pricing for advanced tier usually catering to bigger teams and needs. Advanced product pricing is not available on their website, so you can contact them on a need basis.
How to Choose One?
Choosing between Kibana and Grafana depends on specific use cases and preferences. If your primary data source is Elasticsearch and you need a tool tightly integrated with the Elastic Stack, Kibana may be the preferred choice.
If you require flexibility in data sources, extensive visualization options, and a unified platform for various monitoring scenarios, Grafana might be a better fit.
Conclusion
In conclusion, both Kibana and Grafana are powerful tools with distinct strengths.
Kibana excels in Elasticsearch-based log and event data analysis, while Grafana provides versatility and a unified platform for working with different data sources.
When considering which solution to choose, it's important to assess your organization's specific needs and budget.
Whether you're looking for a comprehensive solution with advanced analytics or a more budget-friendly option with basic monitoring capabilities, there is an alternative out there that can meet your requirements.
The choice between them should be based on the specific requirements and preferences of the user or organization.
Monitor Your Entire Application with Atatus
Atatus is a Full Stack Observability Platform that lets you review problems as if they happened in your application. Instead of guessing why errors happen or asking users for screenshots and log dumps, Atatus lets you replay the session to quickly understand what went wrong.
We offer Application Performance Monitoring, Real User Monitoring, Server Monitoring, Logs Monitoring, Synthetic Monitoring, Uptime Monitoring, and API Analytics. It works perfectly with any application, regardless of framework, and has plugins.

Atatus can be beneficial to your business, which provides a comprehensive view of your application, including how it works, where performance bottlenecks exist, which users are most impacted, and which errors break your code for your frontend, backend, and infrastructure.
If you are not yet an Atatus customer, you can sign up for a 14-day free trial.
#1 Solution for Logs, Traces & Metrics
![]() APM
APM
![]() Kubernetes
Kubernetes
![]() Logs
Logs
![]() Synthetics
Synthetics
![]() RUM
RUM
![]() Serverless
Serverless
![]() Security
Security
![]() More
More

![Splunk vs Prometheus: A Side-by-Side Comparison [2025 Guide]](/blog/content/images/size/w960/2024/08/Datadog-vs-sentry--13-.png)
![Top 10 Kibana Alternatives [2025 Guide]](/blog/content/images/size/w960/2024/11/Top-Kibana-Alternatives.png)