Kubernetes Liveness Probe Guide
Kubernetes liveness probes are a critical component for monitoring the health and availability of application containers running within a Kubernetes cluster.
They allow Kubernetes to determine whether a container is running as expected and take appropriate actions if it is found to be unresponsive or in an unhealthy state.
Liveness probes periodically check the health of containers by sending requests to a specified endpoint or executing a command within the container.
The probe results determine the container's health status, and Kubernetes uses this information to make decisions such as restarting the container or marking it as unhealthy.
To implement a liveness probe, you need to define it within the Pod specification YAML file that describes your application's deployment. Specify the probe type and its configuration under the livenessProbe section within the relevant container.
Once you have defined the liveness probe, you apply the updated Pod specification to your Kubernetes cluster using the kubectl apply command. Kubernetes periodically performs the probe checks according to the specified configuration.
If a probe fails, Kubernetes takes action based on the container's restart policy, which is typically set to restart the container. In this comprehensive guide, we will delve into the essential concept of Liveness Probes in Kubernetes, a powerful container orchestration tool.
- Understanding Kubernetes Health Checks
- Kubernetes Liveness Probe Settings
- Implementing Kubernetes Liveness Probes
Understanding Kubernetes Health Checks
Kubernetes uses health checks to ensure the availability and reliability of applications running within containers. These health checks continuously monitor the health status of containers and allow Kubernetes to take appropriate actions if an application becomes unresponsive or enters an unhealthy state.
The three types of health checks supported by Kubernetes are:
1. Liveness Probes
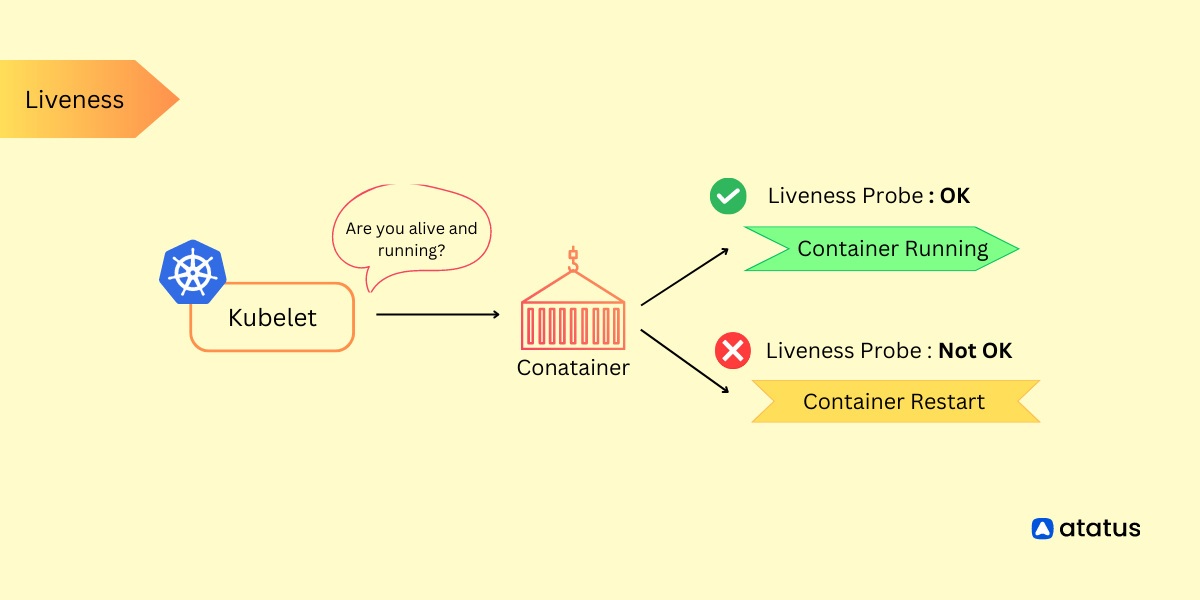
Liveness probes are responsible for determining whether a container is alive and running as expected. They help detect scenarios where an application is running, but it may not be able to handle requests correctly due to internal issues.
For instance, if the application is stuck in an infinite loop or suffering from a deadlock, a liveness probe can identify this condition and trigger a container restart to recover the application's functionality.
To implement a liveness probe, you define a periodic check that sends requests to a specified endpoint within the container. If the probe receives a successful response (HTTP status code 200-399) from the endpoint, the container is considered healthy.
However, if the probe does not receive a successful response within a predefined timeframe, the container is marked as unhealthy, prompting Kubernetes to take appropriate action based on the container's restart policy.
2. Readiness Probes
Readiness probes focus on determining whether a container is ready to handle incoming requests. They are particularly useful during the startup phase of an application when it needs some time to initialize and become fully operational.
Until the readiness probe indicates that the container is ready, Kubernetes will not send traffic to that particular pod.
Like liveness probes, readiness probes involve sending requests to a specified endpoint or executing a command within the container. If the probe receives a successful response, the container is marked as ready to receive traffic.
Conversely, if the probe fails to receive a successful response within a defined time period, the container is considered not ready, and Kubernetes removes it from the list of endpoints for the associated service, effectively stopping traffic to that container.
3. Startup Probes
Startup probes are a more recent addition to Kubernetes health checks. Their primary purpose is to determine when an application has started successfully during its startup phase.
The key difference between startup probes and readiness probes is that while a readiness probe starts as soon as the container begins running, a startup probe can be delayed, allowing the application more time to initialize.
Startup probes prove beneficial for applications that may take longer to start or need to perform time-consuming initialization tasks.
By utilizing a startup probe, you can ensure that Kubernetes only considers the container as ready when the application has successfully completed its startup process.
Kubernetes Liveness Probe Settings
Understanding the settings of a liveness probe in Kubernetes is crucial for effectively monitoring the health of your containers. The liveness probe configuration includes the following settings:
- initialDelaySeconds: The number of seconds to wait before the first liveness probe is performed after the container starts.
- periodSeconds: The number of seconds between consecutive liveness probes.
- timeoutSeconds: The number of seconds after which the liveness probe times out. If the probe takes longer than this value to return, it is considered a failure.
- successThreshold: The minimum number of consecutive successful probe results required to mark the container as healthy after having previously failed.
- failureThreshold: The number of consecutive probe failures required to mark the container as unhealthy after having previously been healthy.
- terminationGracePeriodSeconds: Defines the amount of time the kubelet (the Kubernetes node agent) should wait between triggering the shutdown of a failed container and forcefully terminating it. This period allows the container some time to clean up and terminate gracefully.
Other Liveness Probe Settings
1. Type (httpGet, tcpSocket, or exec)
httpGet: Performs an HTTP GET request to a specified endpoint in the container. The probe considers the container healthy if it receives a successful HTTP response code (2xx or 3xx).tcpSocket: Attempts to open a TCP connection to a specified port on the container. The probe considers the container healthy if the connection is successful.exec: Executes a specified command inside the container. The probe considers the container healthy if the command exits with a success status code (0).
2. HTTP GET Probe Settings (if applicable)
path: The URL path for the HTTP GET request. For example,/healthz.port: The port on which the HTTP server is listening inside the container.httpHeaders: Optional custom HTTP headers to include in the GET request.
3. TCP Socket Probe Settings (if applicable)
port: The port to which the TCP socket should attempt to connect inside the container.
4. Exec Probe Settings (if applicable)
command: The command to be executed inside the container. It should be specified as a list of strings.
Implementing Kubernetes Liveness Probes
Liveness probes are used to check if an application within a container is still running and responding as expected. If the liveness probe fails, Kubernetes will automatically restart the container, attempting to recover the application.
Here's a step-by-step guide on how to set up a liveness probe in Kubernetes:
Step 1: Define a Liveness Probe
To define a liveness probe, you need to specify the probe type and its configuration within the pod specification file. This includes details like the endpoint path or port to check, custom headers (in the case of an HTTP GET probe), or the command to execute (in the case of an exec probe).
a. HTTP GET Probe
This probe sends an HTTP GET request to a specified endpoint within the container and checks if it receives a successful response code (e.g., 200-399). It is commonly used when an application exposes an HTTP endpoint for health checks.
b. TCP Socket Probe
In this type of probe, Kubernetes attempts to open a TCP connection to a specified port on the container. If the connection is successful, the container is considered healthy. This probe is useful when an application doesn't expose an HTTP endpoint but can still accept TCP connections.
c. Exec Probe
With an exec probe, a command is executed inside the container, and the success or failure of the command determines the health status. The probe checks the exit status of the command to determine container health. It provides flexibility to run custom commands or scripts for health checks.
Once the liveness probe is defined, Kubernetes periodically performs the checks according to the specified configuration. If the probe fails (e.g., the endpoint returns an error or the TCP connection cannot be established), Kubernetes takes action based on the container's restart policy. By default, the container is restarted, but the restart policy can be customized to suit your application's requirements.
Liveness probes are crucial for ensuring the reliability and availability of applications running in Kubernetes clusters. By implementing them effectively, you can detect and recover from failures, leading to more resilient and robust deployments.
Step 2: Add Liveness Probe to your Pod Specification
Within the file, locate the "containers" section, which contains the details of the container running your application. Under the relevant container, add the livenessProbe section to specify the liveness probe configuration.
First, choose the appropriate probe type based on your application's requirements. Let's consider an example using an HTTP GET probe. In the livenessProbe section, specify httpGet as the probe type:
livenessProbe:
  httpGet:
    <probe-specific-configuration>
Next, define the probe-specific configuration parameters. For the HTTP GET probe, you need to specify the path and port where Kubernetes will send the GET request to check the health of your application. For instance:
livenessProbe:
  httpGet:
    path: /healthz
    port: 8080
Here, Kubernetes will perform an HTTP GET request to the /healthz endpoint on port 8080 within the container.
You can also add optional custom HTTP headers if needed. For example:
livenessProbe:
  httpGet:
    path: /healthz
    port: 8080
    httpHeaders:
      - name: Custom-Header
        value: Some-Value
Save the modified file and apply the changes to your Kubernetes cluster using the kubectl apply command:
kubectl apply -f your-pod-specKubernetes will create or update the pod based on the updated configuration, including the liveness probe.
Once applied, Kubernetes will periodically perform the liveness probe checks according to the specified configuration. If the probe fails, Kubernetes takes action based on the container's restart policy. By default, the container is restarted after a liveness probe failure.
To monitor the status of the liveness probe, you can use the kubectl describe pod command to obtain detailed information about the pod's conditions.
Step 3: Specify Probe Configuration
When adding a liveness probe to your Pod specification in Kubernetes, you need to specify the probe configuration parameters according to the chosen probe type.
For an HTTP GET probe, you need to provide the path and port parameters. The path specifies the endpoint within the container that Kubernetes will hit with an HTTP GET request to check the health. For example:
livenessProbe:
  httpGet:
    path: /healthz
    port: 8080
Complete Example:
apiVersion: v1
kind: Pod
metadata:
  name: my-app
spec:
  containers:
    - name: my-app-container
      image: my-app-image
      ports:
        - containerPort: 8080
      livenessProbe:
        httpGet:
          path: /healthz
          port: 8080
        initialDelaySeconds: 15
        periodSeconds: 10
In this case, Kubernetes will send an HTTP GET request to the /healthz path on port 8080 to determine the health of the container.
Additionally, you can include custom HTTP headers by adding the httpHeaders section. This is useful when your application expects specific headers for health checks. Here's an example:
livenessProbe:
  httpGet:
    path: /healthz
    port: 8080
    httpHeaders:
      - name: Custom-Header
        value: Some-Value
Complete Example:
apiVersion: v1
kind: Pod
metadata:
  name: my-app
spec:
  containers:
    - name: my-app-container
      image: my-app-image
      ports:
        - containerPort: 8080
      livenessProbe:
        httpGet:
          path: /healthz
          port: 8080
          httpHeaders:
            - name: Custom-Header-1
              value: Value-1
            - name: Custom-Header-2
              value: Value-2
        initialDelaySeconds: 15
        periodSeconds: 10
Here, a custom header named Custom-Header with the value Some-Value will be included in the HTTP GET request.
For a TCP Socket probe, you only need to specify the port parameter. Kubernetes will attempt to open a TCP connection to the specified port to check the container's health. For instance:
livenessProbe:
  tcpSocket:
    port: 8080
Complete Example:
apiVersion: v1
kind: Pod
metadata:
  name: my-app
spec:
  containers:
    - name: my-app-container
      image: my-app-image
      ports:
        - containerPort: 8080
      livenessProbe:
        tcpSocket:
          port: 8080
        initialDelaySeconds: 15
        periodSeconds: 10
This configuration instructs Kubernetes to establish a TCP connection with the container on port 8080.
With an Exec probe, you can run a specific command inside the container to determine its health. Specify the command parameter with the desired command or script. For example:
livenessProbe:
  exec:
    command:
      - cat
      - /tmp/health
In this case, Kubernetes will run the cat /tmp/health command inside the container.
Complete Example:
apiVersion: v1
kind: Pod
metadata:
  name: my-app
spec:
  containers:
    - name: my-app-container
      image: my-app-image
      ports:
        - containerPort: 8080
      livenessProbe:
        exec:
          command:
            - sh
            - -c
            - curl -sS http://localhost:8080/healthz || exit 1
        initialDelaySeconds: 15
        periodSeconds: 10
Once you have defined the probe configuration, save the file and apply the changes to your Kubernetes cluster. Kubernetes will periodically perform the liveness probe checks according to the specified configuration.
Monitoring the liveness probe status can be done using the `kubectl describe pod` command. Look for the Liveness section in the output, which indicates the current status of the liveness probe.
By correctly specifying the probe configuration, you enable Kubernetes to effectively monitor and manage the health of your application containers.
Step 4: Apply the Updated Configuration
To apply the updated configuration with the liveness probe in Kubernetes, you need to follow these steps:
1. Save the modified YAML file containing the updated Pod specification with the liveness probe configuration.
2. Open a terminal or command prompt and ensure that you are connected to the Kubernetes cluster using the kubectl command-line tool.
3. Navigate to the directory where the modified YAML file is located.
4. Use the kubectl apply command to apply the changes to the Kubernetes cluster. Run the following command, replacing your-pod-spec.yaml with the actual filename:
kubectl apply -f your-pod-spec.yamlKubernetes will read the YAML file, identify the changes, and update the corresponding resources. In this case, it will update the Pod with the new liveness probe configuration.
5. Once the kubectl apply command is executed, Kubernetes starts applying the changes. It creates or updates the Pod based on the updated configuration.
6. To verify that the changes have been applied successfully, you can use various `kubectl` commands. For example:
Run kubectl get pods to view the list of pods and check the status of the updated Pod.
Use kubectl describe pod <pod-name> to get detailed information about the Pod, including the liveness probe status.
It may take a few moments for the changes to propagate and the Pod to transition to the desired state.
7. Monitor the liveness probe status to ensure that it is working as expected. If the liveness probe fails, Kubernetes will take action based on the Kubernetes pod restart policy, which is typically set to restart the container. You can check the status of the liveness probe by inspecting the events or conditions of the Pod using the kubectl describe podcommand.
Step 5: Monitor Liveness Probe Status
1. Open a terminal or command prompt and ensure that you are connected to the Kubernetes cluster using the kubectl command line tool.
2. Run the following command to get a list of all the pods in your cluster:
kubectl get podsThis command will display the names of the pods along with their current status, such as Running, CrashLoopBackOff, or Error.
3. Identify the name of the specific pod for which you want to monitor the liveness probe status.
4. Use the following command to get detailed information about the pod, including its conditions, events, and the status of the liveness probe:
kubectl describe pod <pod-name>Replace <pod-name> with the name of your pod.
5. The output of the kubectl describe pod command will provide you with detailed information about the pod's current state. Look for the `Liveness` section, which indicates the status of the liveness probe.
The Liveness section will show whether the liveness probe is currently passing or failing. If the probe is failing, it may indicate that the container is unresponsive or in an unhealthy state.
6. Additionally, you can use the following command to view the events associated with the pod:
kubectl get events --field-selector involvedObject.name=<pod-name>Replace <pod-name> with the name of your pod. This command will display any events related to the pod, including information about liveness probe failures or restarts.
By monitoring the liveness probe status and reviewing the events and conditions of the pod, you can gain insights into the health and availability of your application containers in the Kubernetes cluster. This information helps you identify any issues and take appropriate actions, such as troubleshooting or scaling the application as needed.
Conclusion
Liveness probes are crucial in Kubernetes for maintaining application reliability. They check if containers are running properly, helping detect unresponsiveness or invalid states. With HTTP GET, TCP Socket, and Exec probes, you can choose the best method to verify container health.
Defining liveness probes requires specifying probe types and configurations. For HTTP GET, set the path and port to check an endpoint. TCP Socket probes need only the port, while Exec probes require a command or script to execute within the container.
Monitoring liveness probe status is simple with kubectl describe pod command. Detecting failures promptly allows Kubernetes to take action based on the container restart policy, ensuring quick recovery and promoting application stability.
By implementing and monitoring liveness probes effectively, you ensure continuous availability and responsiveness of applications. Kubernetes' ability to manage container health reduces downtime and enhances user experience in your cluster. Customizing restart policies further tailors the response to suit your application's specific needs.
Atatus Kubernetes Monitoring
With Atatus Kubernetes Monitoring, users can gain valuable insights into the health and performance of their Kubernetes clusters and the applications running on them. The platform collects and analyzes metrics, logs, and traces from Kubernetes environments, allowing users to detect issues, troubleshoot problems, and optimize application performance.
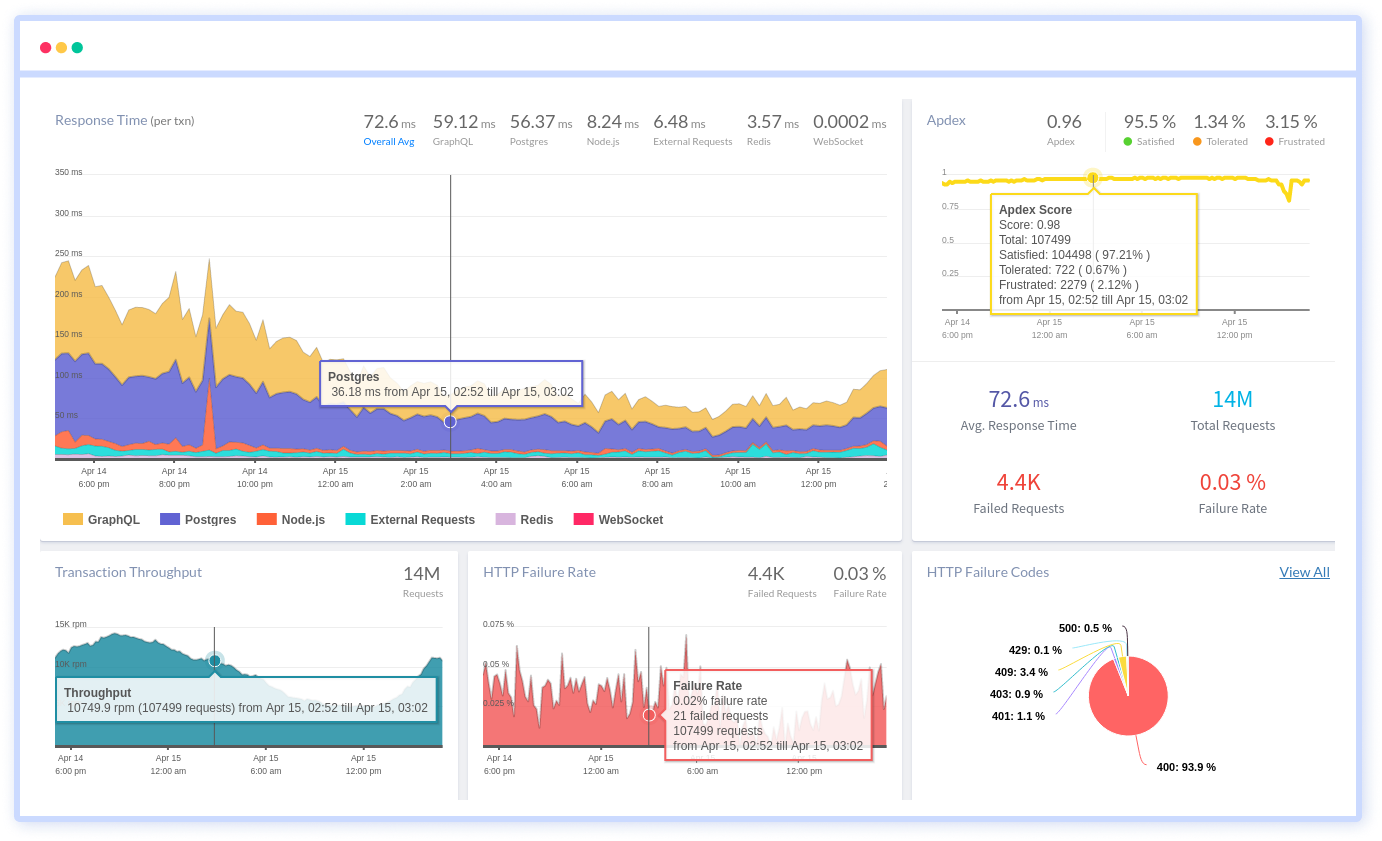
You can easily track the performance of individual Kubernetes containers and pods. This granular level of monitoring helps to pinpoint resource-heavy containers or problematic pods affecting the overall cluster performance.
#1 Solution for Logs, Traces & Metrics
![]() APM
APM
![]() Kubernetes
Kubernetes
![]() Logs
Logs
![]() Synthetics
Synthetics
![]() RUM
RUM
![]() Serverless
Serverless
![]() Security
Security
![]() More
More