Understanding Linux Logs: 16 Linux Log Files You Must be Monitoring

Logging provides a wealth of information about system events, errors, warnings, and activities.
When troubleshooting issues, logs can be invaluable for identifying the root cause of problems, understanding the sequence of events leading to an issue, and determining the necessary steps for resolution.
By regularly analyzing logs, administrators can identify performance bottlenecks, resource limitations, and abnormal system behavior. They capture security-related events such as authentication attempts, access control violations, system breaches, or suspicious activities.
Logs provide an audit trail that helps establish accountability and governance within an organization. By tracking user activities, system changes, and administrative actions, logs can assist in identifying unauthorized or inappropriate actions, ensuring compliance with organizational policies, and facilitating accountability among system users and administrators.
Table Of Contents
- What are Linux Logs?
- Key Aspects Of Linux Logging
- Log Sources on Linux
- Top Log Files to Monitor in Linux
- Importance of Monitoring Linux Logs
- Linux Log Storage
- How can I view Linux Logs?
- Centralizing Linux Logs
What are Linux logs?
Linux logs are records of system activities and events generated by various software components and services running on a Linux operating system.
In Linux, the logging mechanism is typically handled by the system's logging daemon, which is responsible for receiving log messages from different sources and writing them to log files. The most commonly used logging daemon in Linux distributions is rsyslog or its predecessor syslogd.
These logs provide valuable information for system administrators, developers, and security professionals to diagnose issues, monitor system health, and analyze system behavior.
Key aspects of Linux Logging
Logging is not just amassing all the input and output commands and the data retrieved thereon, it can be systemized for ease of understanding and for further analysis.
1. Log Levels
Log messages are often assigned different levels to indicate their severity or importance. Common log levels include:
- Emergency - The most critical level that indicates a system is unusable.
- Alert - Indicates an immediate action is required.
- Critical - Indicates a critical condition that requires attention.
- Error - Indicates an error condition that needs to be addressed.
- Warning - Indicates a potential issue or something worth noting.
- Notice - Indicates normal but significant events.
- Info - General informational messages.
- Debug - Detailed debugging information.
2. Log Facilities
Log facilities categorize logs based on the software or subsystem that generates them. Some common facilities include auth, cron, mail, kernel, syslog, daemon, and local0 to local7. Facilities help in organizing and filtering logs.
3. Log Files
Linux logs are typically stored in the /var/log directory or its subdirectories. The exact location and naming conventions of log files can vary across different distributions and software components. Common log files include syslog, auth.log, kern.log, messages, secure, apache2/error.log, and mysql/error.log.
4. Log Rotation
To manage log file sizes and prevent them from consuming excessive disk space, Linux provides log rotation utilities. These utilities automatically archive and rotate log files based on specified criteria such as size, time, or number of entries. The most commonly used log rotation tool in Linux is logrotate.
Log Sources on Linux
Linux collects logs from various places. Depending on these places, they are suitably named:
- System Logs - These logs contain information about the overall system operation, such as boot messages, hardware events, kernel messages, and system service status.
- Application Logs - Application-specific logs are generated by individual software applications installed on the Linux system. These logs may contain application-specific messages, errors, warnings, or debug information. The location and format of these logs vary depending on the application.
- Security Logs - Security logs record information related to system security events, including login attempts, authentication failures, system access attempts, and other security-related activities.
- Web Server Logs - Web server logs contain information about web server activities, such as HTTP requests, response codes, access logs, and error logs.
- Database Logs - Database management systems like MySQL or PostgreSQL generate logs that provide insights into database activities, errors, queries, and performance-related events.
Top Log Files to Monitor in Linux
In Linux, there are several important files and directories that are commonly monitored for various purposes, including system monitoring, security monitoring, and troubleshooting.
Here are some key files and directories that are often monitored:
| S.No. | Files | Purpose |
|---|---|---|
| 1 | /var/log/syslog | General system-wide event logs |
| 2 | /var/log/kern.log | Kernel-specific messages |
| 3 | /var/log/boot.log | Logs related to system boot processes |
| 4 | /var/log/auth.log | Records authentication-related events, such as user logins and system authentication attempts |
| 5 | /var/log/dpkg.log | Logs package installation, removal, and modification actions performed with the APT package manager |
| 6 | /var/log/dmesg | Kernel ring buffer logs that contain information about hardware and device drivers |
| 7 | /var/log/iptables.log | Logs generated by the iptables firewall tool |
| 8 | /var/log/apache2/access.log | Records HTTP requests made to the Apache web server |
| 9 | /var/log/apache2/error.log | Contains error messages and warnings from the Apache web server |
| 10 | /var/log/mysql/error.log | Logs MySQL database server errors and warnings |
| 11 | /var/log/postgresql/postgresql-X.X-main.log | PostgreSQL database server logs (X.X represents the version number) |
| 12 | /var/log/mail.log | Logs mail server activity, including sending, receiving, and delivery of emails |
| 13 | /var/log/auth.log | Records authentication-related events, including failed login attempts |
| 14 | /var/log/secure | Security-related events and authentication logs on some Linux distributions (e.g., CentOS/RHEL) |
| 15 | /var/log/cron.log | Logs cron job execution and related information |
| 16 | /var/log/daemon.log | Records events and errors related to system daemons |
These are just some examples of files and directories that are commonly monitored. The specific files to monitor may vary depending on the Linux distribution, the installed software components, and the monitoring requirements of the system.
Importance of Monitoring Linux Logs
Monitoring Linux log files is crucial for several reasons:
- System Troubleshooting: Logs help in diagnosing and troubleshooting issues within the Linux system. By examining the logs, administrators can identify errors, warnings, or abnormalities that may be impacting the system's performance or functionality.
- Error Detection and Diagnosis: Linux log files contain error messages and stack traces that can help identify software bugs, configuration issues, or compatibility problems. Monitoring log files allows you to promptly detect and diagnose errors, enabling you to take corrective actions and minimize downtime.
- Resource Usage Analysis: Log files provide insights into resource utilization, such as CPU, memory, disk I/O, and network activity. Monitoring these logs helps identify resource-intensive processes or services, enabling you to optimize resource allocation, troubleshoot performance bottlenecks, and ensure efficient utilization of system resources.
- Dependency Tracking: Log files can reveal dependencies and interactions between different components or services in a Linux system. By monitoring logs, you can track the flow of information, identify interdependencies, and understand how changes in one component may affect others. This aids in troubleshooting complex issues and maintaining system integrity.
- Security Incident Response: Log files are a critical source of information for security incident response and forensic analysis. Monitoring logs enables you to detect and investigate security breaches, identify the extent of the compromise, and determine the actions taken by malicious actors. It helps in incident containment, recovery, and the prevention of future security incidents.
- Performance Monitoring and Capacity Planning: Log files contain performance-related metrics, such as response times, throughput, and latency. Monitoring these logs allows you to analyze system performance, identify performance degradation, and plan for future capacity needs. It assists in optimizing system resources, ensuring scalability, and meeting performance expectations.
- Compliance and Auditing: Monitoring log files is essential for regulatory compliance and auditing purposes. Compliance requirements often mandate the retention and analysis of log data to ensure accountability, track user activities, and maintain data integrity. Monitoring logs helps in demonstrating compliance with industry-specific regulations and security standards.
- Proactive Issue Detection: By continuously monitoring log files, you can identify patterns or trends that indicate potential issues or anomalies before they manifest as critical problems. Proactively detecting and addressing such issues helps in maintaining system stability, minimizing service disruptions, and improving overall system reliability.
Linux Log Storage
In Linux, logs are typically stored in the /var/log directory or its subdirectories. The specific location and naming conventions of log files can vary depending on the Linux distribution and the software components installed on the system.
Some of the common log file locations:
/var/log/syslogor/var/log/messages: These files contain general system log messages, including kernel messages and system service status./var/log/auth.logor/var/log/secure: These files store authentication-related events, such as login attempts, authentication failures, and user activity logs./var/log/apache2/access.logor/var/log/nginx/access.log: These files are specific to web servers like Apache or Nginx and store access logs, including information about incoming HTTP requests and response codes./var/log/mysql/error.logor/var/log/postgresql/postgresql-<version>-main.log: These files contain database-specific logs for MySQL or PostgreSQL, respectively. They can provide insights into database activities, errors, queries, and performance-related events./var/log/daemon.logor/var/log/systemd.log: These files capture logs from system daemons and services.
Additionally, some applications may have their log files stored in their respective directories. For example, a web application might have its log files located in /var/log/<application_name>/.
How can I view Linux Logs?
To view and analyze Linux logs, you can use various tools and techniques. Here are some common methods:
1. Command-Line Tools
i.) cat or less
The cat command is short for "concatenate" and is primarily used to display the entire contents of one or more files. When used with log files, cat will output the complete contents of the file onto the terminal.
For example, running the below command will display the entire content of the log file.
cat /var/log/mysql/error.log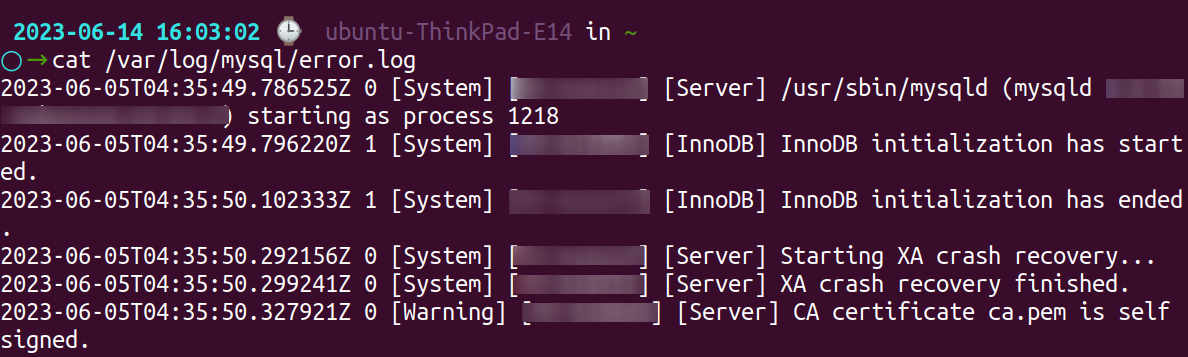
While cat is simple and straightforward, it may not be the best choice for large log files, as it displays the entire file at once. This can make it difficult to read and navigate through the file, especially if it contains a significant amount of data.
The less command is a pager utility that allows you to view file contents one screen at a time. When used with log files, less provides a more convenient way to navigate through the file. It displays the first screen of the file by default and allows you to scroll through the content using the arrow keys or other navigation commands.
less /var/log/mysql/error.log
Unlike cat, less is capable of handling large log files efficiently since it only loads and displays a portion of the file at a time. This makes it easier to search for specific entries or scroll through the log file without overwhelming the terminal.
Additionally, less provides useful features such as backward scrolling, searching for specific text, and jumping to specific line numbers within the file. These features make it a versatile tool for log file analysis and troubleshooting.
ii.) tail or head
The tail command is used to display the last few lines of a file, which is particularly useful for log files. By default, it shows the last 10 lines of the file. However, you can specify a different number of lines using the "-n" option.
For instance, the below command will display the last 20 lines of the log file.
tail -n 5 /var/log/mysql/error.log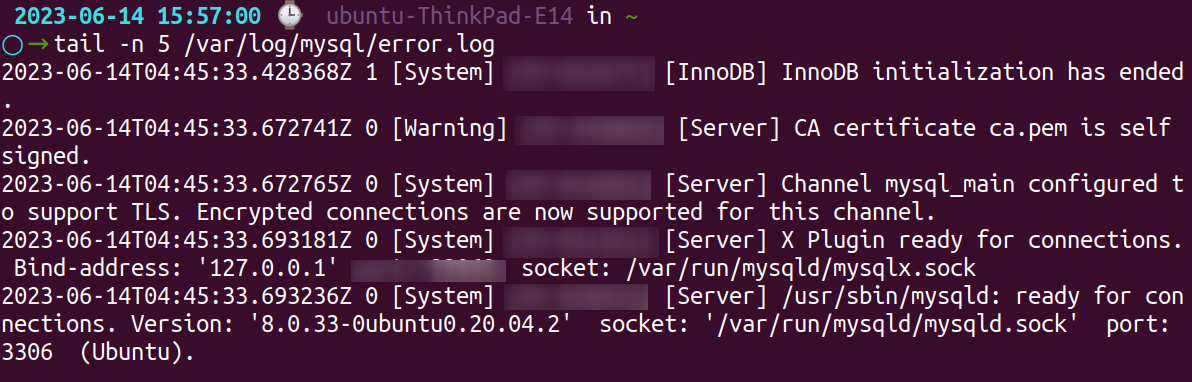
The tail command is commonly employed when monitoring real-time log updates. By combining it with the "-f" option (follow), tail continuously displays new lines appended to the file, making it ideal for tracking actively written log files.
This is particularly valuable when troubleshooting issues or monitoring live system events.
Conversely, the head command allows you to view the first few lines of a file, including log files. By default, it shows the first 10 lines. Similar to tail, you can specify the number of lines using the "-n" option.
For example, the below command will display the first 15 lines of the log file.
head -n 5 /var/log/mysql/error.log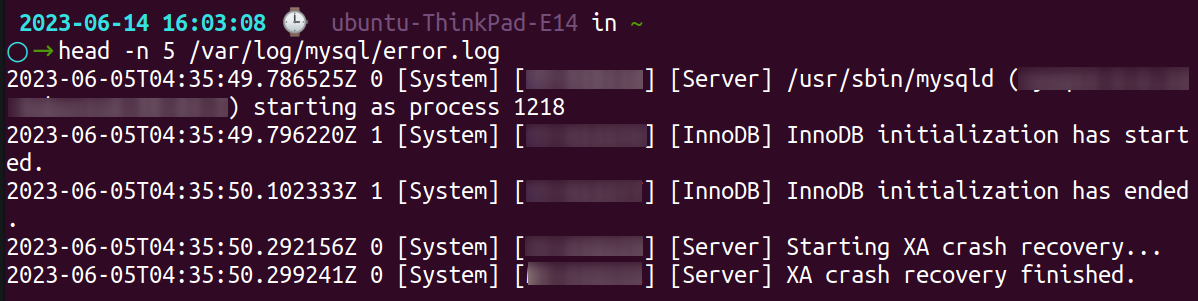
The head command is helpful when you want to quickly inspect the initial lines of a log file to gain an overview of its contents or examine recent log entries at the beginning of the file.
iii.) grep
The grep command in Linux is designed to search for specific patterns or strings within files, including log files. It follows a basic syntax of:
grep [options] pattern [file...]patternrefers to the text or regular expression you want to search for.filerepresents the name of the file or files in which you want to search. Multiple files can be specified, separated by spaces.
Execute the following command to search for error in the log file:
grep "[System]" /var/log/mysql/error.log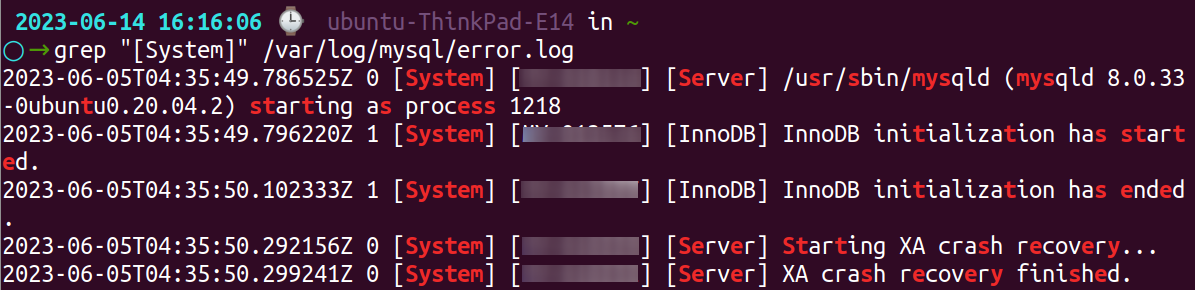
This command will display all lines in the log file that contain the word error, regardless of case sensitivity.
You can also utilize regular expressions with grep to conduct more complex searches. For instance, to search for lines containing either error or warning, you can use the following command:
grep -E "503|401" /var/log/nginx/access.logThe -E option enables extended regular expressions, and the pipe symbol | functions as the logical OR operator.
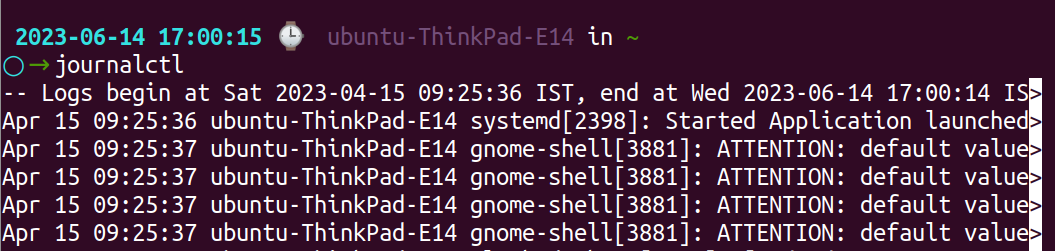
iv.) journalctl
The journalctl command in Linux is used to access and manipulate the logs generated by the systemd journal, which is the logging system used by many Linux distributions. It provides a powerful interface to view, filter, and analyze system logs.
To display the system logs, simply run the journalctl command without any options. This will show you the most recent log entries. By default, logs are displayed in a pager, allowing you to scroll through the output.
2. Log Analysis Tools
- Atatus log monitoring and management is a comprehensive logging tool that can be integrated with other third-party extensions as well as set alerts to notify of any mishaps in the system.
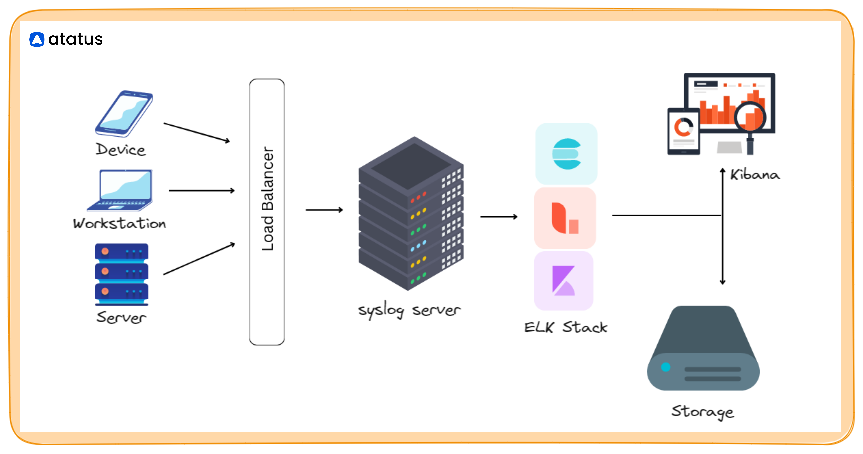
- ELK Stack allows you to centralize logs, parse and process them using Logstash, store them in Elasticsearch, and visualize and analyze the data using Kibana.
- Splunk is a commercial log analysis tool that offers powerful features for collecting, indexing, searching, and visualizing log data from various sources.
- Graylog is an open-source log management and analysis platform that provides centralized log storage, advanced search capabilities, and dashboards for visualizing log data.
3. Custom Scripts and Automation
You can create custom scripts or use automation tools like Python scripting or the bash scripting language to process log files programmatically, extract specific information, perform analysis, and generate reports.
When analyzing logs, consider looking for error messages, warning signs, unusual activity, or patterns that can help identify system issues, security breaches, or performance bottlenecks. It's essential to understand the log formats, consult documentation, and use appropriate tools to extract actionable insights from the logs.
Here's a simple example of a custom script to view a log file in Linux:
#!/bin/bash

# Define the path to the log file
LOG_FILE="/var/log/syslog.log"

# Display the log file content
echo "=== Log File: $LOG_FILE ==="
echo ""
cat "$LOG_FILE"
To use this script:
- Create a new file and give it a name (e.g.,
view_log.sh). - Copy and paste the above script into the file.
- Modify the
LOG_FILEvariable to the path of your desired log file. - Save the file and exit.
- Make the script executable by running
chmod +x view_log.sh. - Execute the script by running
./view_log.sh.
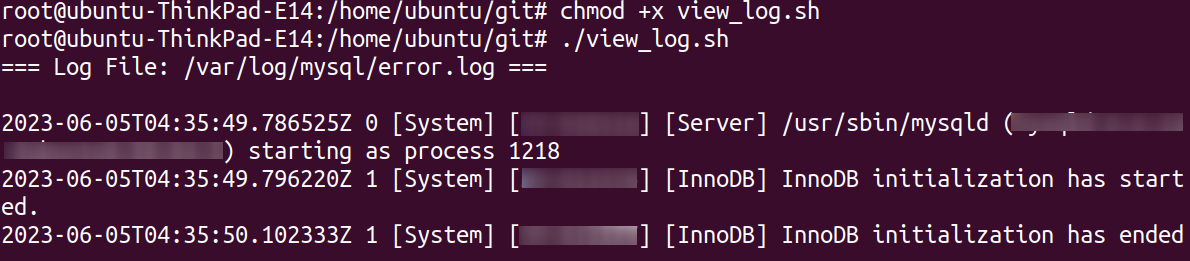
When you run the script, it will display the contents of the specified log file on the terminal, providing a simple and straightforward way to view the log file without any additional interactive features.
Centralizing Linux Logs
System logs can occur in two places - as plain text files in syslog demon or in journalctl. Logs in journalctl are forwarded to syslog. So there is usually not much problem if you have them both in your system. But if your distribution doesn't have journalctl, you will have to collect and parse data to syslog manually.
Syslog is a standard logging protocol and message format that defines how log messages are transmitted and stored. It provides a centralized mechanism for applications, services, and the operating system to send log messages to a central logging server or write them to log files on the local system.
Syslog separates log messages into facilities and levels, allowing for easy categorization and filtering. Facilities indicate the source of the log message (e.g., kernel, authentication, mail), while levels indicate the severity or importance of the message (e.g., emergency, alert, error).
rsyslog is an enhanced and modernized version of the traditional syslog daemon (syslogd). It is the default logging daemon in many Linux distributions. rsyslog offers additional features and flexibility compared to syslogd, including support for more log message formats, filtering rules, encryption, and remote logging capabilities.
rsyslog can receive log messages from various sources, such as system daemons, applications, and network devices, and then process and forward them to different destinations, including log files, remote syslog servers, databases, or log analysis tools.
systemd is a system and service manager that has become the standard initialization and management system in many modern Linux distributions. Along with its many other functions, systemd includes its own logging subsystem called the "systemd journal" or "journalctl".
The systemd journal collects and stores log messages in a binary format, offering advantages like efficient storage, automatic log rotation, and indexed searching. It integrates well with systemd's other features, such as service management and unit dependencies.
With journalctl, administrators can retrieve and analyze log data from the systemd journal. It provides powerful filtering options, including filtering by time, log levels, specific units, or even specific fields within log messages.
syslog is the standard protocol and format for logging messages in Linux systems. rsyslog is an enhanced syslog daemon that extends its capabilities. systemd incorporates its own logging subsystem called the systemd journal, which integrates well with systemd's service management features and provides efficient log storage and retrieval through the journalctl command.
Conclusion
In summary, Linux logs play a vital role in the functioning of a Linux system. They store important information about system events, errors, and security incidents. Monitoring these logs is crucial for proactive issue detection and resolution.
By keeping a close eye on the logs, you can identify and address problems before they escalate into more severe issues. Given the increasing number of cybersecurity threats and breaches, log monitoring has become even more significant.
It enables you to analyze the logs, detect potential threats, and take appropriate actions to safeguard your system. Therefore, it is essential to establish a robust log monitoring system and regularly review the logs to ensure the security and stability of your Linux environment.
Atatus Logs Monitoring and Management
Atatus offers a Logs Monitoring solution which is delivered as a fully managed cloud service with minimal setup at any scale that requires no maintenance. It monitors logs from all of your systems and applications into a centralized and easy-to-navigate user interface, allowing you to troubleshoot faster.

We give a cost-effective, scalable method to centralized logging, so you can obtain total insight across your complex architecture. To cut through the noise and focus on the key events that matter, you can search the logs by hostname, service, source, messages, and more. When you can correlate log events with APM slow traces and errors, troubleshooting becomes easy.
#1 Solution for Logs, Traces & Metrics
![]() APM
APM
![]() Kubernetes
Kubernetes
![]() Logs
Logs
![]() Synthetics
Synthetics
![]() RUM
RUM
![]() Serverless
Serverless
![]() Security
Security
![]() More
More