SQL Performance Tuning: 9 Best Practices for Developer

SQL performance tuning is a difficult task, especially when working with large amounts of data, where even slight changes can have a significant (positive or negative) influence on performance.
A Database Administrator (DBA) will be in charge of most SQL performance adjustments in mid-sized and large businesses. However, believe me when we say that there are plenty of developers that have to perform DBA-like jobs.
Furthermore, DBAs in many of the organizations struggle to work well with developers—the positions simply require different approaches to problem-solving, which can lead to conflict among colleague.
When dealing with large amounts of data, even modest changes can have a significant influence on performance.
We will cover the following:
- What is SQL Performance Tuning?
- Why SQL Performance Tuning is Important?
- 9 Best Tips for SQL Performance Tuning
What is SQL Performance Tuning?
SQL performance tuning is a collection of processes and methods for optimising relational database queries so that they run as quickly as possible. Identifying which queries are encountering slowdowns and optimising them for maximum efficiency are all part of SQL tuning. SQL tuning will improve a number of relational databases, including MySQL and SQL Server.
DBAs might try to fix server performance issues at the system level, which usually involves adding more memory and CPUs. These remedies, however, are costly, and they may not be successful in addressing the issue of slow requests.
SQL performance tuning allows you to identify SQL queries that are poorly constructed and instances of ineffective indexing. You can discover that you don't need to upgrade your hardware or technical specifications after that.
SQL performance tuning can be difficult, especially when done manually. Even minor changes can have a significant impact on SQL Server and database performance. As a result, you'll need to have effective SQL Server performance tuning tools on hand.
Why SQL Performance Tuning is Important?
Storage and information access are considered primary functions by most companies. Websites and applications must perform swiftly and effectively for internal and external users, which means servers and databases must be as efficient as possible.
A query delay of a few milliseconds may not seem like much, but if each of your database requests has a similar delay, it can quickly build up. When you combine this with massive amounts of constantly generated data, obtaining information from a database might take a long time. When business-critical operations slow down, the whole functionality of the company is likely to suffer.
DBAs must stay on top of SQL Server performance and ensure that database-related activities function smoothly in order to achieve successful SQL tuning.
9 Best Tips for SQL Performance Tuning
Each best practice is a wide enough topic in and of itself to justify its own article or series of articles or even a book or two. As a result, these best practices should only be used as a starting point, with the understanding that you should research each topic further to obtain a better understanding of what's involved.
The guidelines are only meant to serve as a starting point for your journey toward successful performance optimization. Without further hemming and hawing, here are nine ways to find slow queries in SQL Server.
- Indexes
- Consider Performance When Configuring Your Databases
- Create an Execution Plan
- Keep Performance in Mind
- Use SQL DMVs
- Query Reporting via APM Tools
- Maintain an Up-to-date SQL Server Environment
- Use SQL Server Tools
- MONITOR Consistently
#1 SQL Performance Tuning: Indexes
An index is a data structure that allows for quick random lookups and efficient access to sorted records, which speeds up data retrieval operations on a database table. As a result, once you've generated an index, you'll be able to pick or sort your rows more quickly than before.
Indexes can also be used to create a primary key or unique index, which ensures that no other columns have the same values as the primary key or unique index. Of course, database indexing is a big and fascinating subject to which any simple overview does not do credit.
If you're new to indexes, I recommend arranging your searches using this diagram:

The main purpose is to index the most important searching and ordering columns.
Note that if your tables are continuously subjected to INSERT, UPDATE, and DELETE actions, you should be cautious when indexing because all indexes must be changed after these operations.
Furthermore, to speed up the insertion process, DBAs frequently delete SQL indexes before doing batch inserts of millions of records. They rebuild the indexes after the batch is inserted.
However, keep in mind that removing indexes will affect all queries in that table, therefore this method should only be used when working with a single huge insertion.
#2 SQL Performance Tuning: Consider Performance When Configuring Your Databases
At the database level, SQL Server offers a number of options for improving performance. For instance, you can put your log files and data files on different physical drives to avoid file contention while allowing different access patterns. Depending on your workloads, you may also find it useful to alter the Autogrowth and Maxsize file parameters for these files.
You can configure settings at the database level in SQL Server, just as you can at the server level. You can, for example, set up asynchronous statistics updates and enable or disable the Auto Create Statistics and Auto Update Statistics settings. You can also adjust the database compatibility level, which is useful if you've recently upgraded SQL Server.
You're not limited to user databases and their properties when dealing with database performance concerns. You might also be able to improve performance by improving the tempdb system database, which might have an unanticipated influence on performance by triggering metadata or object allocation contention.
One strategy to improve the database's performance is to keep its files separate from the user databases and the operating system. Adjusting the amount of tempdb data files or their sizes is another option.
#3 SQL Performance Tuning: Create an Execution Plan
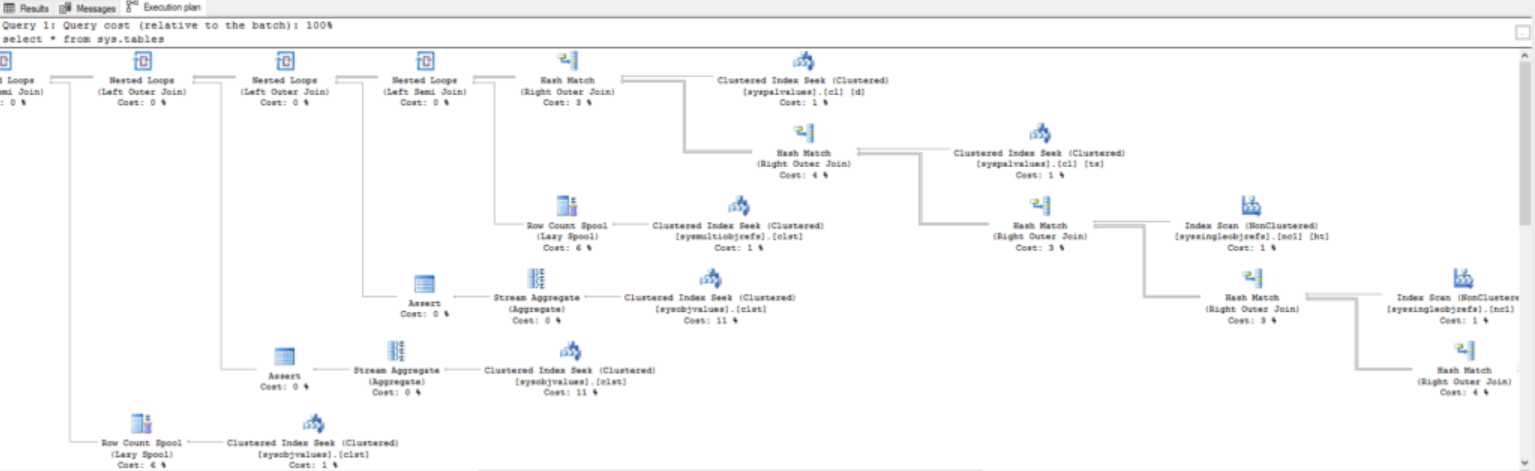
It's critical to be able to build graphical execution plans in order to identify delayed queries, which you can do with SQL Server Management Studio. Following the execution of the queries, actual execution plans are created.
But how do you go about putting together an execution plan?
In SQL Server Management Studio:
Select "Database Engine Query" from the toolbar.

After that, select "Include Actual Execution Plan" from the Query menu.
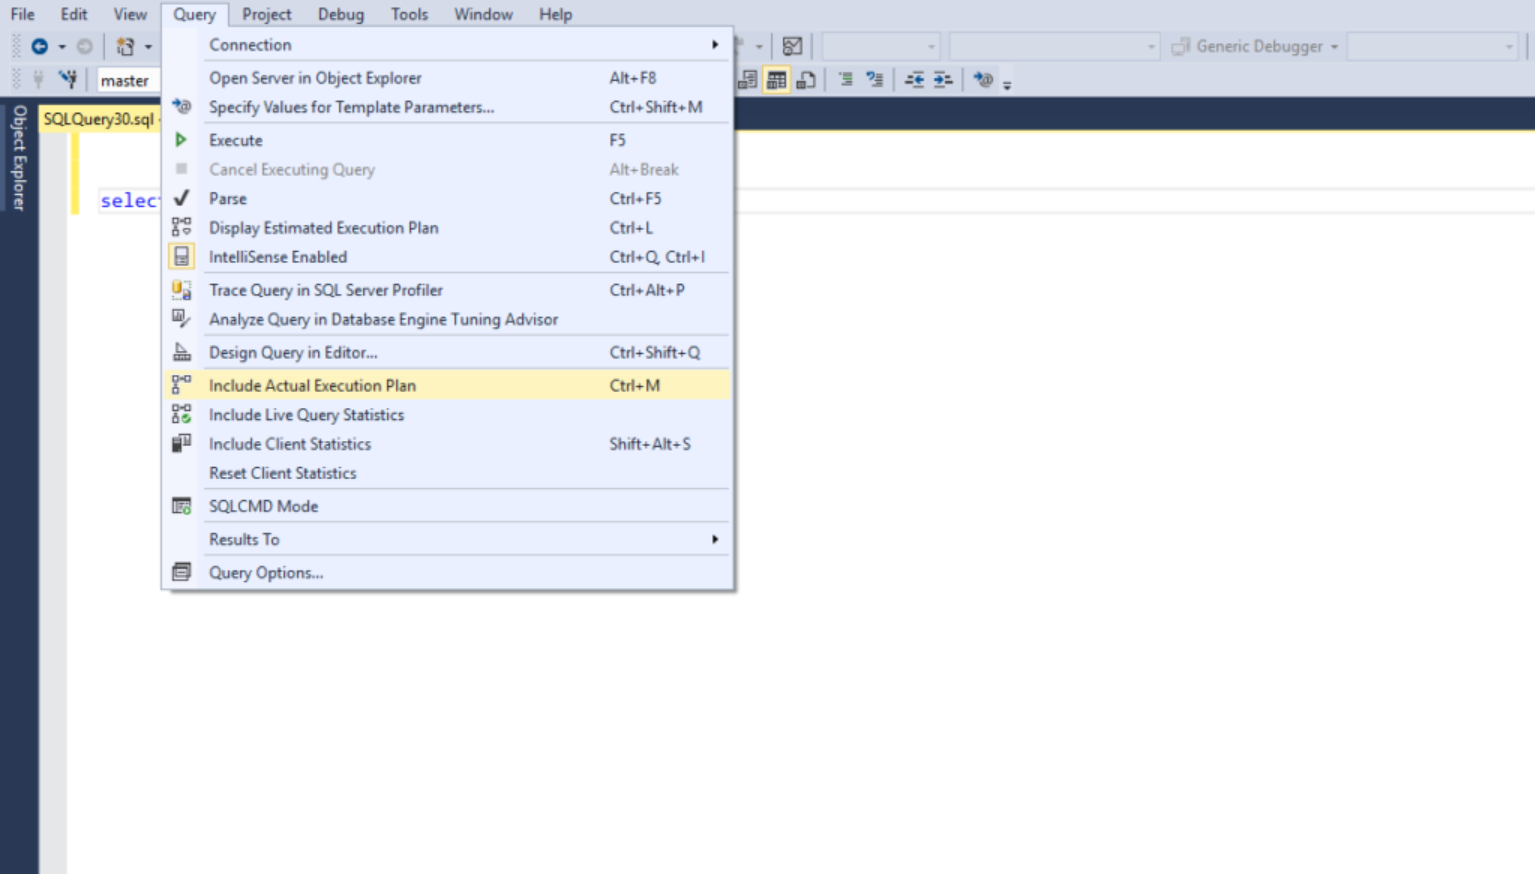
It's finally time to execute your query. You can accomplish this by clicking on the “Execute” toolbar button or pressing F5. The execution plan will then appear in the results pane, under the "Execution Pane" tab, in SQL Server Management Studio.
#4 SQL Performance Tuning: Keep Performance in Mind
A good database design is not only important for data integrity, but it can also help with performance. A normalised database, for example, can enhance efficiency by removing redundant data, making writing and, in some situations, reading operations easier, especially if only one table is involved. However, if utilised wisely, a little denormalization may assist your queries in some circumstances.
Choose the most appropriate data types for your data when constructing a database, such as char instead of varchar for string values that are all two characters.
You should also think about what kind of data you'll be storing in SQL Server. It's typically preferable to save the image path rather than the image itself in a database. Foreign keys and other constraints, when used correctly, can improve performance.
You should consider how other database objects can affect performance in addition to tables. For example, you may frequently avoid complex searches by encapsulating them in views and indexing the views (keeping in mind best indexing practices).
Another example is a stored procedure, which can often outperform a query in terms of performance. When establishing stored procedures, however, make sure to follow recommended practices, such as inserting the SET NOCOUNT ON clause and avoiding the sp_prefix when naming the procedures.
#5 SQL Performance Tuning: Use SQL DMVs
The Dynamic Management Views (DMVs) integrated into SQL Server are one of its best features. There are many of them, and they can provide a lot of knowledge on a wide range of subjects.
Several DMVs provide information on query statistics, execution plans, recent queries, and much more. These can be combined to produce some remarkable results.
The query below, for example, can be used to determine the queries with the most reads, writes, worker time, and other data.
SELECT TOP 10 Substring(qt.text, ( qs.statement_start_offset / 2 ) + 1, (
                            ( CASE qs.statement_end_offset
                            WHEN -1 THEN Datalength(qt.text)
                            ELSE qs.statement_end_offset
                                                                            END
                              -
              qs.statement_start_offset ) / 2 ) + 1),
              qs.execution_count,
              qs.total_logical_reads,
              qs.last_logical_reads,
              qs.total_logical_writes,
              qs.last_logical_writes,
              qs.total_worker_time,
              qs.last_worker_time,
              qs.total_elapsed_time / 1000000 total_elapsed_time_in_S,
              qs.last_elapsed_time / 1000000  last_elapsed_time_in_S,
              qs.last_execution_time,
              qp.query_plan
FROM   sys.dm_exec_query_stats qs
       CROSS apply sys.Dm_exec_sql_text(qs.sql_handle) qt
       CROSS apply sys.Dm_exec_query_plan(qs.plan_handle) qp
ORDER  BY qs.total_logical_reads DESC -- logical reads

-- ORDER BY qs.total_logical_writes DESC -- logical writes
-- ORDER BY qs.total_worker_time DESC -- CPU time
We can copy that SQL query and see if there's any way to improve it, such as adding an index.
#6 SQL Performance Tuning: Query Reporting via APM Tools
The ability to track SQL queries is one of the most useful aspects of application performance management (APM) tools.
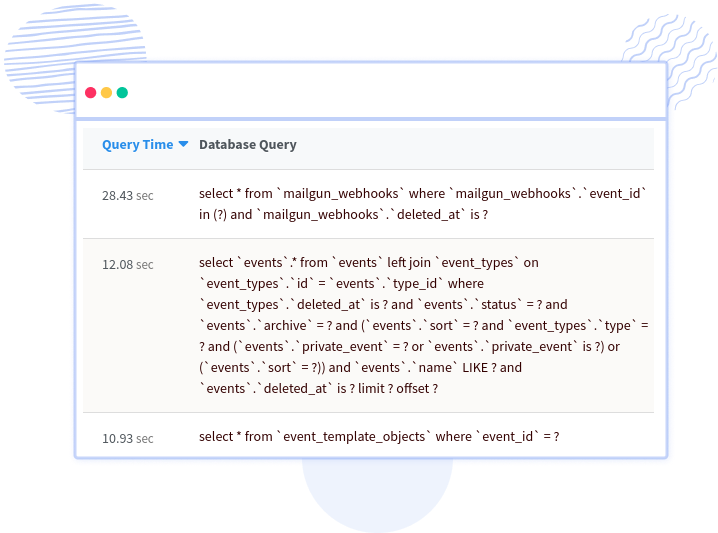
Atatus monitors SQL queries across a variety of database providers, including SQL Server. It displays the number of times a query has been run, the average time it takes, and the transactions involved.
The screenshot below is from Atatus's application dashboard. It shows which SQL queries take the longest for each application.

Every SQL query conducted by Atatus captures performance statistics. You can conduct a search for specific queries to identify potential issues.
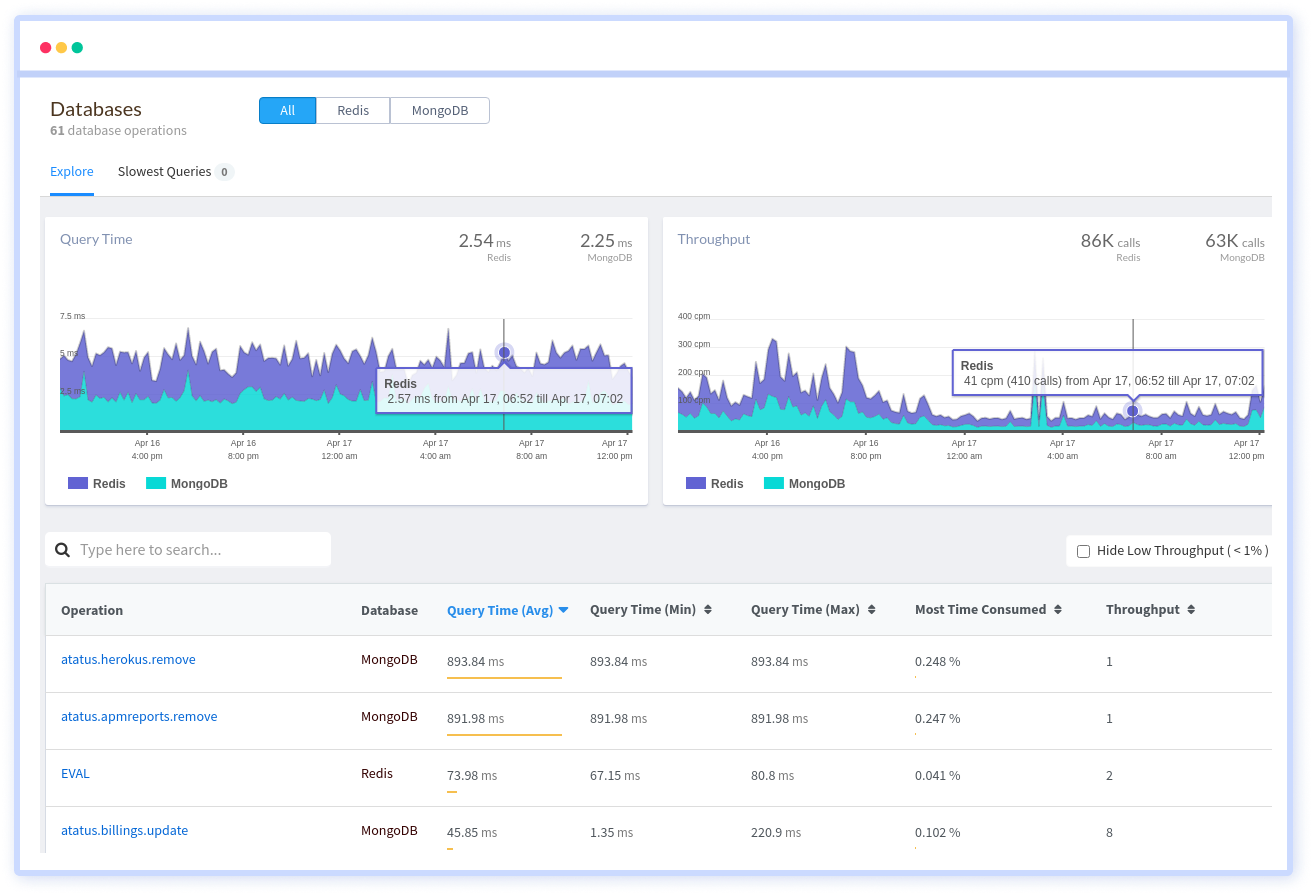
You may view how frequently a query is called overtime and how long it takes by selecting it. You can also check which web pages employ SQL queries and how they affect their speed.
The following is a screenshot of a trace that shows all of the SQL queries and other information about what the code was doing. Within this same perspective, Atatus also displays log messages.
It's also worth noting that it displays the query's server address and database name. You may also check the total number of records returned.
As you can see, Atatus's APM capabilities include complete SQL reporting capabilities. It also has SQL monitoring and alerting functions.
#7 SQL Performance Tuning: Maintain an Up-to-date SQL Server Environment
Although it may appear that this best practice is self-evident, the value of keeping hardware, software, and firmware up to date cannot be emphasised. To take advantage of new performance-related capabilities, you should consider updating to a more recent version of SQL Server whenever available.
Microsoft, for example, provided memory-optimized tempdb metadata in SQL Server 2019, which can help workloads that rely heavily on the tempdb database perform better.
Even if you decide not to switch to a newer SQL Server version, you should update your SQL Server instances and the underlying Windows operating system on a regular basis to take advantage of any recent performance improvements.
Furthermore, you should consider updating any gear that is causing performance issues. Even if the hardware isn't replaced, the associated software and firmware should be kept up to date.
#8 SQL Performance Tuning: Use SQL Server Tools
SQL Server includes a number of performance-enhancing features. When it makes sense, anyone wanting to optimise a SQL Server installation should use these tools, especially since they're included in the licencing fees. The following are some of the SQL Server tools:
- The Microsoft Database Engine Tuning Advisor analyses how queries are processed in the databases you choose, then suggests ways to increase query processing performance by altering database structures including indexes, indexed views, and partitioning. The tool can be used to troubleshoot a query, tune a set of queries across many databases, manage storage space, and do what-if analysis of design changes.
- SQL Server Query Store allows you to save a history of queries, execution plans, and runtime statistics for later analysis of database usage patterns and query plan changes. Query Store can help you in detecting and correcting query performance regressions caused by plan modifications, as well as identifying and tuning resource-intensive queries.
- SQL Server Extended Events is a lightweight performance monitoring system that collects the information you need to detect and manage performance issues. You can select which events to track and how to store event data when creating an extended events session. You can gather exactly the information you need about your SQL Server environment this way, and then view it in the format that best meets your needs.
- SQL Server Management Studio (SSMS) provides several options to view details about a query's execution. You can inspect a query's actual execution plan, which includes runtime information like resource utilisation metrics and warnings, or utilise the Live Query Statistics tool to get real-time data about the query execution process. Client statistics concerning queries and their corresponding network packets are also available in SSMS.
The more you learn how to use SQL Server's tools, the more effectively you can discover and resolve performance issues. However, earlier SQL Server or SSMS editions may not have access to some tools or capabilities.
Furthermore, the tools listed here are not the only ones that are available. Microsoft's Database Experiment Assistant (DEA), for example, is a free A/B testing tool for SQL Server updates.
It's definitely worth looking into what other tools and features might be available to help you with performance difficulties. Even the error logs can be helpful in detecting potential performance issues.
#9 SQL Performance Tuning: MONITOR Consistently
Consistent performance across all SQL Server databases and instances requires ongoing monitoring. But simply collecting information from your systems isn't enough. You must also be able to diagnose and resolve performance issues using the data you've gathered.
A monitoring solution can warn you of potential issues, assist you in identifying bottlenecks, and uncover trends that may indicate performance issues over time.
There are no hard-and-fast rules on what you should monitor, and you should surely tailor your monitoring plan to your unique circumstances. However, there are some areas that you should pay special attention to.
You'll probably want to keep an eye on index fill factors, fragmentation, and utilisation. Monitoring metrics such as CPU, memory, I/O, and buffer cache usage, as well as metrics related to log files and data files, may be beneficial. You should keep track of metrics related to your query as well.
You'll need a monitoring solution that can track the metrics you need without affecting application performance or database operations to properly monitor your SQL Server environment. The solution should be able to track all key metrics, send out timely notifications, and give you the data you need to promptly diagnose and rectify performance issues.
Finally!!!
Performance tuning is not something you do once and then forget about until everything goes wrong. It's a long-term project that needs constant attention to all components of the SQL Server environment.
The infrastructure that hosts the environment, the queries that access the data, the indexes that support the queries, the server and database settings that affect performance, and everything in between are all included in performance tuning.
However, you should proceed with caution while tuning the environment, making changes in small steps and properly testing them before putting them into production.
Above all, performance tuning should not be viewed as an afterthought; rather, it should be considered an inherent part of your SQL Server environment and optimization efforts, beginning with the original setup and continuing until the environment is decommissioned.
Monitor Your SQL Performance with Atatus
Atatus provides you an in-depth perspective of your SQL performance by uncovering slow SQL queries that occur within your requests, as well as transaction traces, to give you actionable insights.
With normalized queries, you can see a list of all slow SQL calls to see which tables and operations have the most impact, know exactly which function was used and when it was performed, and see if your modifications improve performance over time.
Atatus can be beneficial to your business, which provides a comprehensive view of your application, including how it works, where performance bottlenecks exist, which users are most impacted, and which errors break your code for your frontend, backend, and infrastructure.
#1 Solution for Logs, Traces & Metrics
![]() APM
APM
![]() Kubernetes
Kubernetes
![]() Logs
Logs
![]() Synthetics
Synthetics
![]() RUM
RUM
![]() Serverless
Serverless
![]() Security
Security
![]() More
More


![New Relic vs Splunk - In-depth Comparison [2026]](/blog/content/images/size/w960/2024/10/Datadog-vs-sentry--19-.png)