Explaining Load Average in Linux for System Administrators & Developers

When you run the uptime command, most of you might be familiar with the three numbers appearing on the top right corner of your Linux screen. But, do you know what those numbers indicate or why there are three such numbers?
It is called the load average, a metric that assesses the load on your computer systems. While it can be considered a precise tool for measuring system and resource engagement, it would only be worthwhile if you understand it right.
Thus, in this article, we will look at what load average actually is and how to manage it using processors and cores and learn when to fix our systems in case of extra load burden.
Table Of Contents
- Defining Load Average
- Monitoring Load Averages
- Multiple processors vs Multiple cores
- Commands to Check Load Average in Linux
- How to monitor Load Averages in real-time?
- Is there an Ideal Load Average?
- Tackling high Load Average: Causes and Solutions
Defining Load Average
Load refers to the quantity of anything that can be carried at once. In computing systems, it implies the vast quantity of data that is being processed by the OS in order to execute the input command.
"The point of load average is to arrive at a number relating how busy the system is from a human point of view.”
Load average is a metric used by Linux users to monitor the average number of threads running or waiting at a particular time. It helps you understand how various resources in the system are engaged in that instance.
Earlier, Linux tracked only CPU load averages, but today, it can also track uninterruptible tasks. i.e., those which are in the sleeping state or are waiting to be executed.
This was done because the kernel initially calculated only the runnable processes when the non-interruptible I/O also consumed resources in a similar manner. Thus methods of monitoring load averages were changed in order to reflect the demand for other system resources apart from the CPU.
Monitoring Load Averages
The three numbers represent load averages on a progressive time scale - the first number shows the average load in one minute, the second number indicates the load average in the last five minutes and the third number shows the average load for the past fifteen minutes.
An example of load average values presented by running the uptime command -
$ uptime
13:40:40 up 38 days, 1:07, 1 user, load average: 0.25, 0.14, 0.14
The w, uptime and top commands show the same three load average numbers, as do a range of graphical user interface utilities. In Linux, they can also be accessed by reading the /proc/loadavg file. Commands to check the load average in Linux are given later in this article.
From a mathematical viewpoint, the load average is calculated right from when the system started and decays exponentially. Thus technically, the load average shown for the 1st minute includes 63% of the load assessed in the last minute and 37% of the load assessed from the start of the system.
Interpreting the numbers
Let's take a hypothetical load average value - 1.73 0.60 7.98 on a single CPU system.
1.73 during the first minute denotes 1.73 runnable processes. That means after optimum traffic the CPU still had 0.73 processes waiting for a chance to load.
In the next five minutes, the load is lesser than the prescribed amount. Only 0.60 processes are slated for running against a capacity of 1.00, thus the CPU was idle 40% of the time.
In the last fifteen minutes, the system was heavily overloaded. 7.98 processes against the required 1.00 were waiting to be executed.
This means that 6.98 processes were on the waiting list when the single CPU server ran once. This is a very high value for an average and hence has to be fixed immediately.
Multiple Processors vs Multiple Cores
One-way traffic patterns can be the perfect example to explain load averages calculated on single processors and multiple processors. The processor machine may be considered as a one-way lane with vehicles moving on it, representing instructions that are ready to be executed.
The difference between CPU percentage and CPU load can also be explained using this same analogy.
CPU percentage may be regarded as the amount of time a vehicle occupies this one-way. This restricts any other vehicle waiting to pass through the lane and increases its wait time.
But it does not provide any information on the pattern of vehicles on the lane or demand for the lane. Meanwhile, when we take the load average into account, we get a detailed picture of pent-up demand i.e., the number of vehicles waiting to travel through the lane once the lane gets freed. It can also show us how much time was spent by each vehicle passing through the road.

Less than 1.0 (< 1)
The load average can be any number between 0.00 and 1.00. This means that there is very little traffic and lots of space to move, thus instructions can be processed fast and more such instructions can be accommodated. It is an ideal state.
Equal to 1.0 (= 1)
If the load average is exactly 1.0 that means there are optimum number of cars on the road. If a new car wants to pass through it will have to wait. This can be considered a saturation point.
Greater than 1.0 (> 1)
If the number of cars waiting to get on the lane is more than those already present on the road, then controlling traffic will become very difficult and the process will start lagging. This method suggests that you start preparing to fix your CPU servers.
Commands to Check Load Average in Linux
We have listed out some commands that work on all Linux distros alike:
1. cat /proc/loadavg
Open your Linux terminal and type the following command - cat /proc/loadavg. Here the load averages are shown on the left top corner of the terminal - 1.41, 1.28, 0.91 at one, five and fifteen minutes respectively.
Run the command:
cat /proc/loadavg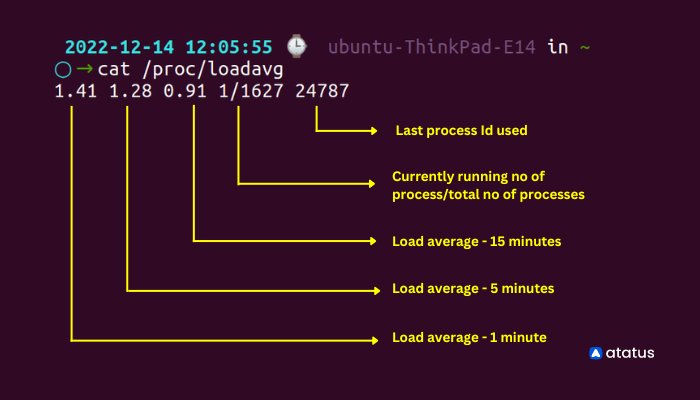
2. w
W command on Linux provides a quick summary on all the users logged into computer at that particular time, what they are doing and how much load all of it is creating on the CPU. It is a combination of several other commands like - who, uptime and ps.
Run the command:
w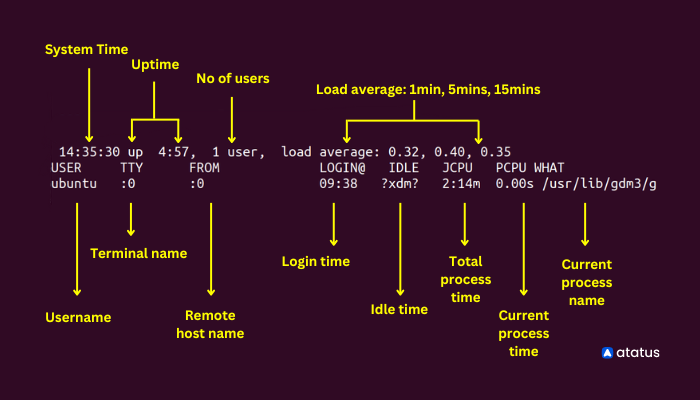
3. uptime
Uptime tells us the duration of time our system has been up and running. For example, in the snippet below you can see apart from load averages (0.81, 0.85, 0.75) shown at the right end, uptime command also shows the time, here, 1:13 from when the system has been running and how many users are logged in at that particular time.
Run the command:
uptime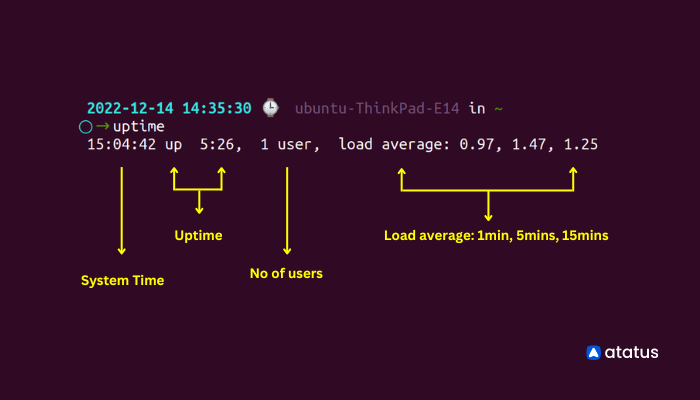
4. Top
The top ( Table of processes) command envisages the currently running processes on the system and how the resources are being used in the CPU and memory.
Run the command:
top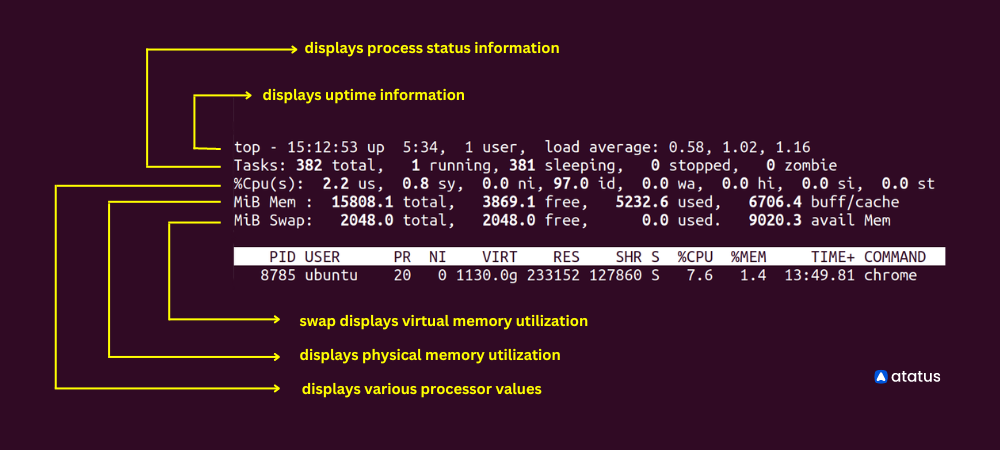
It provides a variety of metrics, including the following:
- The percentage of CPU and memory usage for each process
- The total amount of CPU and memory used by all processes
- The process ID (PID) of each process
- The user and group associated with each process
- The command that was used to start each process
In addition to these metrics, top also provides information about the total amount of CPU and memory used by all processes, the load average (which indicates how busy the system is), and the uptime (the length of time that the system has been running).
We can see from the example above that there are a total of 374 tasks with only 4 of them running at present. 370 others are in the pipeline. 1 user is using the system. And, it also provides info on memory and swap used until now.
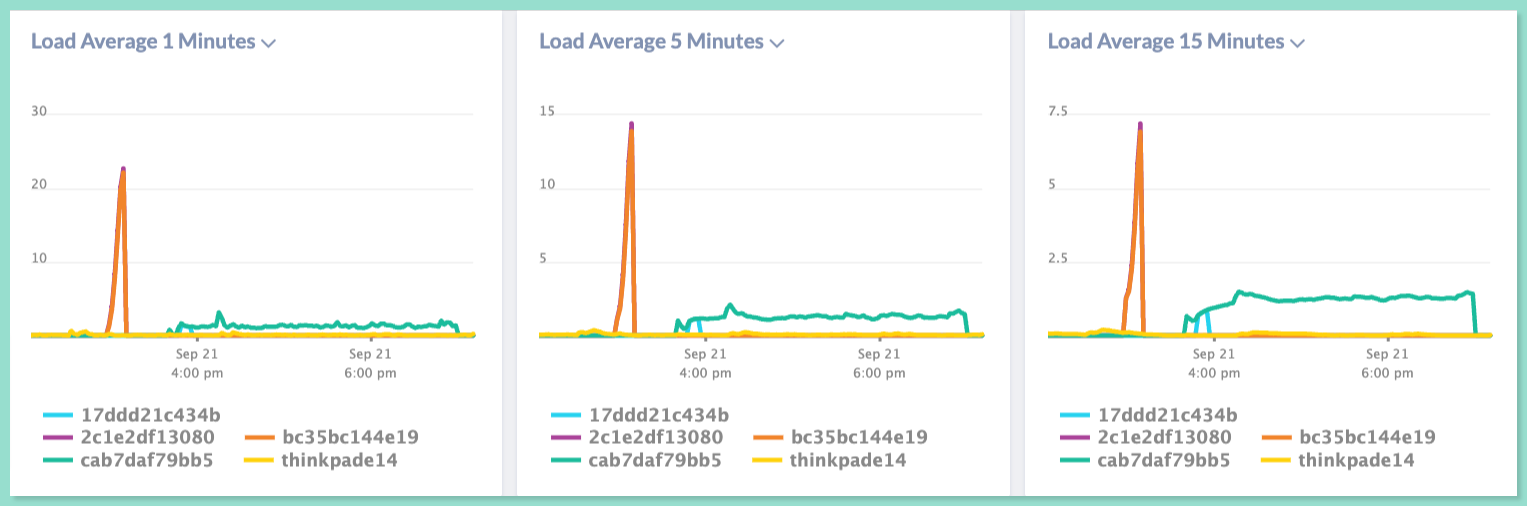
How to monitor Load Averages in real-time?
We have seen the popular commands to check the load average in Linux. Now we will learn how to monitor them continuously.
With Atatus Infrastructure monitoring, you can easily monitor the load averages consistently without any delay. It is a platform that provides real-time visibility into the health and performance of your Linux systems.
To monitor the load average on a Linux system with Atatus Infrastructure monitoring, you can use the following steps:
- Sign up for an Atatus account and choose the product "Infrstructure".
- Installation steps will be provided based on the OS type using which you can install Atatus Infra agent.
- Configure the Atatus agent to collect metrics from the system, including the load average.
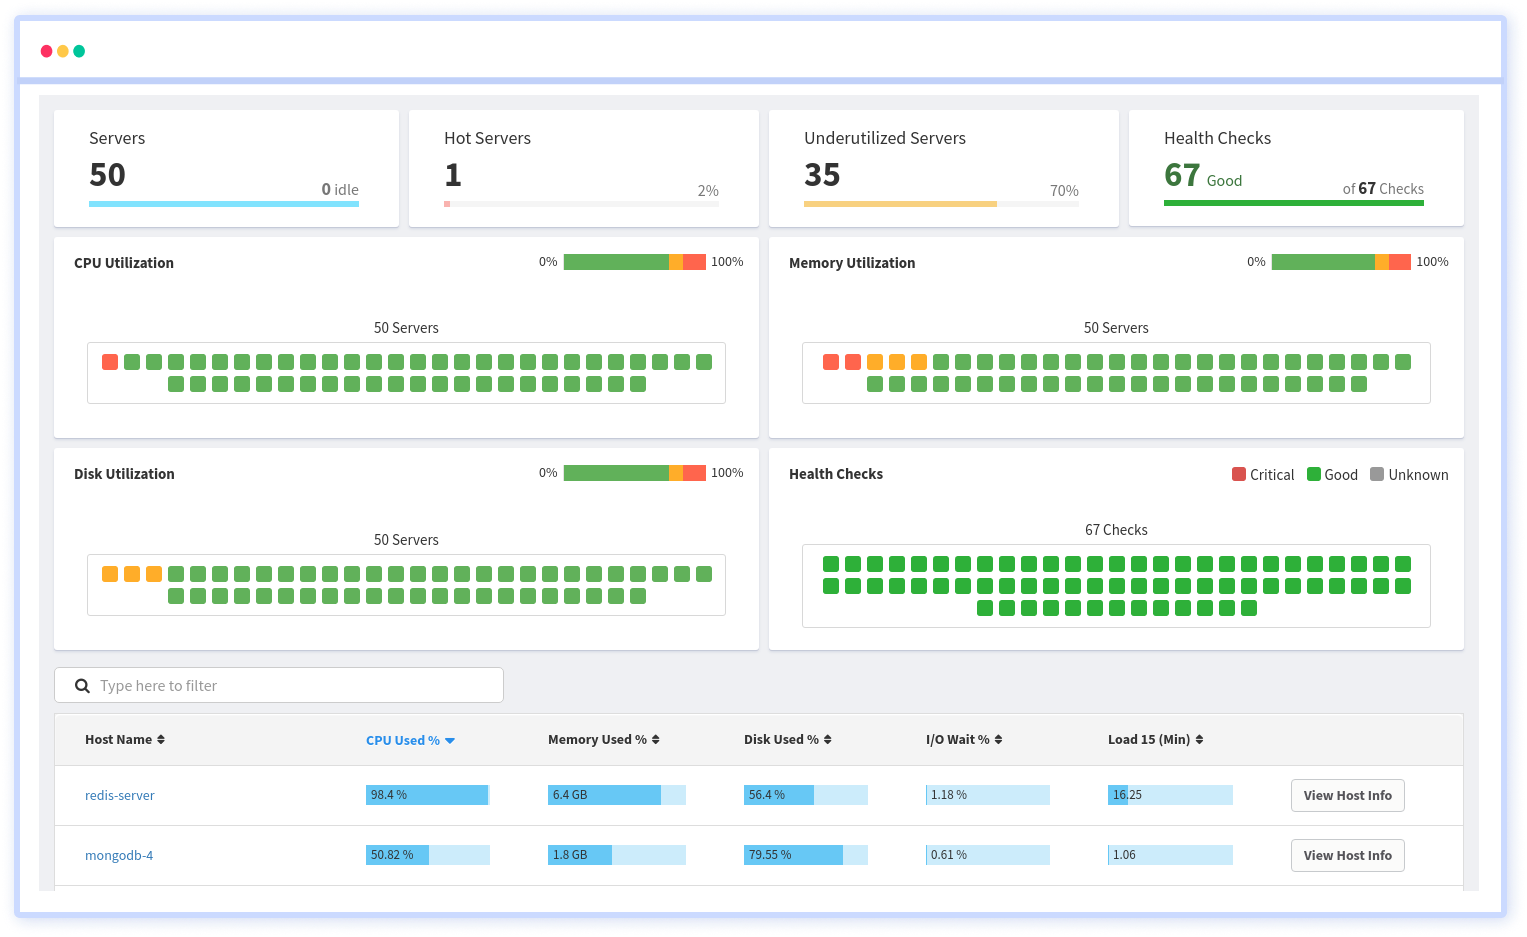
- Use the Atatus dashboard to view the load average for your Linux system in real-time.
- Set up alerts to notify you if the load average exceeds a certain threshold, so you can take action to address any potential performance issues.
In addition to the load average, Atatus Infrastructure monitoring offers a range of other metrics and features, including the following:
- CPU and memory usage: Monitor the percentage of CPU and memory usage on your Linux system in real-time.
- Disk and network activity: Track the read/write operations and network traffic on your Linux system to identify potential performance bottlenecks.
- Alerts and notifications: Configure alerts to notify you if certain metrics, such as the load average, exceed specified thresholds, so you can take action to address potential issues.
- Customizable dashboards: Create custom dashboards to view the metrics and data that are most relevant to your Linux system, and easily track performance over time.
- Detailed logs and reports: View detailed logs and reports on your Linux system's performance, including historical data and trends, to help you identify potential issues and optimize performance.
By using Atatus Infrastructure monitoring to monitor the load average on your Linux system, you can gain valuable insights into the health and performance of your system and take proactive steps to ensure optimal performance.
It is imperative that you monitor your infrastructure regularly if you want to ensure its health and make it more efficient.
Is there an Ideal Load Average?
The shortest answer to this question will be a NO. Optimal load averages can be calculated by dividing the value by the number of processors/cores available. If the final ratio comes to 1.0 then your system is working at saturation, meaning any increase in traffic can lead to latency in the future.
Today, single-core processors are very rare. with the increasing technological advent, people are constantly looking for better alternatives. So any CPU that you buy today would have more than one core processor.
This allows parallelism. Let's consider a single CPU having 8 cores when instructions rise to 300 or 400% then, they automatically get divided into different cores with each core taking up 100% input commands.
Thus all the 400% commands can be processed at once without delay. Had it been the old single-core CPUs, the system would have slowed down, and the processing would take forever!
Check the number of CPUs available on your server using the command:
grep processor /proc/cpuinfo | wc -l
However, considering the load average for 5 minutes as the standard would be an apt choice if you want to maintain a healthy server. Moreover, 75% CPU occupancy is ideal since it provides ample headroom for unusual traffic and also maintains the flow of instruction executions.
Tackling high Load Average: Causes and Solutions
There are several reasons why a Linux system might have a high load average, including:
- CPU overload: This occurs when there are too many processes competing for the CPU's attention, causing the CPU to become overworked and unable to keep up with the demand.
- I/O overload: This occurs when there are too many processes competing for access to the system's I/O devices, such as hard drives and network interfaces. This can cause the system to become unresponsive, as processes have to wait for their turn to access the I/O devices.
- Memory shortage: If the system is low on memory, it may start swapping, which can cause a significant decrease in performance. This is because accessing data from the swap space on a hard drive is much slower than accessing data from RAM.
To control high load averages on a Linux system, you can try the following:
- Identify the processes that are causing the high load and try to optimize them to use the CPU and I/O devices more efficiently. If you run the top command on your terminal, it will show all the processes currently running on the server and how much CPU each of those is using. You can stop any process that is using excess CPU by passing the following command -
kill <pid>(PID is the process id of that particular process) - Upgrade your hardware to increase the number of CPU cores and/or the amount of RAM in your system, which can help distribute the workload more evenly and improve performance.
- Use tools like
top,atophtop, andiotopto monitor system performance and identify processes that are using a lot of resources. Images occupy a considerable part of the website’s bandwidth; using CSS codes for images will reduce this bandwidth consumption. - Use
niceandreniceto adjust the priority of processes and give more CPU time to important processes. - Using the
netstatcommand, we can identify all the networks linked to this server. If there are too many connections, this can overload the server and cause latency. - Use
cgroupsto limit the amount of resources that individual processes or groups of processes can use. This can help prevent a few resource-intensive processes from monopolizing the system's resources and causing high load averages. - Use
systemdor another process management tool to automatically restart processes that crash or become unresponsive, which can help prevent high load averages from occurring in the first place. - Use Linux kernel tuning parameters, such as
swappinessanddirty_ratio, to optimize the use of memory and disk I/O resources on the system. - Implement load balancing techniques, such as using a load balancer or running multiple instances of a service across multiple servers, to distribute workloads more evenly across the system.
- Using a Gzip or Brotli for compressing the files will reduce a lot of storage that they usually take up.
There is no single method to optimize a server, and the specific steps will vary according to which type of server you are using.
Summary
The shift from CPU load averages to system load averages was vital. It transformed how we assessed CPU resource usage and included the demand for disk resources as well.
The triplet numbers indicating load average for one, five and fifteen minutes have become probably one of the most valuable metrics when analyzing system health and give best results while comparing against themselves.
Keep your load value lesser than the number of cores available on a multicore system whenever possible. It doesn't matter how the cores are distributed across CPUs. Two quad-cores == four dual-cores == eight single-cores. All of them add up to 8 cores anyways.
Monitoring server load ensures the longevity of your systems. So, be prudent in handling these metrics. Several metrics can help you keep your program safe, but none are as easy as load averages.
Server(Host) Monitoring with Atatus
Track the availability of the servers, hosts, virtual machines and containers with the help of Atatus Infrastructure Monitoring. It allows you to monitor, quickly pinpoint and fix the issues of your entire infrastructure.
In order to ensure that your infrastructure is running smoothly and efficiently, it is important to monitor it regularly. By doing so, you can identify and resolve issues before they cause downtime or impact your business.
It is possible to determine the host, container, or other backend component that failed or experienced latency during an incident by using an infrastructure monitoring tool. In the event of an outage, engineers can identify which hosts or containers caused the problem. As a result, support tickets can be resolved more quickly and problems can be addressed more efficiently.
Start your free trial with Atatus. No credit card required.
#1 Solution for Logs, Traces & Metrics
![]() APM
APM
![]() Kubernetes
Kubernetes
![]() Logs
Logs
![]() Synthetics
Synthetics
![]() RUM
RUM
![]() Serverless
Serverless
![]() Security
Security
![]() More
More