Enhancing System Security with Advanced Logging and Auditing in Linux

Linux is a powerful operating system that has become a staple in the world of computing. With its open-source nature and versatility, it has gained popularity among individuals and organizations alike. However, as with any operating system, there is a need for robust logging and auditing capabilities.
This is where the concept of "Advance Logging and Auditing in Linux" comes into play. In simple terms, logging and auditing are methods of recording and analyzing system activity. These processes play a crucial role in ensuring system security, troubleshooting issues, and maintaining compliance with various regulations.
While Linux has always had basic logging and auditing capabilities, advancements in technology and an ever-evolving threat landscape have made it necessary to have more sophisticated methods in place.
In this article, we will explore the concept of advance logging and auditing in Linux, its importance, and different tools and techniques that are available to achieve it.
Whether you are a system administrator, cybersecurity professional, or simply someone looking to enhance their Linux skills, this article will provide valuable insights into the world of advance logging and auditing in Linux.
Table Of Contents:-
- The Importance of System Logging & Auditing
- Built-in Linux Logging Tools
- How Atatus Log Monitoring helps?
- Using Logrotate for Log Management
Importance of System Logging and Auditing
Logging and auditing are crucial practices in various fields, especially in IT, cybersecurity, finance, and other sectors where data integrity, security, and compliance are of utmost importance.
Logs can provide an accurate account of who did what and when. This can be particularly useful for understanding user behavior or identifying malicious activities. In the event of a security breach or an incident, logs can be a primary resource for understanding what happened, how it happened, and what the impacts were. Without logs, it would be nearly impossible to piece together the events leading up to an incident.
For IT systems, logs can help administrators understand system performance, bottlenecks, or failures. They can use this information to optimize and tune systems for better performance.
Many regulatory standards (e.g., GDPR, HIPAA, SOX) require organizations to maintain logs for specific periods and ensure that certain types of activities are recorded. Not complying can lead to hefty fines and other legal repercussions.
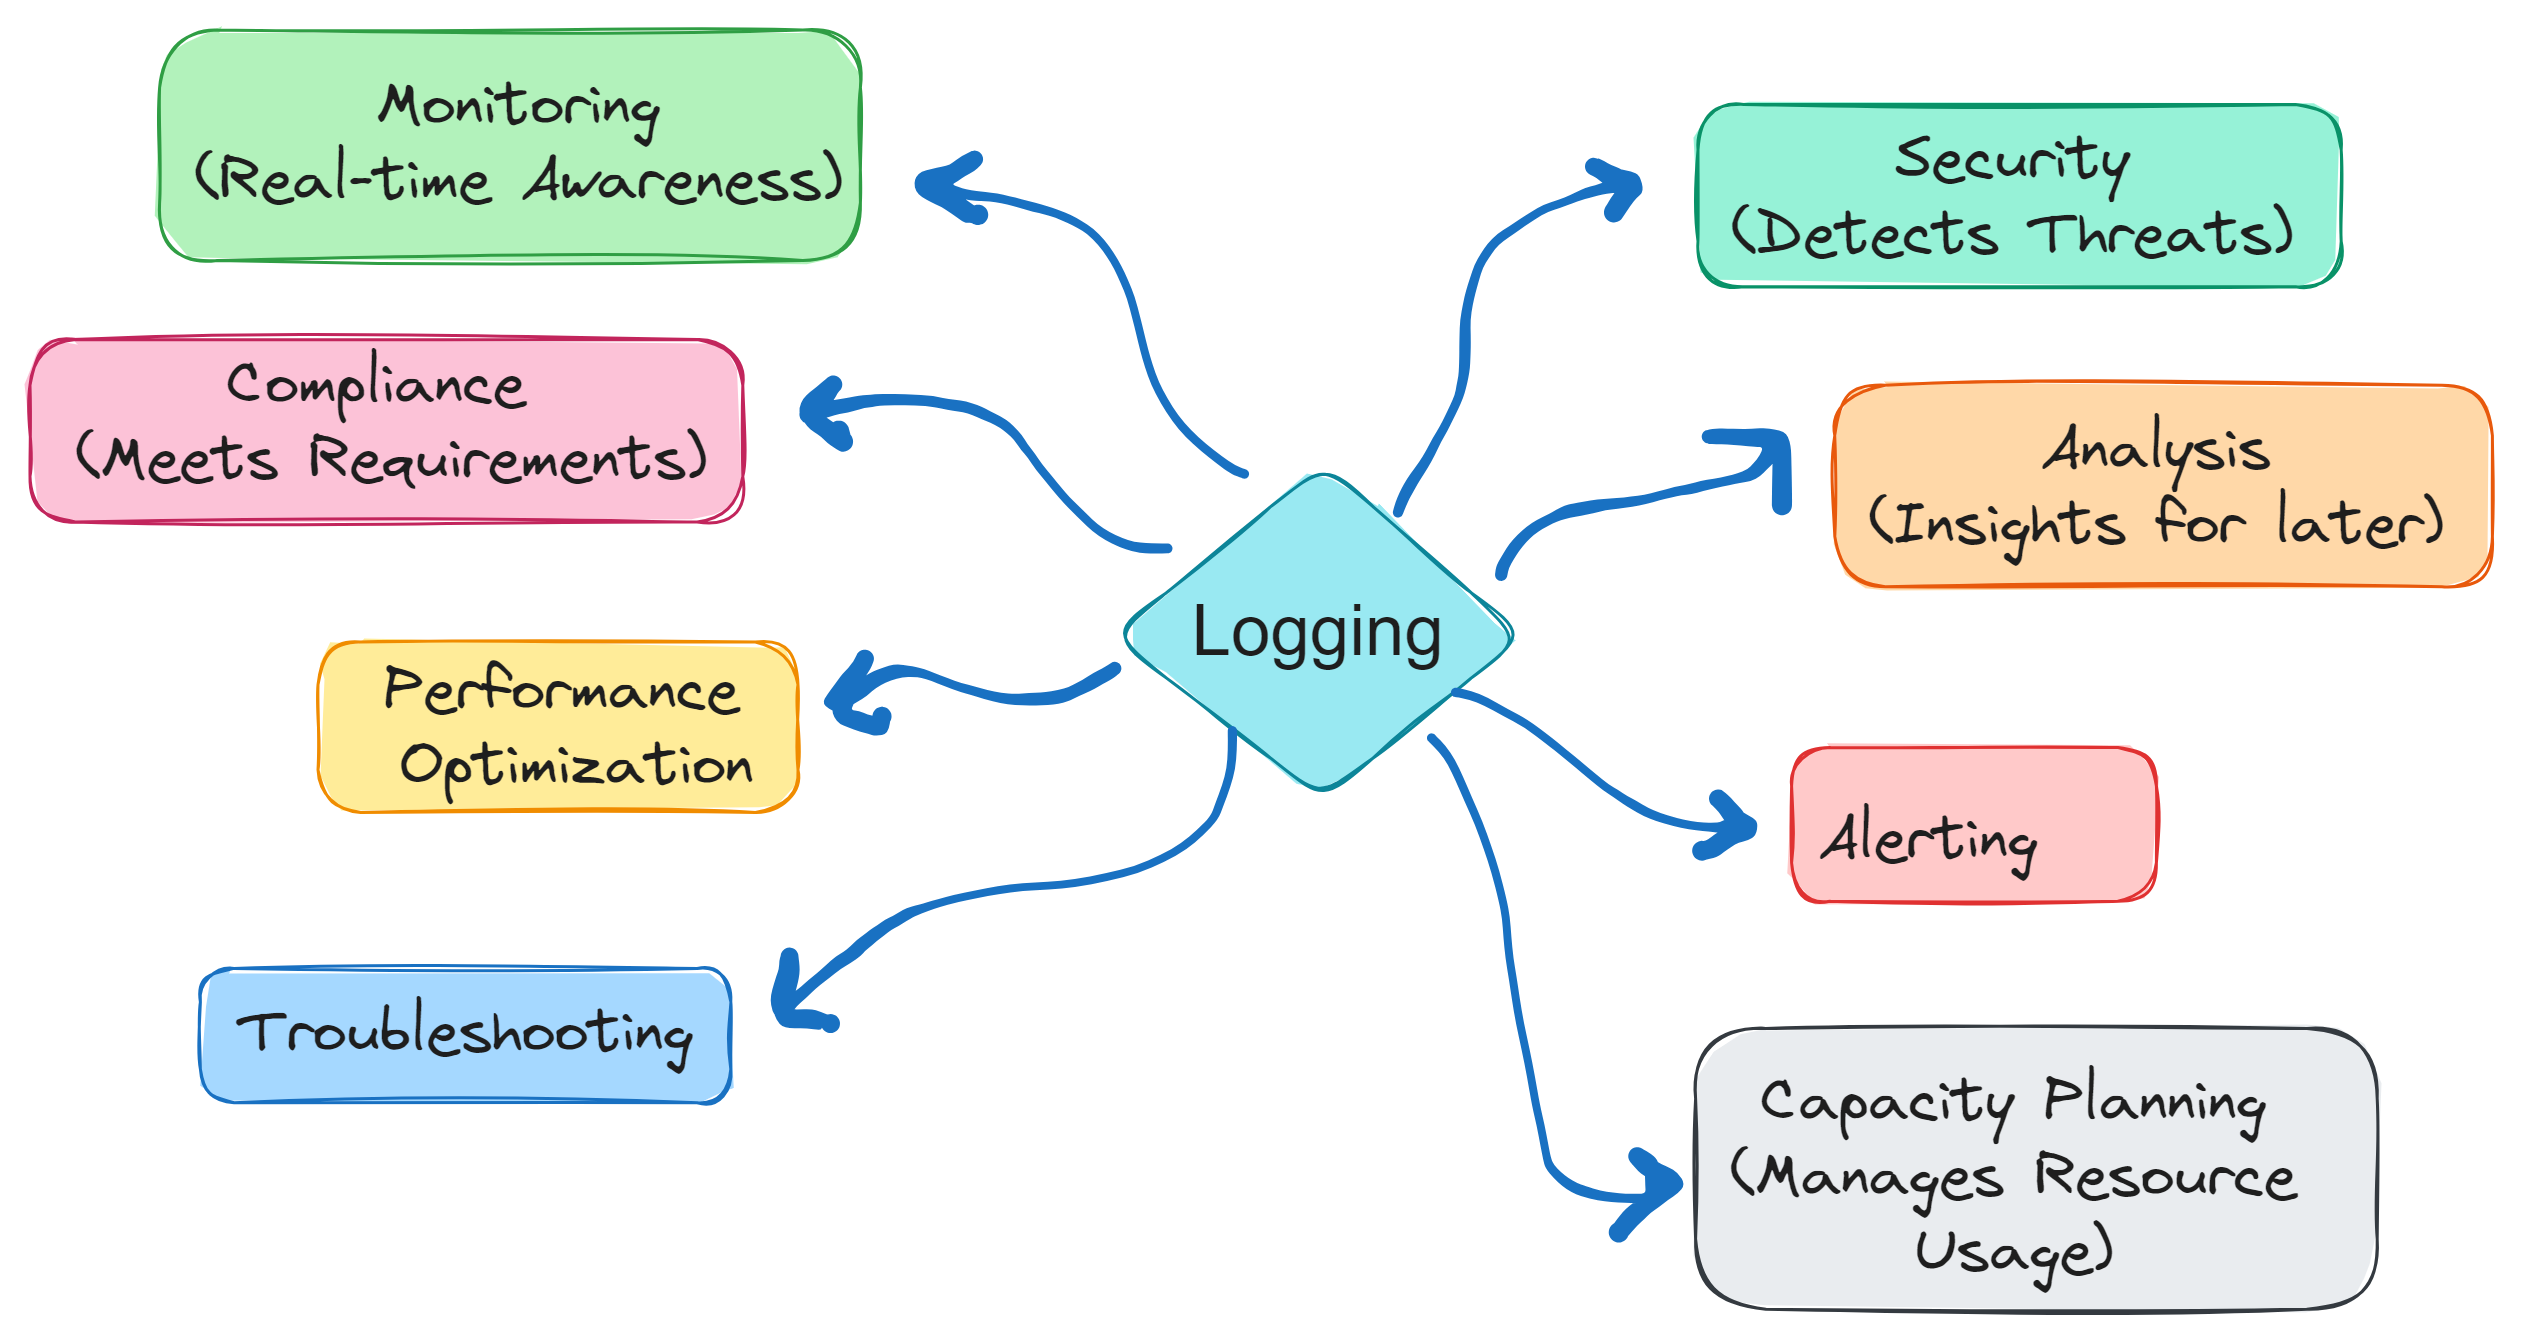
Regular auditing can help identify issues before they become major problems. For example, repeated failed login attempts might indicate a brute force attack in progress. Logs can be used to detect unauthorized changes or access to critical systems and data. This helps ensure the integrity and reliability of systems and information.
For web applications or other user-focused platforms, logs can help in understanding user behavior, which can be used to refine and improve the user experience. Over time, logs can be analyzed to identify patterns or trends. This can be useful for capacity planning, security posture assessment, and other strategic initiatives.
To realize the full benefits of logging and auditing, it's crucial for organizations to implement robust logging policies, have a proper log management system in place, and periodically review and audit the logs. Without these practices, the vast amount of data collected in logs can become overwhelming and difficult to interpret or use effectively.
Built-in Linux Logging Tools
Each of these components plays a significant role in enhancing the security and reliability of a Linux system, and their usage depends on specific security requirements and use cases. System administrators and security professionals should carefully consider which components to use and configure them appropriately to meet their security objectives.
1. Syslog
Sys.log is a standard for message logging in Unix-based systems, allowing applications and devices to generate and collect messages about system activity. It has become the de facto standard for logging on Linux and Unix systems.
Syslogd is the main logging daemon that collects logs and routes them to the appropriate files or remote systems. And Logger is a command-line tool that can send logs to the Syslog daemon. It's useful for generating custom log messages from scripts or for testing.
Key Features:
- Facilities: Syslog categorizes log messages based on the source of the message. These categories are called "facilities". Examples include auth, cron, daemon, kernel, user, and more.
- Priorities (or Severities): These are levels of urgency or importance associated with log messages. Examples include emerg, alert, crit, err, warning, notice, info, and debug.
- Log Rotation: Syslog works in tandem with tools like logrotate to manage log file rotation, ensuring logs don't consume all available disk space.
Applications, services, or system components generate log messages. These messages are sent to the Syslog daemon.
Based on its configuration typically in /etc/syslog.conf or /etc/rsyslog.conf, the Syslog daemon determines where to store or forward these messages. It could be local log files, remote Syslog servers, or other destinations. Messages are categorized and stored based on their facility and priority.
Common Implementations:
rsyslog: An enhanced Syslog daemon that offers improved performance, better security, and modular design. It's the default on many modern Linux distributions.sysklogd: A combination of the Syslog daemon and the klogd daemon (for kernel logging).syslog-ng: "Syslog Next Generation" is another enhanced Syslog implementation with advanced filtering, sorting capabilities, and configuration options..
Syslog is foundational for logging on Linux systems. Proper configuration, along with regular monitoring and analysis of logs, ensures system stability, security, and compliance with various standards and regulations.
2. Journald
journald is the default system logging daemon on many Linux distributions, part of the systemd init system. It collects and manages log data for system and application logs.
Key Features:
- Structured Logging:
journaldstores logs in a structured format (binary or JSON), making it easier to search and analyze logs. - Integration with systemd: It is tightly integrated with systemd and can capture logs related to boot processes and services.
- Centralized Logging: Logs are stored in a central journal, accessible with the
journalctlcommand. - Retention and Rotation:
journaldhandles log retention and rotation.
Use Case: Monitoring and troubleshooting system and application issues.
Example:
To start, you can view the last few entries in the journal by using the journalctl command without any arguments. This will display the most recent log entries across all units (services, applications, and the system itself).
By default, this will show you a scrolling view of the most recent log entries. You can press q to exit this view.
- If you're interested in logs related to a specific service, such as your web server, you can filter the logs using the
-uor--unitflag, followed by the unit name. Replace your-web-service with the actual name of your web server service.
journalctl -u your-web-service- If you suspect that the issue occurred at a specific time, you can filter logs within a specified time range using the
--sinceand--untilflags. For example, to see logs from the past hour:
journalctl --since "1 hour ago"- If you are looking for logs containing specific keywords or phrases, you can use the grep command in combination with
journalctl. For example, to search for logs related to "error," you can run:
journalctl | grep "error"- You can filter logs by their priorities or severities using the
-por--priorityflag. For instance, to view logs with a priority level of "error" or higher: The-bflag limits the search to the current boot session.
journalctl -p err -b- To continuously monitor logs in real-time as new entries are added, you can use the
-for--followflag: - To save logs to a file for later analysis, you can redirect the output of journalctl to a file:
journalctl > logs.txt3. Auditd
The Linux Audit Framework auditd provides a way to monitor and log security-related events on a Linux system.
Key Features:
- Auditing: It can audit various system activities, including file access, process execution, privilege changes, and more.
- Rules-Based: Administrators can define audit rules to specify what events to monitor and log. These rules are configured in
/etc/audit/audit.rulesand specify what should be audited, including file paths, user accounts, and event types. - Log Integrity: Audit logs are tamper-evident, helping maintain the integrity of audit data.
Use Case: Security monitoring, compliance, and intrusion detection. It's valuable for tracking and investigating security incidents.
4. SELinux
SELinux is a mandatory access control (MAC) system that enhances Linux security by enforcing fine-grained access policies on processes and resources.
Key Features:
- Mandatory Access Control: SELinux enforces policies that determine what actions processes and users are allowed to perform.
- Labels: It uses security labels (contexts) to identify files, processes, and other objects, enforcing access based on these labels.
- Security Policies: Policies are defined and configured using policy modules, and they can be customized for specific use cases.
Use Case: Enhanced system security, containment of processes, and protection against privilege escalation attacks.
5. AppArmor
AppArmor is another mandatory access control (MAC) framework for Linux that provides an alternative to SELinux. It focuses on confining individual processes.
Key Features:
- Process Confinement: AppArmor profiles are used to confine individual processes or applications, limiting their access to files, network resources, and system capabilities.
- Easy Configuration: AppArmor profiles are easier to create and manage for some users compared to SELinux policies.
- Application-Level Control: It allows administrators to create security profiles tailored to specific applications.
Use Case: Application-level security and process confinement. It is often used in container environments and for securing specific applications.
How Atatus Log Monitoring can help?
Atatus is a performance monitoring and error tracking platform primarily designed for web applications and services.
Atatus can capture and analyze application errors and exceptions in real-time. This is crucial for auditing as it helps identify and track issues that might affect the application's functionality or security. Detailed error reports provide insights into the root causes of problems.
Atatus can trace the performance of individual transactions and requests, helping you understand which parts of your application are slow or experiencing issues. This is valuable for auditing because it allows you to pinpoint bottlenecks or unusual behavior.
This powerful tool allows businesses to closely track and analyze every aspect of their application's performance, identifying potential issues and addressing them before they impact the end user experience.
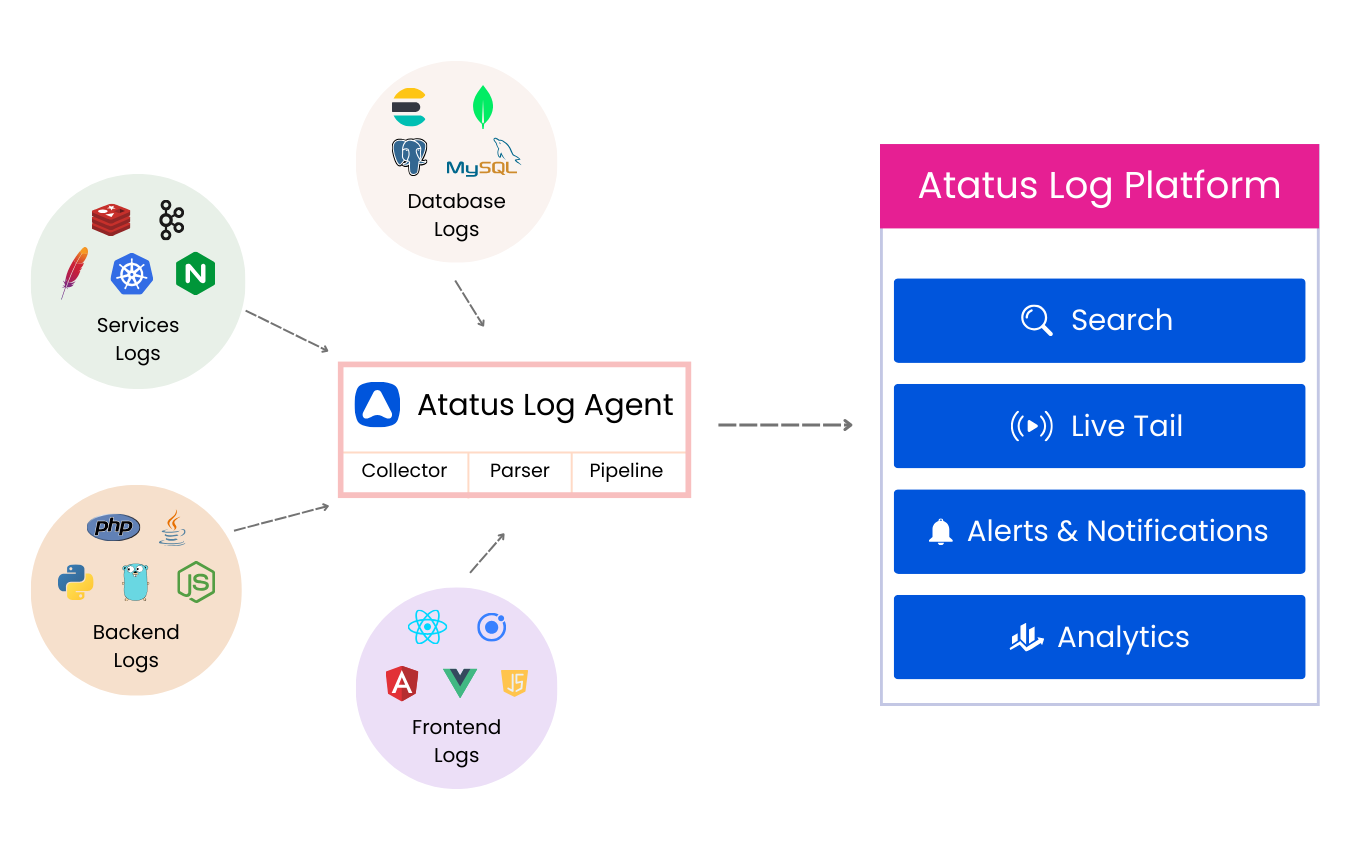
Collector: The Collector is the initial component responsible for gathering logs from various sources within your application, including the backend, services, front-end, and databases. It aggregates these logs, preparing them for further processing.
Parser: Once the logs are collected, the Parser component comes into play. It processes and parses the raw log data to structure it in a meaningful and organized format. This structuring makes it easier to analyze and extract relevant information from the logs.
Pipeline: The structured log data is then passed into the Pipeline, where it can be further analyzed and acted upon. This component can support various operations like searching, monitoring, alerting, and reporting, enabling you to gain insights into your application's performance and health.
Benefits of Logs Monitoring
- Centralized Log Management: Aggregates logs from multiple sources for unified analysis.
- Live Tail for Real-time Streaming: Streams log data in real-time for instant issue response.
- Custom Alerts and Notifications: Customizable alerts for proactive issue handling.
- Historical Log Analysis: Access to historical log data for trend analysis and compliance.
- Powerful Search Capabilities: Robust search functionality for efficient log entry location and in-depth investigations.
Using Logrotate for Log Management
It helps prevent log files from consuming excessive disk space, ensures log files are archived for historical analysis, and can also compress log files to save storage space.
Here's how you can use logrotate to manage log files produced by logging tools:
Firstly ensure logrotate in installed in your system, then you can move onto configuration. logrotate uses configuration files located in the /etc/logrotate.d/ directory and the main configuration file, typically /etc/logrotate.conf.
To manage log files generated by a specific logging tool, create or modify a configuration file in /etc/logrotate.d/. You can name this file according to the tool or application generating the logs. For example, if you have a custom application that generates logs, create a file like /etc/logrotate.d/myapp.
In the configuration file, specify the log file paths that you want logrotate to manage. For example:
/var/log/myapp.log {
	# Log rotation options go here
}
Within the configuration block, define log rotation options, such as:
- rotate: The number of rotated log files to keep. Older files are deleted. For example, rotate 4 keeps four rotated log files.
- weekly, daily, monthly, etc: The frequency at which logs should be rotated.
- size: Rotate logs when they reach a specific size. For example, size 100M rotates logs when they reach 100 megabytes.
- compress: Enable log file compression to save disk space.
- create: Create a new empty log file after rotation.
- postrotate and prerotate: Execute custom commands before and after log rotation, e.g., restarting a service.
/var/log/myapp.log {
    rotate 4          # Keep up to 4 rotated copies of the log file.
    weekly           # Rotate logs on a weekly basis.
    size 100M        # Rotate the log file when it reaches 100 megabytes.
    compress         # Compress the rotated log files.
    create 0644 user group  # Create new log files with the specified permissions and ownership.
    postrotate
        /usr/bin/systemctl reload myapp.service  # Execute this command after log rotation.
    endscript
}
By following these steps and configuring logrotate appropriately, you can effectively manage log files generated by various logging tools on your Linux system, ensuring they don't fill up your disk space and maintaining a history of logs for analysis and troubleshooting.
Conclusion
The advanced logging and auditing capabilities in Linux are crucial for maintaining the security and integrity of your system. With the use of basic tools and the added feature of Atatus log monitoring, you can effectively track and analyze all activities on your system, ensuring that any issues or breaches are quickly identified and addressed.
As technology continues to advance, it is crucial to stay updated and utilize these tools to protect your system and data. Atatus's log monitoring capabilities provide a valuable asset in this effort, allowing for efficient and effective management of your system's logs.
Trust in the power of advanced logging and auditing in Linux, and keep your system running smoothly and securely.
#1 Solution for Logs, Traces & Metrics
![]() APM
APM
![]() Kubernetes
Kubernetes
![]() Logs
Logs
![]() Synthetics
Synthetics
![]() RUM
RUM
![]() Serverless
Serverless
![]() Security
Security
![]() More
More