Logstash Alternatives in 2025: 10 Best Options
Data processing involves collecting, organizing, and manipulating data in a systematic manner in order to extract useful information from it. It involves a series of steps that are performed on a set of data to transform it into a more meaningful and functional form for a specific purpose.
Starting from collecting the data to the end part of processing it, data undergoes several layers of checks and balances before it is let out as we see it.
Logstash is one such data processing pipeline which collects data and processes it before running an analysis on it. It plays a central part in log management solutions.
Enormous plugins and straightforward configuration make Logstash a highly flexible and likely choice. But, its output performance and resource consumption have been a stick in the mud. And thus we advise you to always contemplate other available options before blindly following the bandwagon.
Here we will provide you with 10 best alternatives for Logstash. Everything has a subjective side to it, and it is always best to rely on what works best for you rather than choosing the most popular one!
Table Of Contents
What is Logstash?
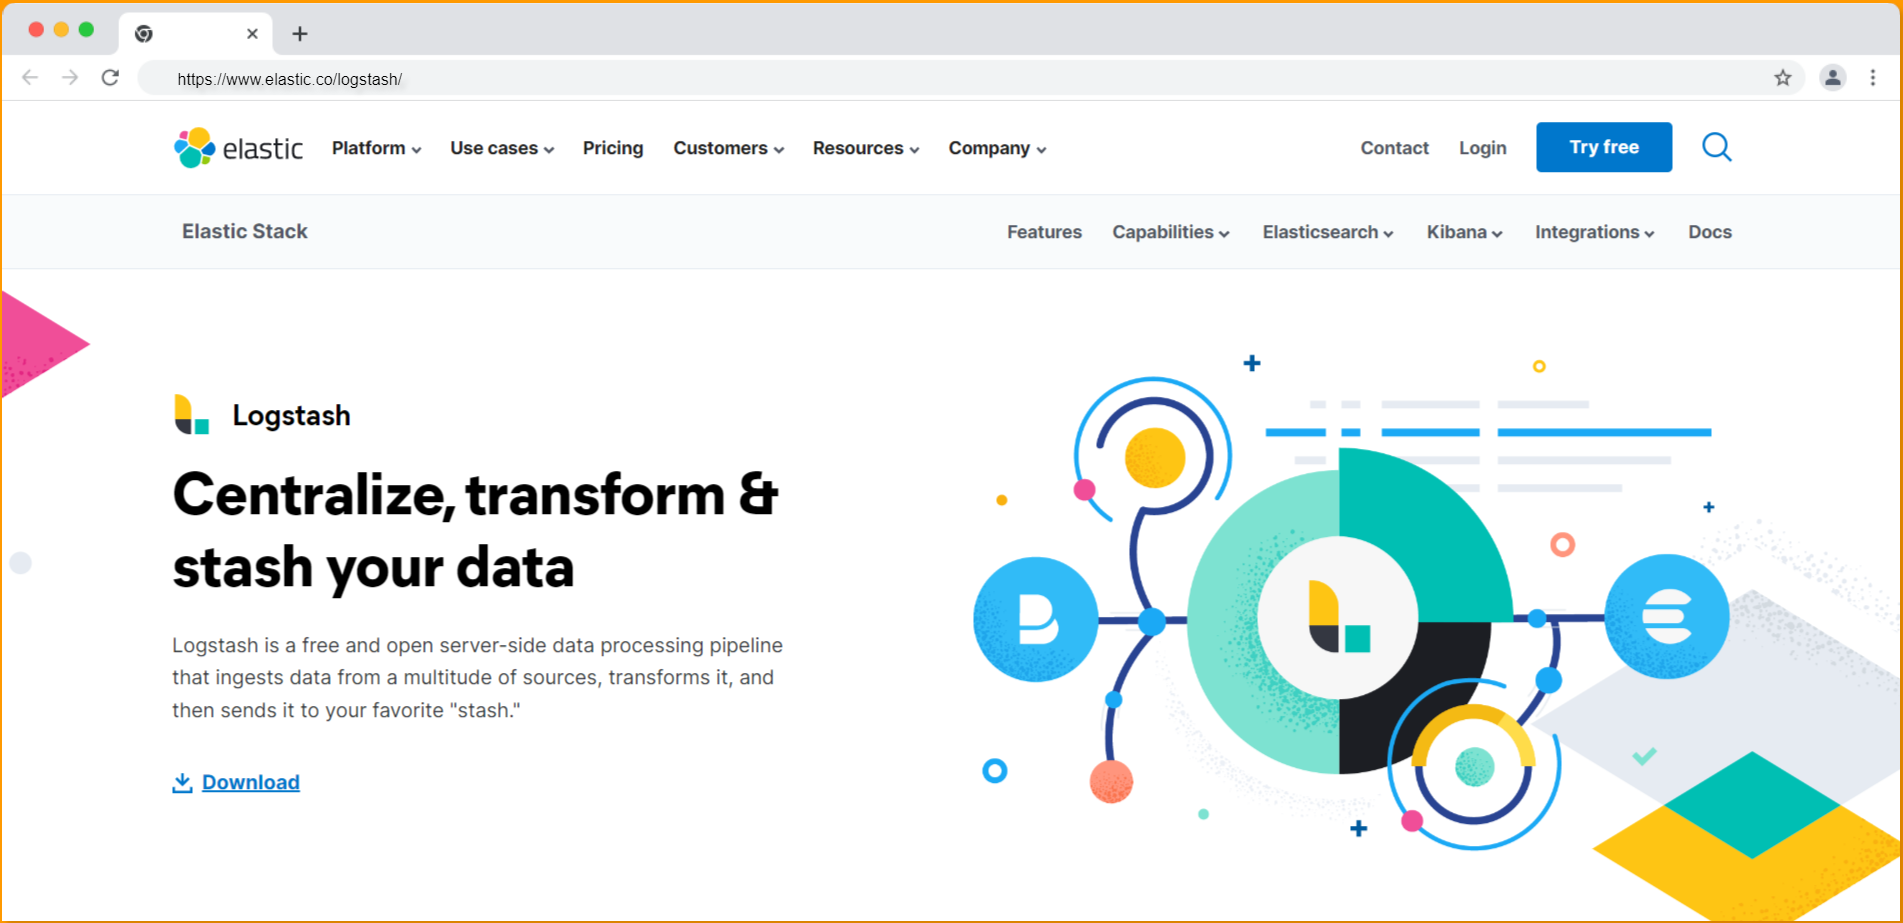
Logstash is an open-source data processing pipeline that ingests, transforms, and sends data to a specified output destination. It is a part of the Elastic Stack, along with Elasticsearch, Kibana, and Logstash.
It is designed to handle a wide variety of data sources, including log files, system metrics, and application data, and can process and transform this data into a common format for further analysis. It can parse, filter, and manipulate data using a wide range of plugins and can output data to various destinations.
Logstash has a flexible plugin ecosystem that allows users to easily extend its functionality and integrate it with other systems. It can be run as a standalone process or as part of a larger data processing pipeline, making it a powerful tool for data ingestion, transformation, and analysis.
Logstash Advantages
- Plugins make it more flexible
- Part of the ELK stack
- Structuring logs with the help of Grok
- Anonymize data for security and privacy concerns
Logstash Limitations
- Performance hassles
- High resource consumption
- Difficulty in scaling up
Having read about Logstash's pros and cons, let's now look at the other data processing alternatives you might want to consider in 2023.
1. Atatus
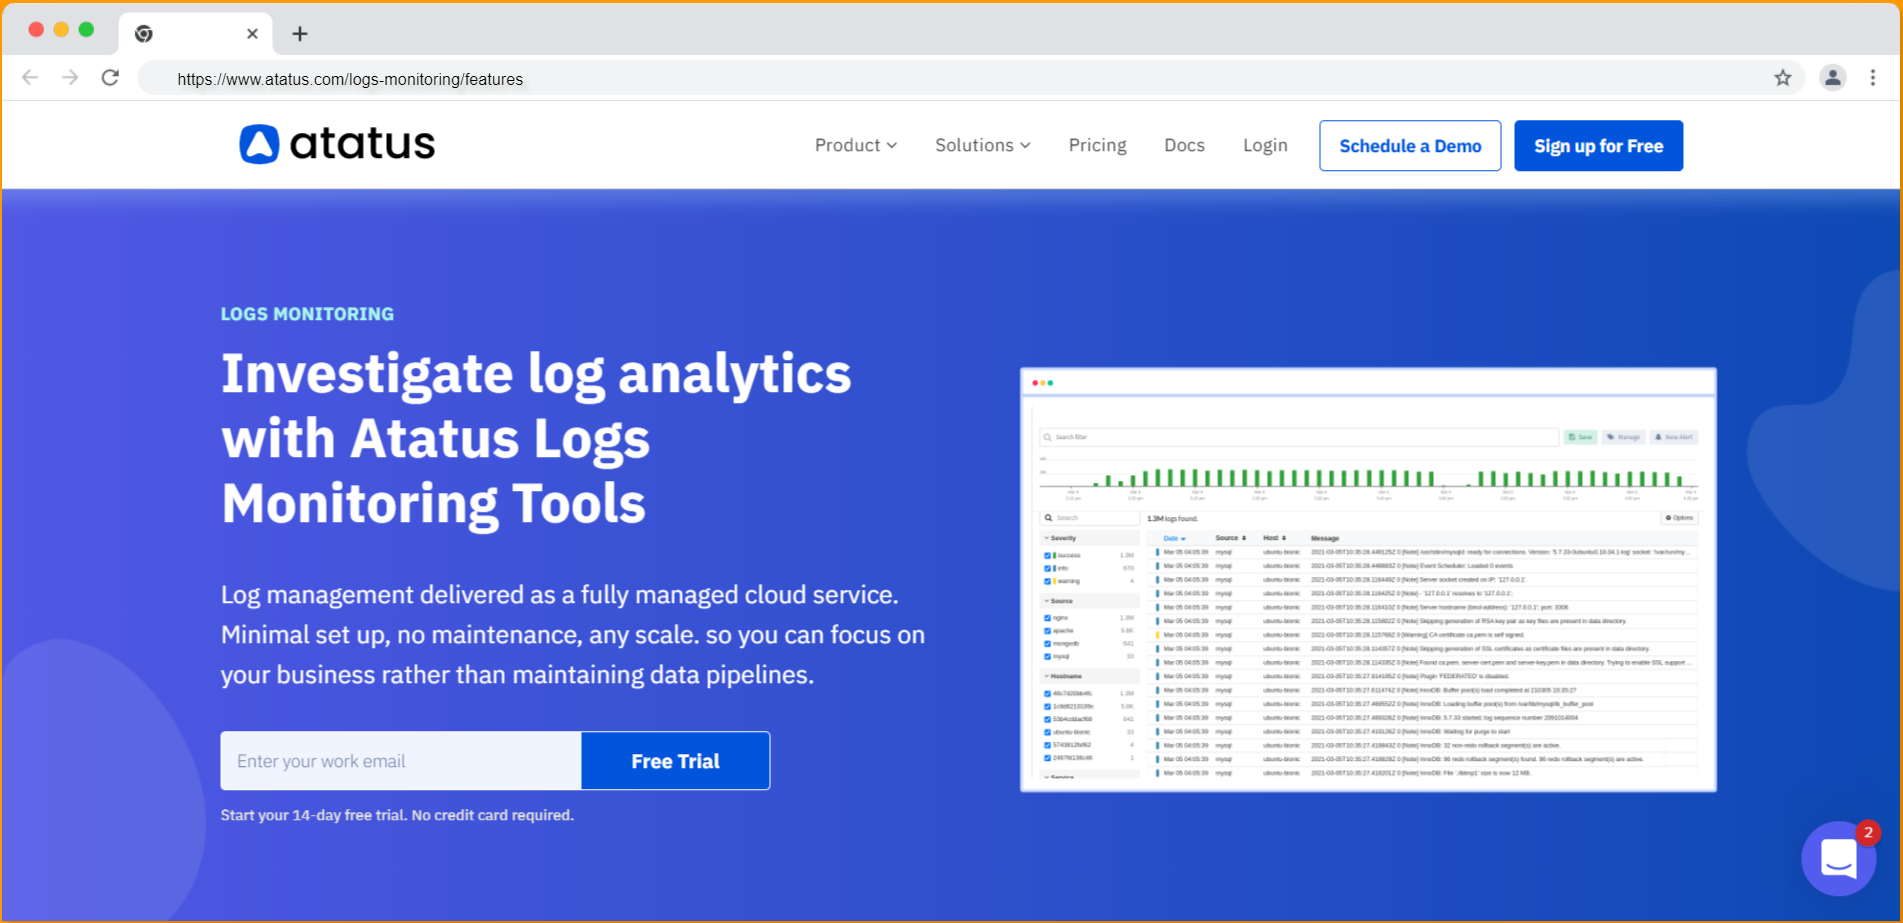
Atatus is a full-stack observability platform for front-end and back-end applications. Atatus Log Monitoring, have an easy set-up module and require very little maintenance. It monitors logs from all your systems, servers and applications and transforms them into a centralized base for easy problem identification and resolution.
Atatus bring with it the following features -
- Log Explorer - Complete visibility into the source, hostname, services, tags and messages of your programs
- Live tail - View your log events in real-time from anywhere in your infrastructure. It also allows you to pick one particular event and resolve the performance issues in it.
- Log Analytics - You can sort and view log event counts based on alert rules and policies using filter options and insights.
- Integration - The log events are integrated and visible in specified modules such as MySQL, MongoDB, PostgreSQL, NGINX, etc.
Atatus is a popular choice for developers in a variety of industries, including IT, operations, and business analytics, for a range of use cases, such as search, log analysis, and real-time analytics. Apart from this, they also provide other APM tools, RUM and infrastructure monitoring tools, etc.
2. Filebeat
Filebeat is an open source data shipper that is part of the Elastic Stack, a collection of tools for collecting, storing, and analyzing data. It is designed to help organizations collect and forward log data from various sources to a centralized location, such as Elasticsearch or Logstash.
Some of the key features of Filebeat include -
- Collection: Filebeat allows you to collect log data from a variety of sources, such as servers, applications, and network devices, using a range of protocols, including Syslog, HTTP, and TCP.
- Forwarding: It can forward data to a variety of destinations, such as Elasticsearch, Logstash, or other data stores, using a variety of formats, such as JSON and CSV.
- Buffering: Filebeat provides a buffering feature that allows you to store data temporarily in memory or on disk before forwarding it to the destination. This can be useful for handling bursts of data or for ensuring data is not lost if the destination is unavailable.
- Transformation: It also allows you to transform data as it is collected or forwarded using a variety of plugins and methods, such as filtering, modifying, or enriching the data.
Filebeat is a popular choice for data collection and forwarding due to its scalability, flexibility, and ease of use. It is used by a wide range of organizations in various industries, including IT, operations, and software development.
3. Datadog
Datadog is a cloud-based monitoring and analytics platform that helps organizations to monitor and optimize the performance of their applications, infrastructure, and business processes. It provides a range of tools and features for monitoring, alerting, and troubleshooting, including -
- Metrics: Datadog allows you to collect and visualize metrics from a variety of sources, including servers, applications, cloud platforms, and containers. It provides a wide range of integrations with popular tools and platforms, such as AWS, Azure, and Google Cloud.
- Logs: Datadog also provides a log management platform that allows you to collect, index, and search log data in real time. It provides advanced search capabilities and allows you to create custom dashboards and alerts based on log data.
- Traces: Datadog provides distributed tracing capabilities that allow you to track the performance of individual requests as they pass through your applications and infrastructure. This can help you to identify bottlenecks and optimize performance.
- Alerting: Datadog provides a wide range of alerting options, including alerts based on metrics, logs, and traces, as well as integration with popular notification platforms, such as Slack, PagerDuty, and email.
Datadog is a popular choice for monitoring and analytics due to its comprehensive feature set and wide range of integrations.
4. Graylog
Graylog is an open-source log management platform that helps organizations to collect, index, and analyze log data from various sources in a centralized manner. provides a wide range of features for log management, including -
- Collection: Graylog allows you to collect log data from a variety of sources, such as servers, applications, network devices, and cloud platforms.
- Indexing: Graylog uses Elasticsearch to index and store log data, which makes it easy to search, analyze, and visualize log data in real time.
- Analysis: Graylog provides a range of tools and features for analyzing log data, including advanced search capabilities, real-time alerting, and dashboards for visualizing log data.
- Integration: Graylog can be integrated with monitoring tools, security systems, and cloud platforms, to provide a comprehensive view of your organization's IT infrastructure.
Graylog is a popular choice for a wide range of organizations like IT, security, and operations due to its increased flexibility and scalability functions.
5. Loggly
Solarwinds loggly is a scalable, cloud-based, enterprise log management solution used for real-time log aggregation and monitoring to view application performance for unusual activity across the stack. It can track, analyze and visualise your logs and aid in better performance. It provides a wide range of features for data collection, analysis, and visualization, including -
- Collection - With Loggly, you can gather log data from various sources, including servers, applications, and devices, and send it to a centralized log management platform for analysis and storage.
- Processing - This platform provides a variety of tools for searching, filtering, and visualizing your log data.
- Alerting - Loggly provides a wide range of alerting options, including alerts based on metrics, logs, and traces, as well as integration with popular notification platforms, such as Slack, PagerDuty, and email.
- Integration - It can be integrated with a variety of systems and platforms, including popular log analysis tools like Splunk and Elasticsearch, as well as monitoring and alerting tools like Nagios and PagerDuty.
Loggly is typically used by IT professionals, developers, and system administrators to troubleshoot issues, optimize performance, and identify trends and patterns in log data.
6. Splunk
Splunk is a commercial data collection, analysis, and visualization platform that is used to search, analyze, and visualize large volumes of machine-generated data, such as log data, application data, and security data. It provides a wide range of features for data collection, analysis, and visualization, including -
- Collection: Splunk allows you to collect data from a variety of sources, such as servers, applications, network devices, and cloud platforms, using a range of protocols, including Syslog, HTTP, and TCP.
- Indexing: Splunk uses its own proprietary indexing technology to store and organize data, which allows for fast searching and real-time analysis.
- Analysis: Splunk provides a wide range of tools and features for analyzing data, including advanced search capabilities, real-time alerting, and dashboards for visualizing data. It also provides a range of pre-built analytics apps and machine learning algorithms for common use cases, such as security, IT operations, and business analytics.
- Integration: Splunk can be integrated with a variety of other monitoring tools to provide a thorough review of your organization's data.
Splunk is a popular choice for data collection, analysis, and visualization due to its comprehensive feature set and wide range of integrations. It is used by a wide range of organizations in various industries, including IT, operations, and business analytics.
7. Fluentd
Fluentd is an open source data collector that allows you to collect, transform, and forward data from various sources to a variety of destinations. It is designed to be scalable, flexible, and easy to use, and provides a wide range of features for data collection and processing, including -
- Inputs: Fluentd provides a wide range of input plugins that allow you to collect data from various sources, such as servers, applications, network devices, and cloud platforms. It supports a variety of protocols, such as Syslog, HTTP, and TCP.
- Buffering: Fluentd provides a buffering feature that allows you to store data temporarily in memory or on disk before forwarding it to the destination. This can be useful for handling bursts of data or for ensuring data is not lost if the destination is unavailable.
- Outputs: It provides a wide range of output plugins that allow you to forward data to a variety of destinations, such as databases, message queues, and cloud platforms. It also supports a variety of formats, such as JSON and CSV.
- Transformation: Fluentd allows you to transform data as it is collected or forwarded using a variety of plugins and methods, such as filtering, modifying, or enriching the data.
Fluentd is a popular choice for data collection and processing due to its scalability, flexibility, and rich feature set. It is used by a wide range of organizations in various industries, including IT, operations, and software development.
8. Logtail
Logtail is a log collection and analysis tool developed by Alibaba Cloud. It is designed to help organizations collect, store, and analyze log data in a centralized manner.
Some of the key features of Logtail include -
- Collection: Logtail allows you to collect log data from a variety of sources, such as servers, applications, network devices, and cloud platforms.
- Indexing: Logtail uses Elasticsearch to index and store log data, which makes it easy to search, analyze, and visualize log data in real time.
- Analysis: Logtail provides a range of tools and features for analyzing log data, including advanced search capabilities, real-time alerting, and dashboards for visualizing log data.
- Integration: Logtail can be integrated with a variety of other tools and platforms, such as monitoring tools, security systems, and cloud platforms, to provide a comprehensive view of your organization's IT infrastructure.
Logtail is a popular choice for log management due to its scalability, flexibility, and rich feature set. It is used by a wide range of organizations in various industries, including IT, security, and operations.
9. Apache Kafka
Apache Kafka is a distributed streaming platform that is used for building real-time data pipelines and streaming applications. It is designed to be scalable, fault-tolerant, and high performance, and provides a range of features for building efficient and reliable data pipelines, including -
- Publish-subscribe messaging: Kafka allows producers to send messages to one or more topics, and allows consumers to subscribe to one or more topics and process the messages in real time.
- Persistence: Kafka stores all published messages for a configurable amount of time, allowing consumers to process the data at their own pace and providing fault tolerance in the event of a failure.
- Partitioning: Kafka allows topics to be partitioned, allowing multiple consumers to process the data in parallel and enabling horizontal scaling.
- Replication: Kafka replicates the data stored in each partition across multiple brokers, providing fault tolerance and high availability.
Kafka is widely used in a variety of industries, including finance, healthcare, and e-commerce, for a range of use cases, such as event sourcing, real-time analytics, and messaging. It is often used as the foundation for building data pipelines and streaming applications due to its scalability, fault tolerance, and high performance.
10. Syslog-ng
Syslog-ng is an open-source log management platform that is used to collect, process, and forward log data from various sources to a centralized location. It provides a wide range of features for log management, including -
- Collection: Syslog-ng allows you to collect log data from a variety of sources, such as servers, applications, network devices, and cloud platforms, using a range of protocols, including Syslog, HTTP, and GELF.
- Processing: Syslog-ng provides a wide range of tools and features for processing log data, including filtering, parsing, modifying, and enriching the data. It also allows you to create custom processing pipelines using a variety of plugins and methods.
- Forwarding: Syslog-ng can forward log data to a variety of destinations, such as databases, message queues, and cloud platforms, using a range of formats, such as JSON and CSV.
- Integration: Syslog-ng can be integrated with a variety of other tools and platforms, such as monitoring tools, security systems, and cloud platforms, to provide a complete view of your organization's IT infrastructure.
Syslog-ng is a popular choice for log management and is used by a wide range of organizations including IT, security, and operations.
Conclusion
In this article, we went through Logstash data processing features and discussed their advantages and limitations. Then we looked at the up-and-coming log management alternatives in the market and studied their services.
Data is humongous and managing it is no small task, a log managing and shipping unit is simply the right choice while handling such large quantities of data.
We hope this article helped you get a better understanding of the numerous new programs available now and to make a learned choice.
Atatus Logs Monitoring and Management
Atatus offers a Logs Monitoring solution which is delivered as a fully managed cloud service with minimal setup at any scale that requires no maintenance. It monitors logs from all of your systems and applications into a centralized and easy-to-navigate user interface, allowing you to troubleshoot faster.

We give a cost-effective, scalable method to centralized logging, so you can obtain total insight across your complex architecture. To cut through the noise and focus on the key events that matter, you can search the logs by hostname, service, source, messages, and more. When you can correlate log events with APM slow traces and errors, troubleshooting becomes easy.
#1 Solution for Logs, Traces & Metrics
![]() APM
APM
![]() Kubernetes
Kubernetes
![]() Logs
Logs
![]() Synthetics
Synthetics
![]() RUM
RUM
![]() Serverless
Serverless
![]() Security
Security
![]() More
More

![New Relic vs Splunk - In-depth Comparison [2026]](/blog/content/images/size/w960/2024/10/Datadog-vs-sentry--19-.png)
![Splunk vs Prometheus: A Side-by-Side Comparison [2025 Guide]](/blog/content/images/size/w960/2024/08/Datadog-vs-sentry--13-.png)