Top 9 Website Performance Monitoring Tools in 2024 (Free & Freemium)
It's common for "make sure the website's up" to be one of the first tasks we receive that we can classify as "website monitoring." We can do it for a friend's or relative's business, our website or blog, or employment. Additionally, checking the availability of a website is frequently the first monitoring task that calls for the use of a tool rather than a command.
According to IT professionals, most "is it running?" questions can simply be checked. PING and its several variations are used for this. But in this instance, that's not actually what we're being asked to do.
We need to know how it has been operating during the night while we were asleep in addition to if it is currently up and running. If it was down, how long did it remain down? Ideally, we should be informed if and when it goes down so that we can address the problem right away and get it back up and running.
The good news is that there are numerous website monitoring tools available to complete this task, and there is a cost-effective one. This article on the top website monitoring tools will be divided into two parts:
- Free
- Freemium: Free trial available
We will go over the following:
#1 Atatus
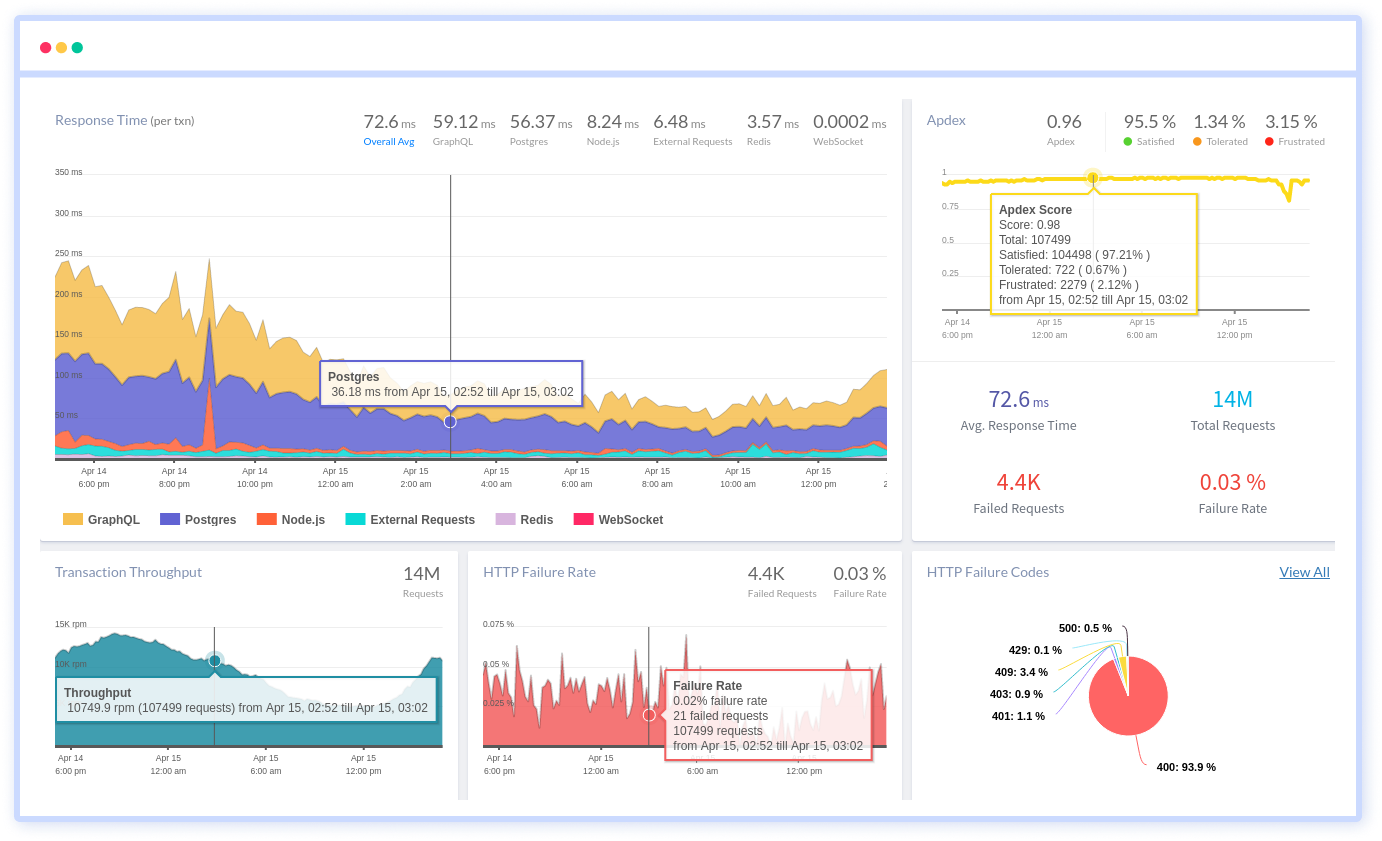
The SaaS-based application performance management platform Atatus offers full-stack visibility for all of your servers and applications. You can instantly fix issues and enhance the digital user experience by gathering millions of performance data points across applications. Such events also occur in real time due to the flexibility of cloud or on-premise deployment.
It offers a thorough overview of all the application performance metrics necessary to create reliable, high-quality software. You will be notified the moment the problem arises. It contains details like who did what when and what resulted in the performance loss.
It monitors the functionality of your applications and notifies you if there are any issues affecting the user experience. It evaluates the frontend and backend functionality of your complete application and uses Application Index (Apdex) ratings to analyze your user satisfaction levels.
It also fixes problems with application performance or accessibility before they have an impact on your users. By employing Real User Monitoring, you can better comprehend the complex frontend performance issues brought on by slow page loading, delayed static assets, and ajax queries.
You can also monitor JavaScript bugs that affect how your customers are treated. With application performance monitoring (APM), you can evaluate the performance of your backend and examine transaction histories, slow database queries, and outbound calls to other services.
Synthetic (Uptime) Monitoring by Atatus simulates user interaction to check the availability of your website or application. It analyzes the speed and functionality of your application and provides precise and useful insights in a simple interface.
Synthetic monitoring enables you to easily ensure the performance, functionality, and availability of your website by simulating traffic in a specific place. You can test the functionality of your website before your end-user runs into it before releasing your product in a new area.
Features:
- Monitor the health of your apps and receive notifications when problems with the user experience arise
- Utilize Apdex scores (Application Index) to assess frontend and backend performance and user satisfaction levels
- Fix performance or accessibility problems before they affect your customers
Atatus offers a free 14-day trial period during which users have unlimited access to all features without the need for a credit card. APM costs $0.07 per month, RUM $1.96 per month, Infra $0.014 per month, Log $2 per month, Synthetic $1.5 per month, and Analytics $1 per month. Reach out to us for a unique plan with premium support.
#2 Sematext
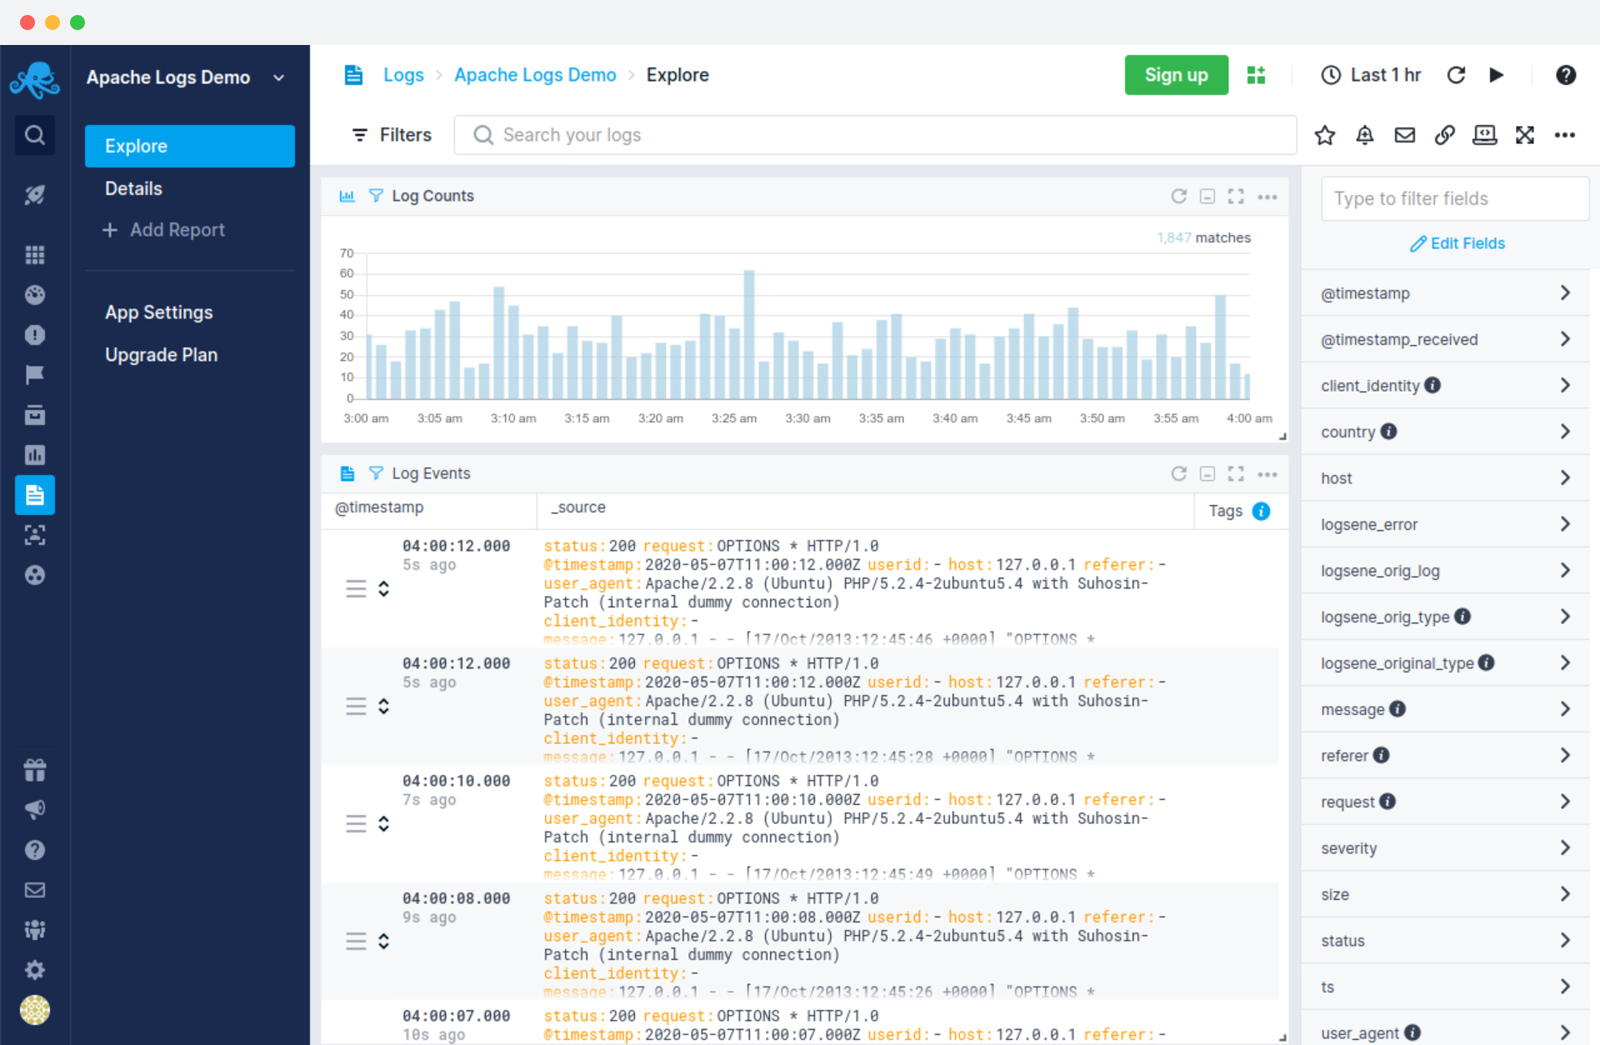
Sematext Cloud is a full-stack monitoring system that offers end-to-end visibility and observability. The suite's real user monitoring (RUM) solution, Sematext Experience, and a synthetic monitoring tool, Synthetics, are both available for website monitoring.
Sematext became the go-to tool for developers trying to get insight into their infrastructure while also keeping an eye on the metrics related to the user experience after the release of Sematext Experience and Synthetics.
With Sematext Experience, you'll receive a report on the actual experience and satisfaction of your users along with vital details about how well your website or application functions across various environments, gadgets, and connection speeds.
On the other hand, you can quickly set up Synthetic Monitoring to construct a complex framework of monitors for all of your resources. The monitors will ping your resources from various points across the world and send back data on things like website speed, uptime, error rates, responses to third APIs, SSL certificate expiry, and many other crucial data.
Features:
- A central repository for all of your logs, analytics, and events
- Determine which resources and requests are having the largest detrimental effects on the operation of your website.
- Debugging tools and real-time notifications
- Availability of all main frameworks
- Features that are very well documented
Every plan offers a 14-day risk-free trial without the need to add a credit card. Sematext also gives you precise control over your spending because each product is priced separately. In this way, you can only pay for the features and products you actually require.
#3 Datadog
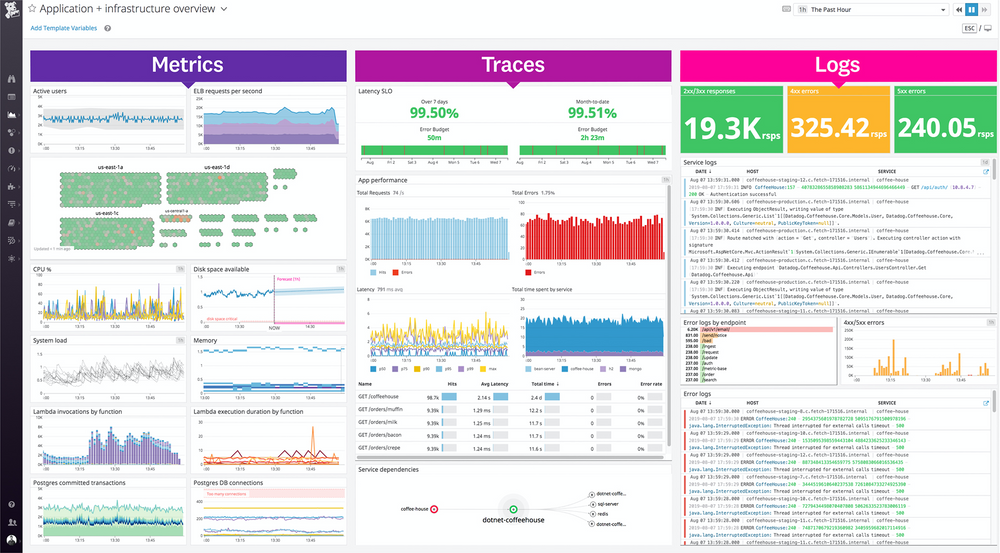
With Datadog Synthetics, you can generate alerts based on predefined criteria while also proactive monitoring your API endpoints. You'll be able to analyze network timings, which will eventually make it easier for you to identify the source of your issues.
Datadog Synthetics tests can be directly incorporated into your CI pipeline to enable early problem detection, allowing you to assess the condition of your production environment after each deployment and reduce downtime by fixing errors before your users ever see them.
Without creating a single line of code, you can use Datadog Synthetics to track all of your important transactions using the web recorder. There are a lot fewer failed tests as a result of end-user screenshots, step-by-step waterfall visualizations, and an intelligent system that can still identify elements after UI modifications.
Features:
- Track website uptime and latency
- Web-Recorder for creating tests without coding
- Self-maintaining Tests Powered by AI
Price-oriented Datadog Synthetics is designed exclusively for monitoring SLAs and SLs from locations throughout the world and costs $5 for every 10,000 tests done monthly.
With browser tests, you can record tests without using any code, self-maintaining intelligent tests, and screenshots for each step for as little as $12 per thousand tests.
#4 Dynatrace
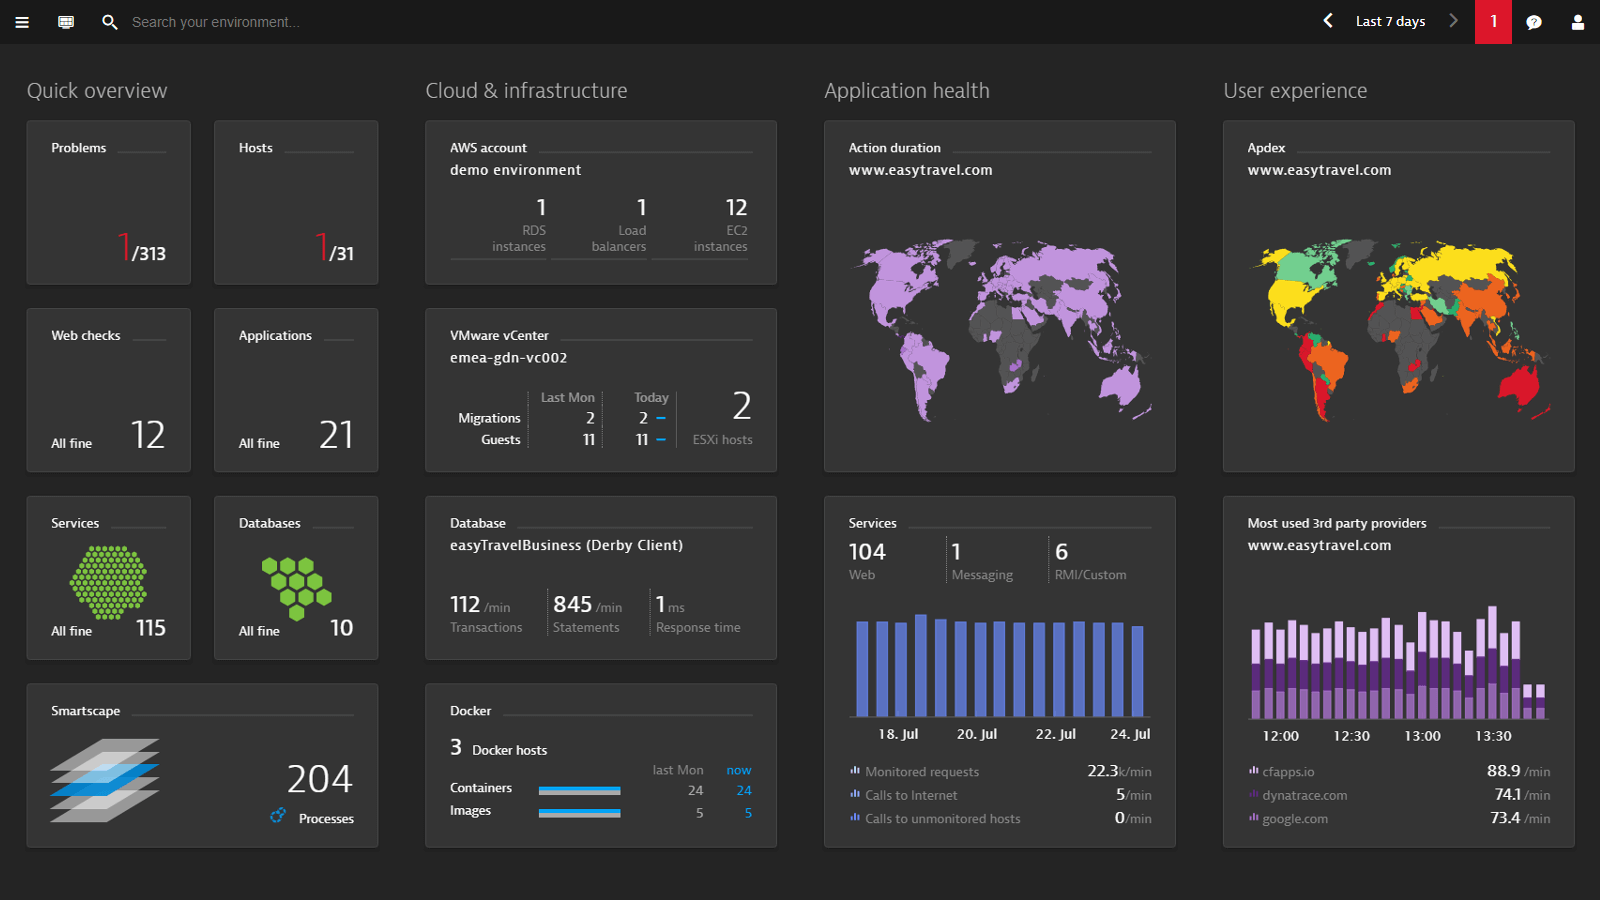
By measuring and logging key metrics, Dynatrace makes it simple to understand how your users are using your website and apps by keeping track of the performance and availability of your internal resources.
Dynatrace offers three distinct types of synthetic monitors. One of them, a single-URL browser monitor, can be configured to run from any of their reachable locations at a frequency of 5 minutes or more, imitating a user visiting your app or website.
The second is browser click paths, which behave like single-URL user actions but take a path across your application instead. The HTTP monitor, which may be configured and executed at different intervals, is the third version.
Features:
- Flexibility to use session replay, synthetic monitoring, and real-user monitoring
- Built with security and privacy in mind to satisfy your GDPR standards
- Real-user analytics monitoring for single-page, hybrid, and mobile applications
Dynatrace has simple pricing that starts at $11 per month for every 10,000 monitoring units. Real user monitoring, session replay, and synthetic monitoring are the three options available. Additionally, Dynatrace offers a risk-free trial.
#5 New Relic
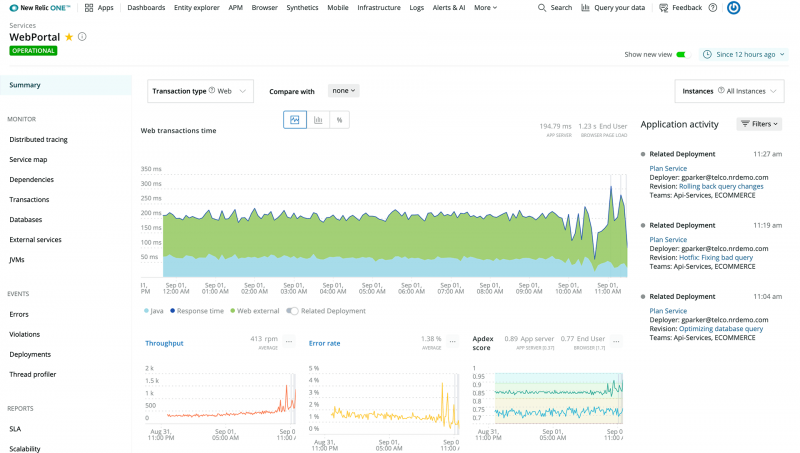
By volume, response time, callback time, throughput, and data transfer, New Relic Browser gives information on your resource-intensive queries. It provides a robust ecosystem for keeping an eye on your website and applications, which is typically more appropriate for big corporations and organizations with a lot of business-critical services.
New Relic Browser offers two data regions, one in the US and one in the EU, in keeping with the company's dedication to assisting its customers with their security. Additionally, they are SOC2 compliant, ensuring the safety of all customer data.
You can anticipate more modern metrics with New Relic Browser, as opposed to just plain old load times, that are focused on the needs of the customers. New Relic Browser will assist you in understanding how code changes affect end users by collecting informative paint times and interactivity metrics as well as providing a variety of insights on what slows down your website as well as all the numerous troubles you may encounter.
Features:
- Complete backing of Google's Core Web Vitals
- Unique dashboards
- Modern alerting mechanisms
- Integration with the ticketing system of your choice
Every additional GB used over the free cap will cost $0.25 for the Telemetry Data Platform. Full-Stack Observability is offered in three different pricing tiers: Standard, Pro, and Enterprise.
Each incident and subsequent occurrence will cost $0.50 for Applied Intelligence. On each of the three platforms, some services are free.
#6 Pingdom
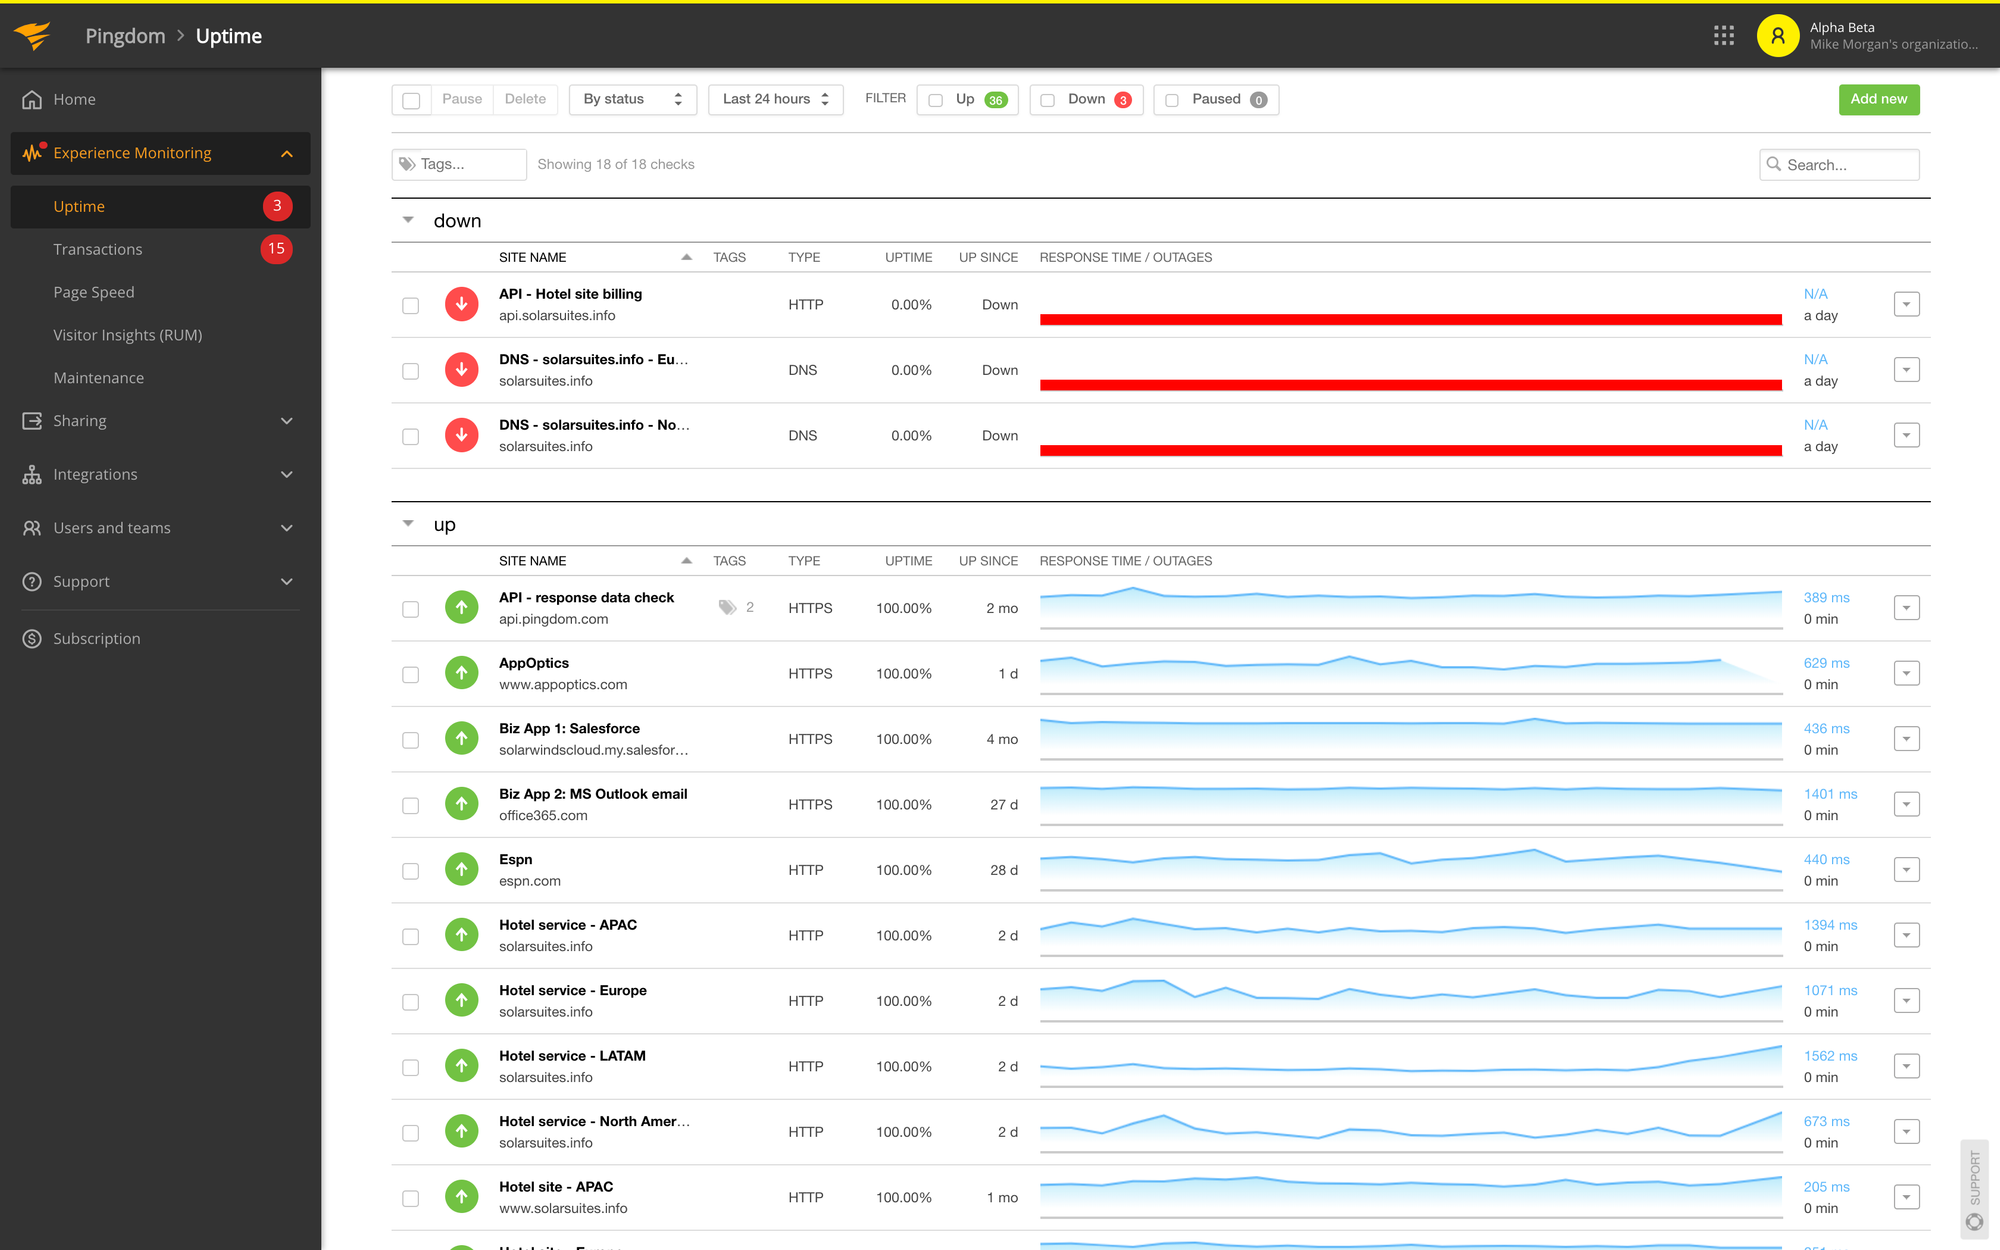
Pingdom is an uptime monitoring service that notifies users in-depth anytime an application or website is unavailable. Pingdom, which offers a wide range of capabilities including SSL certificate monitoring and website performance monitoring, has made its way into the list of the top monitoring services due to its user-friendly interface.
Pingdom offers real-time user monitoring services that track your website's visitors and let you improve your performance using information gathered from actual users. To ensure that your site will function at its peak regardless of where users are visiting it from, geographic performance is also being tracked.
Although you can monitor a large number of endpoints, performance seems to be affected, especially when monitoring single objects. Pingdom will tell you each time a service or third-party resource is unavailable.
However, there are occasionally irregularities with the alerting, as users have reported the service sending false positives or no alerts at all.
Features:
- Detailed user interfaces with convenient functions
- Quick alerting system
- Real-user monitoring and synthetic monitoring
- Notifications through SMS and email are available
With their $10/month entry-level subscriptions, you get 10 uptime monitors, 1 advanced monitor, and testing from their 100+ check locations spread out over the globe. Although they don't provide a free tier, you can check out all of their features during a 14-day trial.
#7 Site24x7
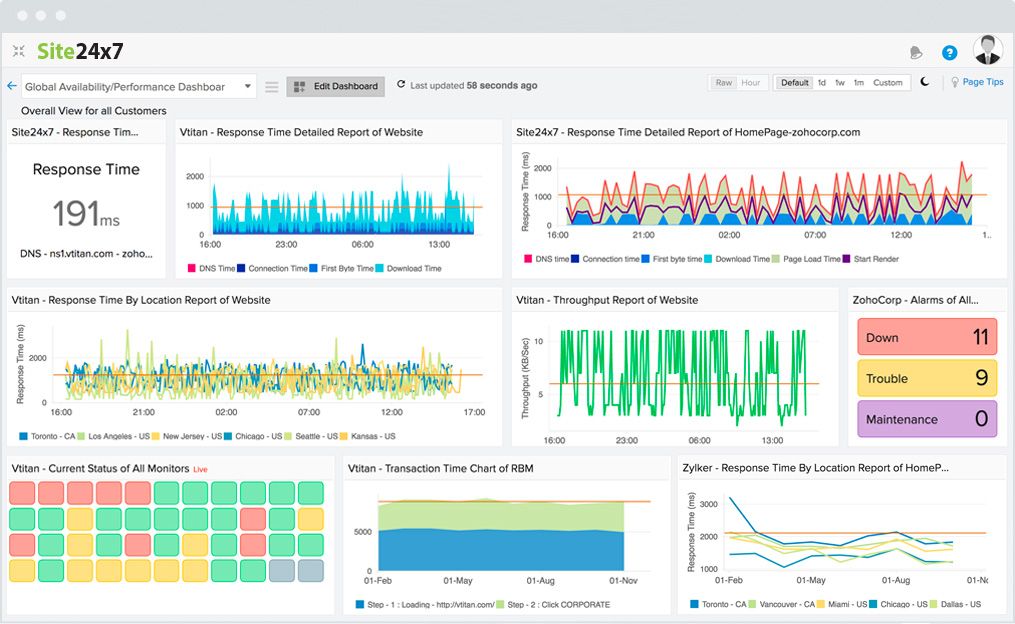
Site24x7 is quickly emerging as the standard for resource monitoring due to its outstanding products, quick and very friendly support staff, and an alerting system that sends notifications through email or SMS.
If a resource on your website or application experiences performance issues, excessive server CPU usage, timeouts, or any other concerns, Site24x7 will send out a thorough and detailed alert.
You can observe how visitors interact with your website and get a clear understanding of the actual problems that are affecting their experience in real time with the aid of their real-user monitoring tool.
Additionally, you may keep an eye on and comprehend the various variables influencing their experience, including browser, geography, isp, and platform.
Features:
- There is a smartphone application
- An easy and orderly arrangement
- Almost universal support for ecosystems
- You can choose between voice, email, and SMS notifications
One of the major advantages of the product is its affordable price options, which scale as your business grows. However, this benefit may be partly negated by the app's relatively archaic look, which occasionally feels confusing. It's important to note that all of their tiers offer a 30-day no-credit-card required free trial period.
#8 UptimeRobot
UptimeRobot has been the talk of the town for a while, and it's definitely one of the most cost-effective options available, especially if all you need is a simple tool to alert you when your services are unavailable.
The 50 monitors included in the free account are more than enough for the majority of small websites and online applications, and you also get 5-minute monitoring intervals from 12 different locations worldwide and three months of log storage.
UptimeRobot won't be the one if you're seeking a product that can offer you both real user monitoring and synthetic monitoring. As its name implies, it concentrates on running automated tests on your website and APIs every five minutes and sends alerts via several connections with tools like Slack, Pagerduty, OpsGnie, Telegram, and VictorOps.
While it may lack some capabilities, such as speed insights, the premium plan's 24-month log storage period and 1-minute checking intervals are fantastic extras.
Features:
- Establish particular requirements for your alerts using advanced notifications
- Easy setup procedure
- Heartbeat monitoring for the intranet and cron tasks
- Notifications through SMS and email are available
You can set up 50 monitors with UptimeRobot as part of their totally free, lifelong plan. Premium plans start at $18 per month or $180 per year while being promoted at $15 per month. While warnings are delivered by email on the free plan, SMS and audio messages are accessible in the premium version.
#9 StatusCake
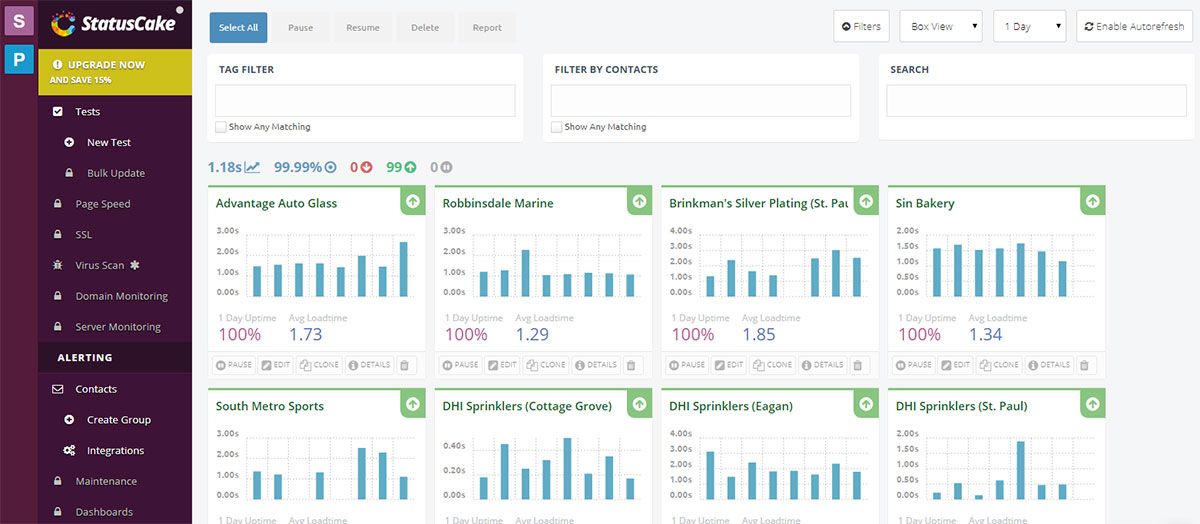
StatusCake keeps track of HTTP, HEAD, TCP, DNS, SMTP, SSH, PING, and PUSH. You may also monitor your Page Speed, Domain, Servers, and SSL certifications in addition to that.
A platform for uptime monitoring and public status pages is provided by StatusCake. You can automatically check your website's uptime every five minutes from 30 different countries with their free subscription.
Using the historical uptime monitoring data from StatusCake, which are accessible for up to a month old, you can compare the results and performance of your website.
You can use one of their 14 integrations, which include Datadog, Discord, OpsGenie, Pushover, Slack, and more, to get alerted immediately if there is ever an issue.
Features:
- In the most expensive plan, the monitoring frequency is for 30 seconds.
- Page speed monitoring
- Historical Uptime Data
A free subscription bundle from StatusCake comes with 10 monitors and a 5-minute frequency of monitoring. Once every 24 hours and once a week, page speed is assessed along with your domain.
Higher tiers with 1-minute or 30-second monitoring frequencies from custom locations are always available for upgrade. Three subscription options are available from Statuscake: Free, Superior, and Business.
Finally!!!
In the end, your requirements will determine which website performance monitoring tool you use. If I may be so bold as to offer a suggestion, there are more than enough options available.
Instead of rushing into anything, take the time to consider which metrics are crucial for your website and then select the tools that will allow you to closely analyze and monitor those metrics.
You have a 14-day free trial to check out all of its website monitoring features. Test it out for yourself!
Monitor Your Entire Application with Atatus
Atatus is a Full Stack Observability Platform that lets you review problems as if they happened in your application. Instead of guessing why errors happen or asking users for screenshots and log dumps, Atatus lets you replay the session to quickly understand what went wrong.
We offer Application Performance Monitoring, Real User Monitoring, Serverless Monitoring, Logs Monitoring, Synthetic Monitoring, Uptime Monitoring, and API Analytics. It works perfectly with any application, regardless of framework, and has plugins.

Atatus can be beneficial to your business, which provides a comprehensive view of your application, including how it works, where performance bottlenecks exist, which users are most impacted, and which errors break your code for your frontend, backend, and infrastructure.
If you are not yet an Atatus customer, you can sign up for a 14-day free trial.
#1 Solution for Logs, Traces & Metrics
![]() APM
APM
![]() Kubernetes
Kubernetes
![]() Logs
Logs
![]() Synthetics
Synthetics
![]() RUM
RUM
![]() Serverless
Serverless
![]() Security
Security
![]() More
More