How to Migrate from Stackify to Atatus Before Stackify's End of Life?
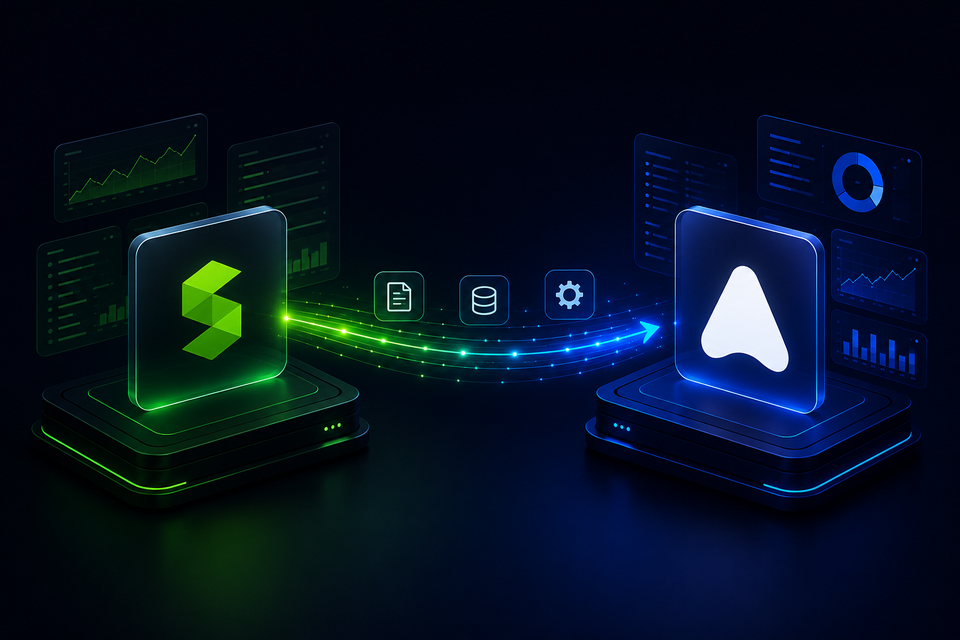
Stackify Retrace has entered its End of Life cycle. That doesn't mean your monitoring breaks tomorrow, but it does mean the clock is running: no new features, support limited to critical issues, and a hard cutoff date after which the platform stops being accessible entirely. For teams that have leaned on Retrace for .NET or Java APM for years, this is a forced but manageable transition, not an emergency.
The teams that come out of this migration cleanly are the ones who start early, treat it as a planned infrastructure project rather than a fire drill, and validate every signal before flipping the switch. This guide walks through that process end to end: what to inventory, how to stage the migration, how to run both platforms in parallel without doubling your alert noise, and how to know you're actually ready to retire Stackify for good.
If you're an engineering manager, DevOps engineer, SRE, or platform engineer who already understands observability concepts and just wants the migration mechanics, this is written for you.
On This Page:
- Why teams are leaving Stackify?
- Pre-migration inventory
- Understand current coverage
- Set up Atatus
- Install Atatus agents
- Configure logs, metrics, traces
- Recreate dashboards & alerts
- Run platforms in parallel
- Validate production readiness
- Common challenges
- Why teams choose Atatus?
- Stackify vs Atatus Comparison
- Migration checklist
- FAQs
Why teams are leaving Stackify?
BMC Helix, which owns Stackify Retrace, has confirmed the product's End of Life timeline directly. The key facts, straight from the official announcement:
- End of support date: March 31, 2027. After this date, Stackify Retrace will no longer be available or accessible. Since it's SaaS-only, there's no self-hosted fallback - no login, no data ingestion, no access to historical data.
- The product is now in maintenance mode. No new features or enhancements will ship. Only critical fixes and security patches will be delivered between now and the EOL date.
- The rationale is a platform shift. BMC is redirecting its observability investment toward BMC Helix AIOps, built on OpenTelemetry, as part of a broader move toward open, vendor-neutral telemetry standards. Some of Retrace's dependent cloud infrastructure is also scheduled for its own retirement around the same window.
- Data export is your responsibility. BMC has stated that customers need to export any data they want to retain before the cutoff.
None of this means you need to migrate this quarter. It does mean that "we'll deal with it later" quietly turns into a compressed, high-risk scramble if you wait until the final months. Evaluating and migrating now, while Retrace is still fully operational as a fallback is the lowest-risk path.
Pre-migration inventory
Before touching any agent or config, build a complete inventory of what's currently instrumented in Stackify. This is the single most skipped step in observability migrations, and it's the reason most "missing data after migration" incidents happen. Document:
- Applications and services - every app currently reporting into Retrace, including internal tools and low-traffic services people forget about
- Environments - production, staging, QA, and any environment-specific configuration
- Servers, containers, and Kubernetes clusters currently reporting infrastructure metrics
- Alert rules - thresholds, conditions, and the logic behind each one (not just the names)
- Notification channels - Slack, PagerDuty, email, webhooks, and who's on each
- Dashboards - both shared team dashboards and personal ones people rely on
- Saved searches and log queries people use routinely for debugging
- Log retention settings and what's actually being retained per environment
- Custom metrics anyone has instrumented manually
- Synthetic monitors, if you're running any elsewhere already, so they're not duplicated
- User access and roles - who has access to what, so the new platform mirrors it
Export what you can directly, and screenshot or document the rest. Anything that only exists as tribal knowledge "oh yeah, that alert only fires because of X" needs to be written down now, while the people who set it up still remember why.
Step 1: Understand Your Current Monitoring Coverage
Before you install a single new agent, map what's actually critical versus what's just present. Not everything in your Stackify account needs day-one parity in the new platform.
Identify:
- Critical services - the ones tied directly to customer-facing uptime or revenue
- Production workloads versus lower-priority staging/QA instrumentation
- Service dependencies - what calls what, so you don't miss a hop in distributed tracing
- Databases and query-level monitoring currently in place
- Queues and background/async jobs - the most commonly under-instrumented pieces in any APM migration
- Third-party API integrations you're currently tracking for latency or failure rates
Rank this list by business impact. Your migration sequencing in the next steps should follow this order, highest-impact services first, not alphabetical or whatever's easiest.
Step 2: Set Up Atatus
With your inventory and priority list in hand, set up the new environment before installing anything in production:
- Create your Atatus account and organization structure.
- Configure projects that mirror your service inventory one project per application or logical service grouping, matching how your team already thinks about ownership.
- Choose your monitoring strategy. Decide whether you're instrumenting with Atatus's native agents, OpenTelemetry, or a mix.
- Select integrations - cloud provider (AWS, GCP, Azure), Kubernetes, Slack/PagerDuty for alerting, and any CI/CD hooks for deployment tracking.
- Plan your rollout order based on the priority ranking from Step 1. Start with a single non-critical service to validate the process before touching anything customer-facing.
Step 3: Install Atatus Agents
Agent installation is language- and environment-specific. Atatus supports the same core languages Retrace does, plus broader infrastructure coverage:
- .NET (including .NET Core and ASP.NET MVC)
- Java (Spring, Hibernate, JVM-based frameworks)
- Node.js
- Python
- PHP
- Ruby
- Go
Refer documentation for more info: https://docs.atatus.com/docs/getting-started/supported-agents.html
For infrastructure:
- Containers and Docker
- Kubernetes via Helm chart deployment, with pod-level metrics and namespace health out of the box
- VMs and traditional cloud infrastructure
A few practices that reduce migration risk regardless of language:
- Install in staging first, even for services you consider low-risk. Validate the agent reports before touching production.
- Roll out one service at a time, not a blanket deployment across your whole fleet. This makes it trivial to isolate issues if something doesn't instrument correctly.
- Keep Retrace agents running during this phase. Don't remove anything yet, the entire point of the next few steps is validating Atatus against a known-good baseline.
- If you're on .NET with deep byte-code-level profiling requirements, note this is one area where Retrace's profiling is more granular. For the vast majority of production .NET monitoring needs, Atatus's coverage is comprehensive, but if your team depends on that specific level of local profiling, evaluate whether it affects your workflow before fully decommissioning Retrace.
Step 4: Configure Logs, Metrics and Traces
With agents reporting, configure the full telemetry picture:
- Application logs - point log shipping at Atatus, and validate structured fields are parsing correctly (not just arriving as raw text)
- Infrastructure metrics - CPU, memory, disk, and network across your servers and containers
- Distributed tracing - confirm traces are stitching together correctly across service boundaries, especially through queues and async jobs, which is where tracing gaps most commonly hide
- Custom metrics - reinstrument anything you had custom-built in Retrace
- Telemetry validation - compare a sample of traces, logs, and metrics side by side against what Retrace is currently reporting for the same time window
If you're using or adopting OpenTelemetry, this is the point where it pays off. Retrace requires its proprietary agent with no OTel path, meaning any OpenTelemetry instrumentation you build now works with Atatus (and stays portable to other backends in the future) rather than locking you into a single vendor's agent again.
Step 5: Recreate Dashboards and Alerts
This is usually the most time-consuming step, and the one most likely to be underestimated. Work through:
- Alert thresholds - don't just copy Retrace's thresholds blindly. Use the migration as an opportunity to review whether existing thresholds are still tuned correctly, since alert fatigue often accumulates silently over time.
- Notification channels - map every alert to the right Slack channel, PagerDuty service, or on-call rotation.
- Dashboards - rebuild your team's core operational dashboards first, then secondary/personal ones.
- Saved searches - recreate the log queries your team runs regularly during incidents.
- SLOs - if you're tracking service-level objectives, rebuild them with the same targets so historical comparisons stay meaningful.
- Incident workflows - confirm your incident tooling (PagerDuty, Opsgenie, etc.) is wired to the new alert source, not still pointed at Stackify.
Step 6: Run Both Platforms in Parallel
This is the step that separates a clean migration from a risky one. Don't cut over the moment Atatus looks functional, run both platforms simultaneously for at least one full deployment cycle, ideally longer for critical services.
During the parallel-run window, compare:
| Signal | What to check |
|---|---|
| Metrics | Do CPU, memory, and throughput numbers match within expected variance? |
| Alerts | Are the same conditions firing in both systems, at the same time? |
| Traces | Are trace spans complete, and do trace counts roughly match request volume? |
| Errors | Is error tracking catching the same exceptions, with the same frequency? |
| Dashboards | Do the numbers your team looks at daily match across both tools? |
| Latency | Are p50/p95/p99 latency figures consistent between platforms? |
| Coverage | Are all services from your original inventory reporting in Atatus? |
Only move to full cutover once this comparison holds up consistently, not just on a good day, but across a normal traffic cycle including your peak load periods.
Step 7: Validate Production Readiness
Before decommissioning Stackify, run through a structured readiness check:
- Application health - confirm every service from your inventory is reporting and healthy in Atatus
- Alert testing - deliberately trigger a few test alerts and confirm they reach the right people through the right channel
- Performance baselines - establish new baseline metrics in Atatus so future anomaly detection has a real reference point
- Incident simulation - run a tabletop or live-fire incident drill using Atatus as the primary monitoring source, before you actually need it during a real incident
- Dashboard validation - walk through each rebuilt dashboard with the team that uses it daily and get explicit sign-off
- Telemetry completeness - cross-check your original inventory list against what's now live in Atatus, line by line
- Error tracking - confirm error grouping and deduplication logic is behaving as expected
- Log ingestion - verify retention settings and confirm historical logs you exported from Stackify are accessible where your team expects them
Only after this checklist is fully green should you schedule the Stackify decommission.
Common Migration Challenges (and How to Avoid Them)
- Missing telemetry - usually traced back to skipping the inventory step. This is why the inventory phase matters more than any technical step that follows.
- Incomplete instrumentation - background jobs, queues, and cron tasks are the most commonly forgotten services. Explicitly check for these during Step 1.
- Alert fatigue - don't recreate every alert exactly as it was. Use the migration to prune alerts that have gone stale or noisy.
- Too much data, not enough signal - if your Retrace setup had grown unwieldy over time, this is a natural checkpoint to consolidate dashboards rather than replicate sprawl.
- Incorrect sampling - if you're adopting distributed tracing more fully in Atatus than you had in Retrace, validate your sampling rate doesn't silently drop the traces that matter for debugging rare failures.
- Dashboard inconsistencies - assign explicit dashboard owners (see Step 5) to avoid this.
- Developer adoption - the biggest non-technical risk. Run a short internal walkthrough once dashboards are rebuilt, so the team trusts the new tool before Stackify is turned off.
Stackify Retrace EOL is 271 days away - migrate before you lose access.
Why teams choose Atatus?
Setting marketing language aside, here's what practically changes for a team migrating off Stackify:
- Unified observability - APM, logs, infrastructure, RUM, synthetic monitoring, and API analytics live in one platform rather than requiring separate tools bolted onto Retrace for anything beyond backend APM.
- OpenTelemetry-native support - instrumentation stays portable rather than locked into a single proprietary agent.
- Kubernetes and container-native monitoring - pod-level metrics, namespace health, and cluster dashboards out of the box, an area Retrace was not primarily built for.
- Infrastructure and cloud coverage - pre-built dashboards for common AWS, GCP, and Azure services.
- Fast onboarding - most teams report a straightforward setup process with auto-instrumentation reducing the manual configuration burden.
- 24/7 support on every plan, including trials - relevant if your team has previously waited on business-hours support during an off-hours incident.
- Active product development since Atatus isn't in maintenance mode, the platform continues shipping new capabilities rather than functionally stabilizing.
Each of these ties directly back to gaps teams commonly hit once Retrace stopped expanding beyond APM and logging: no synthetic monitoring, no session replay, and no OpenTelemetry path.
Stackify vs Atatus Comparison
| Capability | Stackify Retrace | Atatus |
|---|---|---|
| End of Life status | EOL confirmed - March 31, 2027 | Actively developed |
| APM | Yes (.NET/Java-strong) | Yes (.NET, Java, Node.js, Python, PHP, Ruby, Go) |
| Logs | Yes | Yes, unified with APM and traces |
| Infrastructure monitoring | Basic server monitoring | Full infra, container, and Kubernetes monitoring |
| Distributed tracing | Yes, code-level for .NET/Java | Yes, cross-service, OTel-native |
| Real User Monitoring (RUM) | Not available | Included, with Core Web Vitals and session replay |
| Synthetic monitoring | Not available | Included, global checks |
| OpenTelemetry | No native support | Native support |
| Dashboards | Yes | Yes, with cross-signal correlation |
| Alerting | Yes | Yes |
| Support | Business hours | 24/7, all plans including trials |
| Pricing model | Host-hour billing, prod/non-prod tiers, overage charges | Flat per-host pricing |
| Roadmap | Maintenance mode, no new features | Active development |
| Developer experience | Established, .NET/Java-centric | Auto-instrumentation, broader stack coverage |
Migration checklist
| Migration Checklist |
|---|
| ✓ Complete full inventory (services, dashboards, alerts, users) |
| ✓ Rank services by business criticality |
| ✓ Export Stackify logs and dashboard configs |
| ✓ Set up Atatus projects and integrations |
| ✓ Install Atatus agents (staging first, one service at a time) |
| ✓ Configure logs, metrics, and distributed tracing |
| ✓ Validate telemetry against Stackify for a sample time window |
| ✓ Rebuild dashboards and assign owners |
| ✓ Recreate alerts and notification routing |
| ✓ Run both platforms in parallel for a full deployment cycle |
| ✓ Compare metrics, alerts, traces, errors, and latency across both tools |
| ✓ Run an incident simulation using Atatus as primary |
| ✓ Get sign-off from dashboard owners and on-call teams |
| ✓ Confirm exported historical data is accessible |
| ✓ Decommission Stackify agents and cancel subscription |
Conclusion
A Stackify-to-Atatus migration isn't a single weekend project, it's a staged process: inventory, setup, instrumentation, validation, and a deliberate parallel-run period before cutover. Teams that follow that sequence typically move without losing coverage or triggering alert fatigue along the way.
The most important decision isn't which platform to choose, it's when to start. Every month of runway before Stackify's March 2027 End of Life gives your team more room to validate telemetry properly instead of rushing a cutover under deadline pressure. Starting the evaluation now, even with a single low-risk service, costs very little and removes most of the risk from the eventual full migration.
Ready to plan your migration from Stackify to Atatus?
Atatus's onboarding team offers free migration support, mapping your current Retrace coverage language by language and validating parity before you retire Stackify.
FAQs
1) How long does a Stackify to Atatus migration take?
It depends on the number of services and the complexity of your alerting setup, but most teams complete core instrumentation within a week and spend an additional one to two deployment cycles running both platforms in parallel before fully cutting over.
2) Can both platforms run together during migration?
Yes, and it's the recommended approach. Running Retrace and Atatus in parallel lets you validate signal parity before decommissioning anything, which significantly reduces migration risk.
3) Will I lose historical data if I switch?
Not if you export it beforehand. Plan your export well before the EOL cutoff date, since access ends entirely after March 31, 2027.
4) Can Atatus fully replace Stackify?
For the large majority of teams, yes - Atatus covers APM, logging, infrastructure, and adds RUM, synthetic monitoring, and API analytics that Retrace doesn't offer natively. The one narrow exception is teams that depend heavily on Retrace's byte-code-level .NET profiling or the Prefix local dev tool, where the equivalent isn't a like-for-like match.
5) Does Atatus support OpenTelemetry?
Yes, natively. This is a meaningful difference from Retrace, which requires its proprietary agent with no OTel migration path.
6) How difficult is the migration, technically?
Agent installation itself is generally straightforward per language. The more time-consuming work is rebuilding dashboards, alerts, and validating telemetry parity, which is why following a staged process matters more than the raw technical difficulty.
7) Do I need to replace my existing agents?
Yes. Since Stackify uses proprietary agents, you'll install Atatus agents (or point existing OpenTelemetry instrumentation at Atatus) for each service.
8) Will my dashboards need to be rebuilt manually?
Yes, dashboards don't migrate automatically between platforms. Document your existing dashboards during the inventory phase so rebuilding them is a matter of recreation rather than reconstruction from memory.
9) Can I migrate gradually, service by service?
Yes, and it's the recommended approach over a big-bang cutover. Start with a lower-risk service, validate the full process end to end, then apply the same pattern to higher-priority services.
10) How can I minimize downtime during migration?
Downtime risk in this kind of migration is almost always about monitoring blind spots, not application downtime itself, since you're adding an agent, not modifying application logic. Running both platforms in parallel is what actually protects you from a monitoring gap during the transition.
#1 Solution for Logs, Traces & Metrics
 APM
APM
Kubernetes
Logs
Synthetics
RUM
Serverless
Security
More