Node.js Event Loop: Why Monitoring Matters
Node.js has become a cornerstone for modern application development because of its non-blocking and asynchronous architecture. According to Stack Overflow Developer Survey, Node.js remains among the most widely used technologies for web applications, powering millions of services globally. While this event-driven model provides scalability and efficiency, it also introduces challenges. At the core of Node.js lies the event loop, and when it slows down or becomes blocked, the entire application’s performance takes a hit.
This is where a Node.js performance monitoring tool becomes essential. Monitoring the event loop not only helps identify bottlenecks but also optimizes response times and ensures a smooth user experience. Without visibility into the event loop, issues can go unnoticed until users experience delays, errors, or crashes.
What’s in this guide?
- Understanding the Node.js Event Loop
- How Bottlenecks Impact Node.js Applications?
- Why Monitoring the Node.js Event Loop is Crucial?
- Features of a Good Node.js Performance Monitoring Tool
- Benefits for DevOps Teams and Engineers
- How Atatus Handles Node.js Event Loop Monitoring?
- Conclusion
- FAQs on Node.js Monitoring
Understanding the Node.js Event Loop
Node.js is designed for efficiency. Instead of creating a new thread for every request, Node.js uses a single-threaded event loop. This is what enables it to handle thousands of connections at once without burning resources.
How It Works?
- Incoming requests are placed in a queue.
- The event loop picks up tasks one by one.
- Non-blocking tasks (like database queries, network calls, or file reads) are delegated to system APIs and revisited later.
- Once results return, callbacks are pushed back into the queue and processed.
This loop repeats indefinitely, as long as there are tasks waiting.
Phases of the Event Loop
- Timers: Executes
setTimeout()andsetInterval()callbacks. - Pending callbacks: Processes I/O callbacks deferred from the previous cycle.
- Poll: Retrieves new I/O events and executes callbacks.
- Check: Executes
setImmediate()callbacks. - Close callbacks: Handles socket and handle closures.
Why It Matters?
Because everything runs on one loop, blocking operations block everything. If you have a heavy JSON parse, a large file read, or a synchronous loop running for 500ms, then:
- All requests arriving in that window get delayed.
- Even lightweight requests (like fetching user details) wait for the blocking task to finish.
That’s where monitoring becomes critical. Without visibility, you’re left guessing why performance is degrading.
How Bottlenecks Impact Node.js Applications?
Bottlenecks in the event loop can seriously damage performance. Since the event loop runs on a single thread, anything that blocks it will block the entire application.
Some common bottlenecks include:
- Synchronous operations: Blocking file reads, database queries, or loops with heavy processing can prevent the event loop from handling other requests.
- Memory leaks: Inefficient memory usage builds up over time and slows the event loop.
- Poorly optimized code: Nested callbacks, or unnecessary dependencies increase CPU load.
- Third-party modules: A faulty or heavy library can keep the event loop occupied for too long.
The impact of these bottlenecks is significant:
- Slow response times: Users wait longer, which leads to poor experience.
- Increased error rates: Requests may time out.
- Resource exhaustion: CPU and memory usage spike, leading to crashes.
- Lost business value: Performance issues directly affect conversions, user trust, and revenue.
For businesses running critical services on Node.js, ignoring event loop bottlenecks is risky.
Node.js slowing down? Monitor with Atatus and catch issues early
Why Monitoring the Node.js Event Loop is Crucial?
Monitoring the event loop helps development and operations teams understand how the application behaves under different conditions. Without it, bottlenecks remain hidden until they cause downtime or performance degradation.
Here’s why event loop monitoring matters:
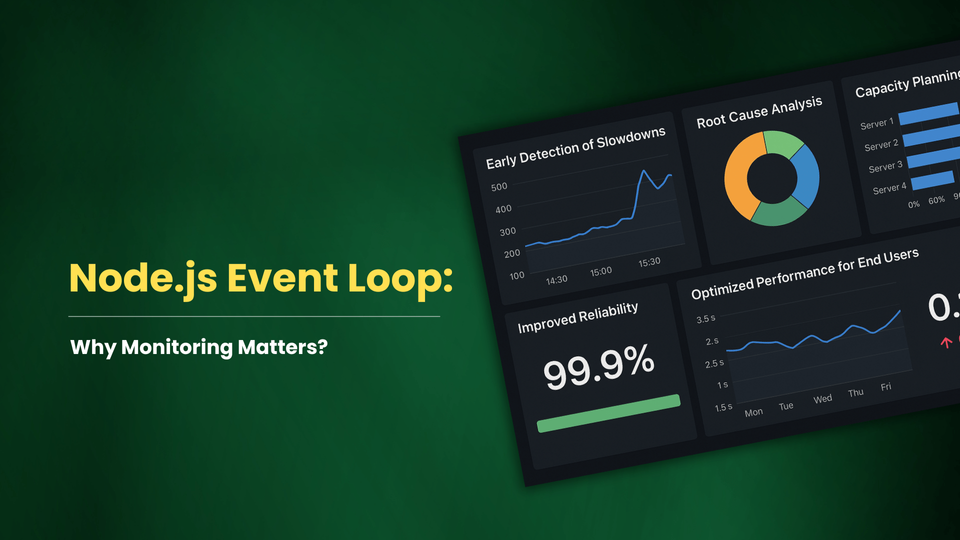
- Early detection of slowdowns
The event loop lag metric shows how much time the loop is blocked. When this value increases, teams know immediately where performance is suffering.
- Root cause analysis
Monitoring reveals which functions or operations are blocking the loop. This helps developers pinpoint whether it is a database query, third-party dependency, or custom logic causing delays.
- Capacity planning
With monitoring, DevOps teams can identify when applications reach their performance limits and decide whether to scale infrastructure or optimize code.
- Improved reliability
Keeping the event loop healthy ensures requests are processed quickly, reducing downtime and user complaints.
- Optimized performance for end users
By detecting bottlenecks before they affect users, teams deliver a smoother experience across web and mobile platforms.
Stop the guesswork. Monitor Node.js in real time
Features of a Good Node.js Performance Monitoring Tool
Not all monitoring tools provide the same visibility. For a Node.js application performance monitoring tool to be effective, it should have the following features:
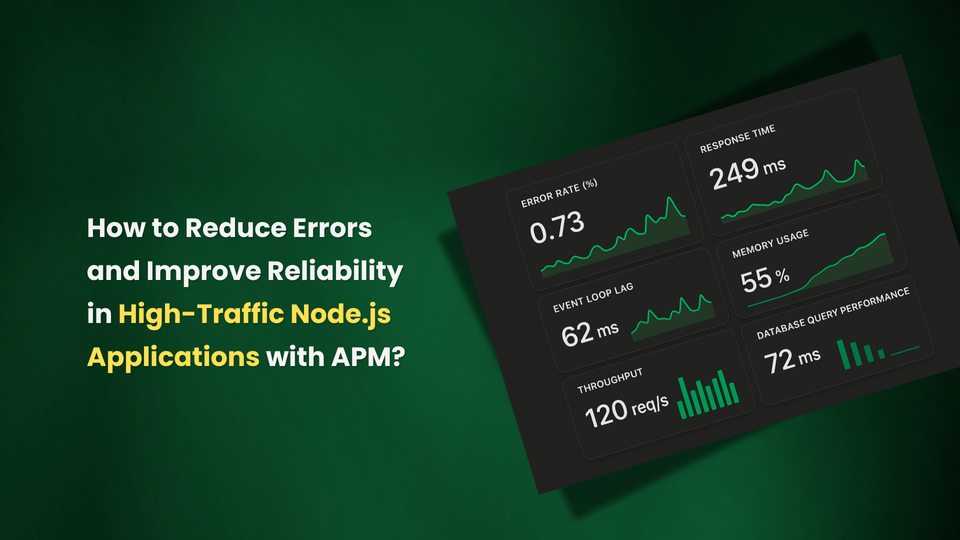
- Event Loop Lag Tracking: Measures delays in the event loop to detect blocking code or bottlenecks.
- Real-Time Metrics: Provides insights into CPU usage, memory consumption, garbage collection, and throughput.
- Transaction Tracing: Traces individual requests to show where time is spent, from incoming request to database query and external API calls.
- Error Tracking and Alerts: Captures unhandled exceptions, and runtime errors. Alerts ensure that teams respond quickly.
- Dependency Monitoring: Identifies performance impact from third-party modules, APIs, and microservices.
- Scalable Dashboards: Intuitive dashboards that scale with the team, making it easier for developers, DevOps, and SREs to collaborate.
- Integration with CI/CD Pipelines: Supports automation by integrating with existing workflows, making performance monitoring part of the release cycle.
- Cost Efficiency: Provides visibility without skyrocketing infrastructure or licensing costs.
A monitoring tool with these features helps engineering teams maintain reliability while staying ahead of performance challenges.
Benefits for DevOps Teams and Engineers
Monitoring the event loop is not just a developer concern. It is equally valuable for operations and reliability teams. Here is how different teams benefit:
- Developers: Debug performance issues faster, optimize code, and deliver stable releases.
- DevOps Engineers: Monitor resource utilization, detect slowdowns, and maintain uptime.
- SREs (Site Reliability Engineers): Ensure service-level objectives (SLOs) are met with reduced error rates and better incident response.
- Engineering Managers: Gain visibility into team productivity and application performance, helping make strategic decisions.
By aligning all these roles with real-time insights, businesses can maintain customer trust and deliver high-performing applications.
How Atatus Handles Node.js Event Loop Monitoring?
Atatus is a comprehensive Node.js application performance monitoring tool designed for modern teams. It provides full visibility into the event loop along with advanced monitoring capabilities.
Here is how Atatus makes Node.js event loop monitoring effective:
- Event Loop Metrics: Atatus tracks event loop lag in real time, allowing teams to see when and where bottlenecks occur.
- End-to-End Tracing: It follows each request across the stack, from incoming traffic to database queries and external services.
- Error Tracking: Detects runtime errors, and exceptions with detailed diagnostic data.
- Performance Dashboards: Offers intuitive, high-resolution dashboards that provide deep insights without overwhelming users.
- Seamless Integrations: Works with popular services, frameworks, and cloud providers, fitting easily into your DevOps workflow.
- Scalable and Cost-Effective: Atatus pricing is designed to scale with teams rather than data volume, making it accessible for startups and enterprises alike.
By combining these features, Atatus provides actionable insights to keep your Node.js applications healthy and reliable.
Conclusion
The Node.js event loop is at the core of every application built on this platform. Bottlenecks and delays directly affect user experience and system reliability. Without monitoring, these issues remain invisible until they damage performance and business outcomes.
A strong Node.js performance monitoring tool gives development and operations teams the visibility they need to detect slowdowns, troubleshoot errors, and optimize applications.
Atatus is built to provide this visibility in a simple, powerful, and cost-effective way. With real-time event loop monitoring, request tracing, and error tracking, Atatus empowers developers, DevOps teams, and SREs to deliver reliable and scalable applications.
If you want to keep your Node.js applications fast, stable, and ready to scale, Atatus is the solution you need.
Take Control of Your Node.js Performance Today
Don’t let event loop bottlenecks slow your Node.js apps. Gain full visibility and resolve issues before they escalate.
Start Free TrialFAQs on Node.js Monitoring
1) Can monitoring the event loop prevent downtime?
Yes. Monitoring the Node.js event loop can help prevent downtime in several ways:
- Early detection of bottlenecks: Continuous monitoring highlights slow or blocking operations before they impact users.
- Proactive issue resolution: Teams can fix performance problems as they appear rather than waiting for incidents to escalate.
- Reduced request failures: By keeping the event loop healthy, applications can process requests efficiently, lowering the risk of timeouts or errors.
- Maintained SLAs: Event loop monitoring supports service-level agreements by ensuring consistent response times and system availability.
- Optimized user experience: Faster response times lead to smoother interactions, preventing frustration and churn.
- Actionable insights: Provides developers and DevOps teams with detailed information about which code paths or dependencies are causing slowdowns, allowing precise fixes.
2) Is Atatus suitable for both small and large Node.js applications?
Absolutely. Atatus is designed to scale with teams and applications. It provides high-resolution metrics and insights without overwhelming your system or driving up costs, making it suitable for startups and enterprise-grade Node.js applications.
3) How can event loop monitoring improve developer productivity?
Monitoring the event loop gives developers clear insights into which parts of the code or dependencies are causing delays. This reduces time spent on blind debugging, helps prioritize fixes, and allows teams to release features faster without compromising application performance.
4) What types of issues can Node.js performance monitoring detect?
A Node.js performance monitoring tool like Atatus can detect:
- Event loop lag and blocking operations
- Slow API responses or database queries
- Memory leaks and CPU spikes
- Unhandled exceptions
- Slow external service calls or third-party integrations
These insights help teams quickly address performance problems before they impact users.
5) Can monitoring the Node.js event loop help optimize infrastructure costs?
Yes. By identifying bottlenecks and inefficient code, monitoring helps teams avoid over-provisioning servers or cloud resources. This ensures that infrastructure is used efficiently, reducing unnecessary expenses while maintaining high performance.
#1 Solution for Logs, Traces & Metrics
![]() APM
APM
![]() Kubernetes
Kubernetes
![]() Logs
Logs
![]() Synthetics
Synthetics
![]() RUM
RUM
![]() Serverless
Serverless
![]() Security
Security
![]() More
More

![What is Node.js Performance Monitoring? [A Complete Guide]](/blog/content/images/size/w960/2025/07/What-is-Node.js-Performance-Monitoring---A-Complete-Guide.png)