The 12 Best Nagios Alternatives in 2025

Are you looking for a Nagios alternative? Then you have come to the right place.
In this blog, we will go through the top Nagios alternatives available today. But before that, let’s briefly look at what Nagios offers and why some teams might consider switching to another monitoring solution.
In this Blog Post,
- Understanding Nagios and the Need for Nagios Alternatives
- The 12 Best Nagios Alternatives in 2025
- How to Choose the Right Nagios Alternative?
- Getting Started with Atatus
Understanding Nagios and the Need for Nagios Alternatives
Nagios is one of the oldest and most widely used infrastructure monitoring tools, known for its flexibility and extensive plugin support. It allows teams to monitor network devices, servers, applications, and services, and can be extended to cover a wide range of use cases through community-contributed plugins.
However, Nagios may present several challenges, especially for modern DevOps and cloud-native teams. Its core architecture is outdated, making it less suited for dynamic environments like Kubernetes or microservices. Configuration can be complex and time-consuming, and scaling the system often requires significant manual intervention.
Organizations often seek Nagios alternatives to:
- Reduce setup and maintenance complexity
- Gain out-of-the-box support for modern cloud-native environments
- Improve visualization and user experience
- Adopt solutions with more active development and community support
- Explore commercial or fully-managed options for scalability
Additionally, while Nagios is free and open-source at its core, advanced functionality typically requires Nagios XI (the commercial version), which introduces additional licensing costs. Moreover, many users find its UI outdated and less intuitive, especially compared to newer platforms offering real-time dashboards and automated discovery.
To address these concerns, we have curated a list of modern and feature-rich alternatives to Nagios that are worth exploring.
The 12 Best Nagios Alternatives in 2025:
- Atatus
- Zabbix
- Datadog
- Site 24x7
- Prometheus
- Graphite
- Sematext
- Sumo Logic
- Dotcom-monitor
- OpenNMS
- Checkmk
- Icinga
Atatus
Atatus is a strong alternative to Nagios, especially for teams looking for a modern, all-in-one monitoring platform with minimal setup and a clean user experience.
Unlike Nagios, which often requires extensive manual configuration and plugin management, Atatus delivers end-to-end observability out of the box.
It covers everything from infrastructure and application monitoring to real user monitoring (RUM) and log management, all in a single, unified platform.
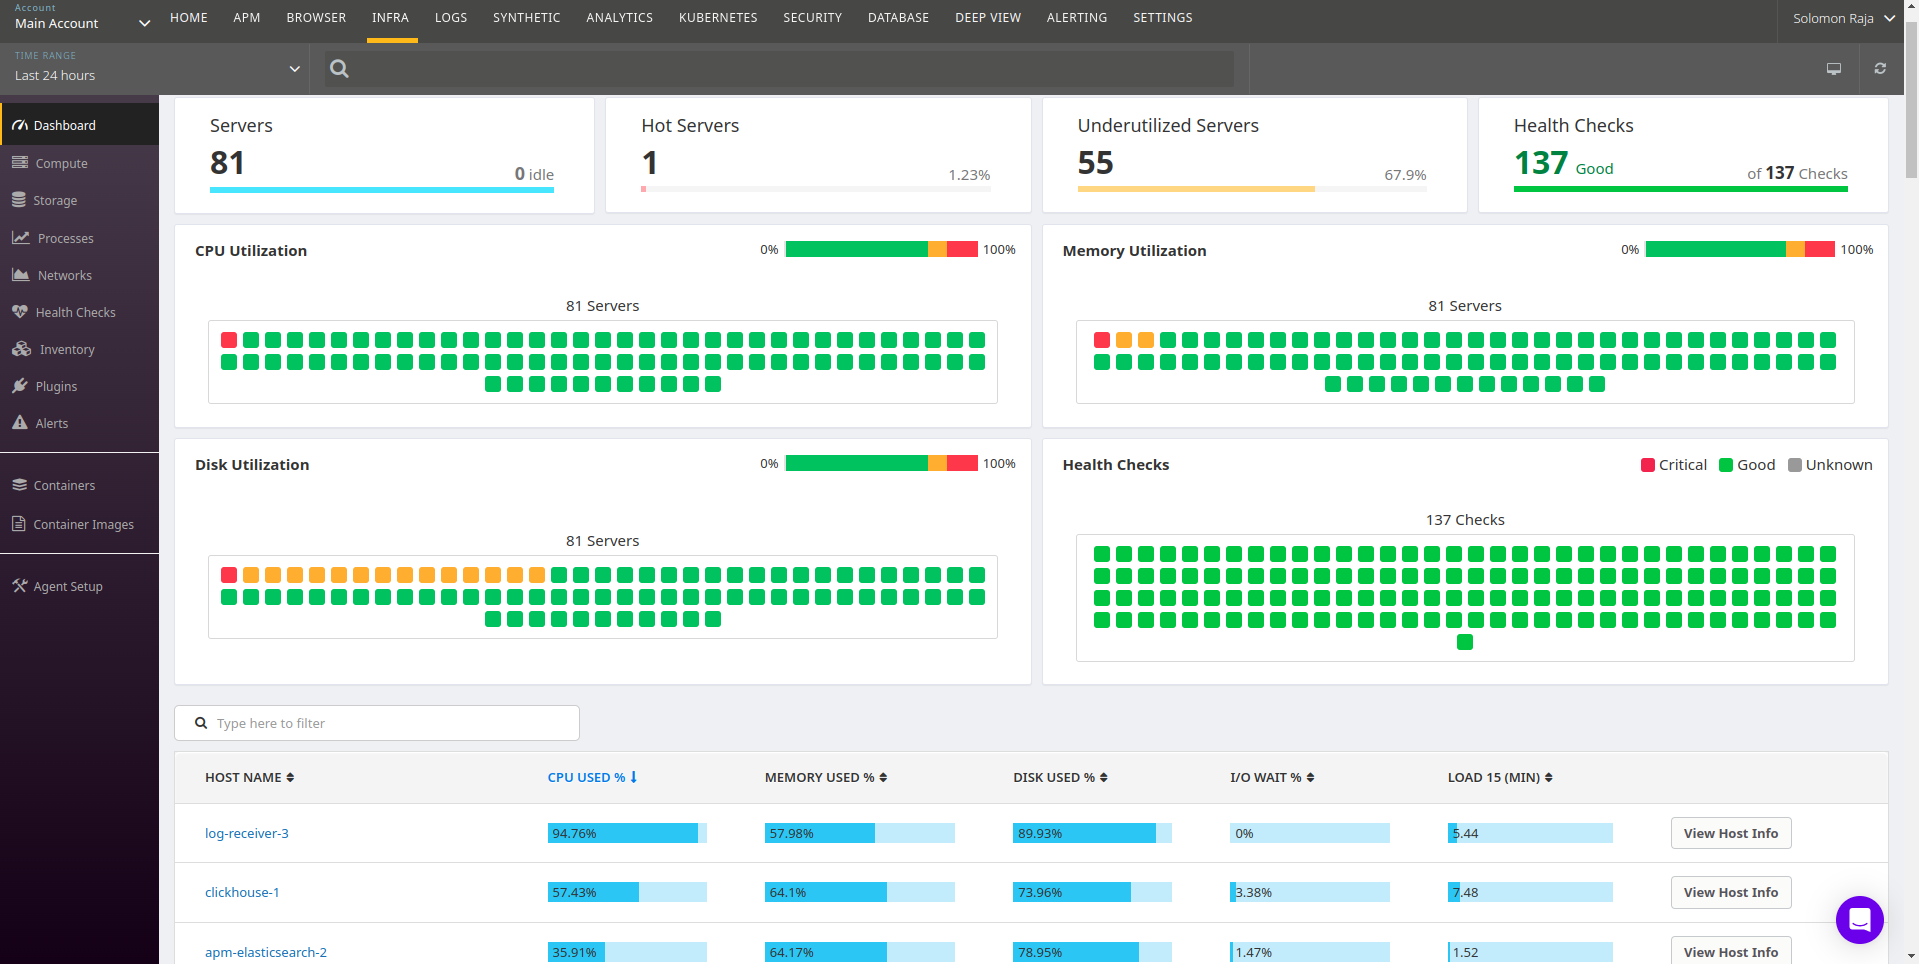
Atatus dashboard offers a modern interface with pre-built widgets and visualizations. Unlike Nagio's traditional interface, Atatus emphasizes clarity, usability, and accessibility across all observability features.
Atatus is designed for modern DevOps and engineering teams who need real-time insights across the entire tech stack without the complexity of managing multiple tools or writing custom scripts.
Key Features of Atatus:
- Infrastructure Monitoring: Monitor your servers, containers, and cloud services with detailed metrics like CPU usage, memory consumption, disk I/O, and network traffic. The dashboards are automatically generated and easy to customize.
- Application Performance Monitoring (APM): Track application performance down to the transaction level. Get real-time insights into response times, throughput, slow queries, and performance bottlenecks across various backend services.
- Real User Monitoring (RUM): Understand how your users interact with your application in real-time. You can monitor page load times, frontend performance metrics, and user journeys to optimize the user experience.
- Log Management: Collect, index, and analyze logs from your entire stack. Correlate logs with application traces and infrastructure metrics to troubleshoot issues faster, something not natively possible with Nagios.
- Error Tracking: Catch and prioritize frontend and backend errors as they happen. Atatus provides detailed context such as stack traces, user actions, and browser/device details to help developers resolve issues faster.
Try Atatus for free by signing up for a trial.
Zabbix
Zabbix stands out as a robust and scalable monitoring tool that covers everything from network and server health to cloud, containers, and application performance. Compared to Nagios, Zabbix offers a more modern experience with built-in templates, visual dashboards, and better alerting capabilities, all without needing to rely heavily on external plugins.
It simplifies the setup process with out-of-the-box templates for various systems. For teams that have outgrown Nagios’s manual setup and dated UI, Zabbix provides a more intuitive and complete monitoring solution, backed by strong community support and official learning resources.
key Features of Zabbix:
- Full-stack Monitoring – Supports monitoring of networks, servers, cloud platforms, containers, databases, and applications.
- Ready-to-use Templates – Includes pre-configured templates for Linux, Windows, VMware, MySQL, Nginx, etc.
- Advanced Notifications – Integrates with alerting tools like On-Call, Slack, Opsgenie, and PagerDuty.
- Modern Web UI – Offers an intuitive interface for managing hosts and visualizing data.
Datadog
Datadog is a fully managed, cloud-native monitoring and analytics platform that brings together metrics, logs, traces, and security insights in one place. It stands out as a robust alternative to Nagios due to its comprehensive monitoring capabilities. Its intuitive interface and hundreds of integrations make it ideal for modern DevOps and SRE teams.
Datadog automatically discovers infrastructure, services, and containers, and allows deep inspection via pre-configured and custom dashboards. From uptime tracking to anomaly detection, Datadog provides a comprehensive view into any system’s health.
Key Features of Datadog:
- Unified Observability – Includes infrastructure monitoring, APM, log analytics, and security in one tool.
- Real-Time Dashboards – Instant visual insights into system performance.
- Intelligent Alerting – AI-based anomaly detection and correlation.
- Full Cloud Integration – Works seamlessly with AWS, Azure, GCP, Kubernetes, and more.
- Collaboration Tools – Share dashboards and alerts across teams for faster issue resolution.
Site24x7
Site24x7 is a cloud-native monitoring platform developed by ManageEngine, offering monitoring for infrastructure, websites, cloud environments, applications, and end-user experience. Unlike Nagios, Site24x7 provides synthetic monitoring, log analysis, and APM in a single package without requiring extensive setup.
It is especially strong in digital experience monitoring and is a favorite among IT and DevOps teams seeking cloud-first tools with mobile accessibility and simplified dashboards. It serves as a good Nagios alternative, offering several key features
Key Features of Site24x7:
- All-in-One Monitoring – Monitor websites, APIs, servers, network devices, and applications.
- Real User and Synthetic Monitoring – Tracks real performance from actual users and simulated tests.
- Mobile App – Manage alerts and dashboards on the go.
- Log Management – Ingest and analyze logs directly in the platform.
- Cloud-Native Integrations – Works with AWS, Azure, GCP, Docker, and more.
Prometheus
Prometheus, a Nagios alternative is a leading open-source monitoring system built for cloud-native environments and microservices. It uses a pull-based model to collect metrics and supports a multidimensional data model.
Unlike Nagios, which requires configuration files and plugins, Prometheus provides a flexible query language and integrates naturally with Kubernetes. Its ecosystem includes Alertmanager for handling alerts and exporters for collecting data from a wide range of systems.
Key Features of Prometheus:
- Pull-Based Metrics Collection – Scrapes metrics from targets at configured intervals.
- PromQL for Queries – Powerful query language to extract and transform metrics.
- Built for Kubernetes – First-class support for container orchestration and service discovery.
- Alertmanager – Flexible alerting pipeline with routing and silencing.
- Grafana Integration – Create rich dashboards and visualizations.
Graphite
Graphite serves as a powerful alternative to Nagios when your focus is on storing and visualizing performance metrics over time. Unlike Nagios, which centers on status checks and alerting, Graphite specializes in time-series data collection and real-time visualization. It’s especially well-suited for teams that need to track trends, analyze system behavior, and build custom dashboards based on metric data from various sources.
While it doesn’t offer built-in alerting like Nagios, Graphite integrates seamlessly with other tools (e.g., Grafana or Sensu) to fill in that gap. It's ideal for users who want a more flexible, developer-friendly solution to performance monitoring and metric tracking.
Key Features of Graphite:
- Time-Series Data Storage – Designed for storing numeric time-series data from multiple sources.
- Real-Time Visualization – Enables fast and interactive charting of live metrics.
- Custom Dashboards – Supports integration with tools like Grafana for dynamic dashboards.
- Extensible Architecture – Easily integrates with collectors and alerting systems.
Sematext
Sematext is a modern monitoring and logging platform that provides infrastructure visibility, application performance monitoring, and synthetic monitoring. Unlike Nagios, Sematext requires no manual configuration or plugin management, offering a clean and unified platform for observability. It supports cloud, container, and on-premise environments with quick installation and deep insights.
Key Features of Sematext:
- Unified Monitoring – Monitor metrics, logs, and events together.
- Synthetic Monitoring – Simulate user interactions with APIs and websites.
- Auto-Discovery – Automatically detects hosts and services.
- Log Management – Parse and analyze logs with built-in alerts.
- Simple Setup – Get started with minimal effort and agent-based installation.
Sumo Logic
Sumo Logic is a cloud-native log management and analytics platform that offers advanced capabilities for analyzing infrastructure and application logs. While Nagios is limited in log management, Sumo Logic excels with real-time streaming and machine learning-based analytics. It is especially useful for dynamic and large-scale environments that generate vast amounts of data needing quick analysis.
Key Features of Sumo Logic:
- Machine Learning – Built-in anomaly detection and pattern recognition.
- Security Monitoring – Threat detection and compliance reporting.
- Cloud-Native Platform – No infrastructure setup needed.
- Powerful Search Language – Extract insights quickly and create automated dashboards.
Dotcom-Monitor
Dotcom-Monitor is a website, application, and API performance monitoring tool that emphasizes end-user experience. Unlike Nagios, which focuses more on internal system checks, Dotcom-Monitor specializes in global availability testing, synthetic monitoring, and browser-based testing. It is perfect for businesses that rely heavily on web availability and need to simulate real user behavior.
Key Features of Dotcom-Monitor:
- Global Test Locations – Monitor from 30+ locations worldwide.
- Browser-Based Tests – Use real browsers to replicate user interactions.
- Multi-Step API Testing – Validate API transactions with complex logic.
- Visual Waterfall Charts – Analyze page performance in depth.
- Downtime Alerts – Fast notification when services go offline.
OpenNMS
OpenNMS is a powerful open-source network management platform built for enterprises. It excels in fault management, performance monitoring, and scalability. Compared to Nagios, OpenNMS offers a more modular and extensible system with stronger SNMP support. It is ideal for IT teams managing large-scale network infrastructure and looking for flexible integrations.
Key Features of OpenNMS:
- Distributed Monitoring – Scale across multiple locations and environments.
- Fault Management – Real-time event and alarm processing.
- Performance Graphing – Visualize network and system metrics.
- Extensible Architecture – Customize and extend with APIs.
- Strong SNMP Support – Ideal for traditional network device monitoring.
Checkmk
Checkmk builds on the strengths of Nagios and enhances them with auto-discovery, performance dashboards, and an easier configuration experience. It supports large environments and works with cloud, virtual, and on-premise infrastructures. It is a great choice for users familiar with Nagios who want a more modern experience without abandoning their plugin library.
Key Features of Checkmk:
- Auto-Discovery – Quickly detects services and metrics.
- Integrated Dashboards – Built-in performance visualizations.
- Nagios-Compatible – Continue using existing plugins.
- Scalable Monitoring – Handles thousands of hosts efficiently.
- Hybrid Infrastructure Support – Monitors everything from bare metal to containers.
Icinga
Icinga is a reliable and widely adopted alternative to Nagios, purpose-built for modern infrastructure monitoring. Originally forked from Nagios, it has evolved into a scalable, extensible, and automation-friendly platform, addressing many of the limitations found in its predecessor.
One of Icinga’s strongest advantages is its full compatibility with Nagios plugins, allowing users to transition seamlessly without losing prior configurations or scripts.
Key Features of Icinga:
- Scalable Monitoring – Handles complex and distributed infrastructures more efficiently than Nagios.
- Automation Support – Integrates easily with modern configuration tools and APIs.
- Modern UI – Offers a clean, responsive interface for better usability.
- Nagios Plugin Compatible – Supports existing Nagios plugins and checks.
- Active Development – Backed by strong community and frequent updates.
How to Choose the Right Nagios Alternative?
Selecting the best alternative to Nagios depends on your infrastructure needs and monitoring priorities. Tools like Zabbix, Atatus, and Datadog each bring unique strengths, so it’s important to evaluate them based on the following factors:
1. Clarify Your Requirements
- Scalability: Do you need to monitor hundreds or thousands of hosts and services?
- Cloud Support: Will you be monitoring AWS, Azure, GCP, or other cloud platforms?
- Integration: How well does the tool integrate with your current systems and workflows? For example, Atatus offers seamless integrations with many popular development and alerting tools.
- Ease of Use: Are you looking for a plug-and-play solution or do you have the bandwidth to manage complex setups?
- Budget: Are you leaning toward open-source tools or ready to invest in a commercial platform?
2. Evaluate Key Features
- Auto-Discovery: Automatically detects and adds new devices or services.
- Cloud Monitoring: Built-in support for cloud-native environments and services.
- Customization: Flexibility to adapt dashboards, alerts, and checks to your needs.
- Reporting & Alerting: Rich alerting logic, notification channels, and reporting capabilities.
- User Interface: A clean, modern UI that makes navigation and monitoring easier.
Getting Started with Atatus
If you are ready to explore a modern, developer-friendly monitoring solution, Atatus is a great place to start. Designed to give deep insights into your applications, infrastructure, and user experience, Atatus combines simplicity with powerful features.
#1 Solution for Logs, Traces & Metrics
![]() APM
APM
![]() Kubernetes
Kubernetes
![]() Logs
Logs
![]() Synthetics
Synthetics
![]() RUM
RUM
![]() Serverless
Serverless
![]() Security
Security
![]() More
More


![Datadog vs Splunk: A Side-by-Side Comparison [2026]](/blog/content/images/size/w960/2024/12/Untitled-design--41-.png)