New Relic APM: Hidden Costs, Performance Gaps, and a Better Alternative
When it comes to monitoring application performance, New Relic APM often shows up as one of the top choices. It’s powerful, feature-rich, and widely used by developers, DevOps engineers, and SREs across industries.
However, as many teams have discovered, the platform’s rising costs, unpredictable billing, and hidden performance blind spots can create more challenges than solutions, impacting both productivity and budgets.
If you have ever asked yourself, “Is New Relic APM really worth it?”, you are in the right place. In this article, lets see the New Relic's hidden costs, explore the performance gaps, and introduce you to a simpler, more transparent, and cost-effective alternative.
In this blog,
- Why Developers and DevOps Teams Choose New Relic APM
- The Hidden Costs of New Relic APM You Should Know About
- New Relic Performance and Usability Gaps You Can’t Ignore
- How These Limitations Impact DevOps and SRE Teams
- A Better Alternative to New Relic APM: Atatus APM
Why Developers and DevOps Teams Choose New Relic APM
New Relic has earned its name as a complete application performance monitoring (APM) solution.
Teams often choose it because it offers:
- Full-stack observability: Metrics, traces, and logs all in one place.
- Strong visualization tools: Intuitive dashboards to analyze performance data.
- Cloud-native support: Works with AWS, Azure, and Kubernetes.
- Rich integrations: Supports popular frameworks and DevOps tools.
For organizations starting their observability journey, New Relic seems like a one-stop solution, but the deeper you go, the more you realize that visibility comes at a cost.
The Hidden Costs of New Relic APM You Should Know About
New Relic pricing looks flexible. But when your system scales, costs can skyrocket quickly. This is one of the biggest complaints among DevOps teams using it in production.
#1. Unpredictable Pricing
New Relic uses a data-ingestion-based pricing model, the more data you send, the higher your bill. As your traffic, logs, and traces grow, the monthly invoice can become hard to predict. What seems like a reasonable plan for a small environment often turns into thousands of dollars once the platform scales.
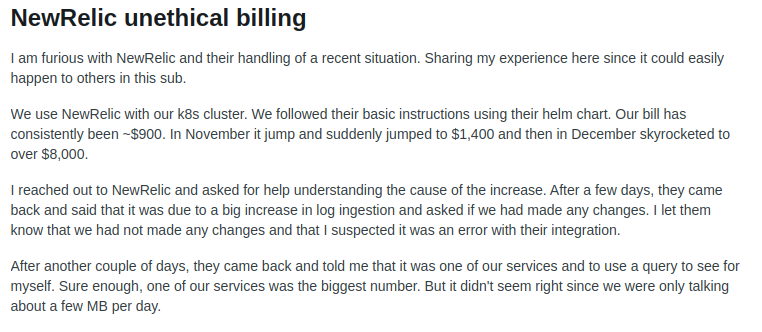
Reddit discussion on r/devops highlighted concerns from engineers who faced unexpected billing spikes from New Relic, calling out “NewRelic unethical billing practices” this reflects a growing frustration among DevOps engineers dealing with unclear cost visibility and inconsistent pricing structures.
#2. High Costs at Scale
For businesses running microservices or distributed systems, APM data grows exponentially. Each request, log, and trace adds to ingestion volume, pushing costs even higher. This often forces teams to limit data collection, which defeats the purpose of having an APM tool in the first place.
#3. Limited Access to Advanced Features
Some of New Relic’s most valuable features such as advanced analytics, detailed reports, and longer data retention are only available in higher-tier plans. To use these capabilities, you have to upgrade to costly “Pro” or “Enterprise” plans, which can quickly increase your overall expenses.
#4. Short Data Retention Periods
Unless you are on premium tiers, New Relic’s data retention is limited. For DevOps and SRE teams analyzing long-term performance trends, this becomes a major problem.
#5. Maintenance Overheads
New Relic’s dashboard setup, alert tuning, and metric management take time. Many teams spend hours maintaining the tool itself, instead of improving app performance.
New Relic Performance and Usability Gaps You Can’t Ignore
Cost is not the only issue. Many developers and site reliability engineers report that New Relic APM struggles under real-world load and complex environments.
1. Slow Dashboards and Query Delays
As data grows, dashboards can take several seconds, sometimes minutes to load. This delay during incident response slows down troubleshooting.
2. Steep Learning Curve
While New Relic offers a lot of features, its dashboard can be complicated to set up. Users often need prior application performance monitoring (APM) experience to make sense of the data, and configuring it for actionable insights can feel overwhelming at first.
Customer Feedback: Learning curve felt like bit steep for new comers, pricing structure was complicated and a little more on expensive side - Hardik P, G2
3. Complex UI
New Relic’s interface can feel overwhelming for new users. Navigating dashboards and finding actionable insights often requires prior application performance monitoring (APM) experience.
Customer Feedback: Complex UI and High Price is the things that i don t like - Sreenath K, G2
4. Alert Noise
Teams often complain about too many alerts and not enough actionable insights. Fine-tuning thresholds takes time and trial.
Customer Feedback: In my opinion alert can be more better - Source: G2
5. Data Retention Gaps
Short retention windows mean you lose historical insights, which limits your ability to optimise long-term performance.
6. Limited Customisation
While New Relic offers great visualization, customising dashboards or metrics for complex microservices architectures isn’t always easy.
How These Limitations Impact DevOps and SRE Teams
The real problem with these issues is not just cost or slow dashboards, it’s the operational drag they cause.
- Increased MTTR (Mean Time to Resolution): When dashboards load slowly or data is delayed, teams spend more time troubleshooting incidents. This leads to longer downtime for applications and frustrated users.
- Incomplete Root Cause Analysis: Missing traces or limited visibility across distributed systems make it difficult to pinpoint latency or failure sources. Teams may have to rely on guesswork or pull multiple tools together, delaying remediation.
- Budget Strain: New Relic’s usage-based pricing can lead to sudden, unpredictable spikes as traffic grows. This unpredictability complicates planning and forces teams to make trade-offs, such as reducing monitoring coverage to control costs.
- Fragmented Observability: Some metrics, logs, or traces may live outside New Relic, breaking the “single pane of glass” promise. Teams end up switching between multiple tools to get a complete picture, slowing down incident response and decision-making.
- Team Productivity Loss: Constant alert noise, complex dashboards, and the learning curve for newcomers reduce productivity. Engineers spend more time managing the monitoring tool than improving application performance.
A Better Alternative to New Relic APM: Atatus APM
If you are looking for a simpler, faster, and more cost-effective APM tool, Atatus APM is a strong alternative. It gives you end-to-end visibility without the heavy setup or unpredictable bills.
Key Advantages of using Atatus APM:
1. Transparent Pricing
- Atatus offers a clear, predictable pricing model with no hidden tiers or usage surprises. Check pricing now and see how simple full-stack monitoring can be.
- Teams can budget accurately without worrying about unexpected spikes. This makes scaling monitoring simple and stress-free.
2. Rapid Setup & Developer-Friendly Interface
- Install the Atatus agent and start collecting performance metrics immediately. Get started with Atatus and gain real-time visibility into your apps.
- Dashboards are intuitive, letting developers and SREs focus on key insights.
- No complex menus or steep learning curve slows down your workflow.
Discover how top companies improved uptime and reliability using Atatus — read the full story here
3. Full Historical Data
- Track performance trends and errors over extended periods.
- Long-term visibility helps identify recurring issues and optimise applications. This enables more effective root cause analysis and planning.
4. Actionable Dashboards
- Drill down from slow endpoints to specific lines of code or database queries.
- Atatus Dashboards combine clarity with depth, giving insight at a glance.
- No need to switch between multiple tools to understand app performance.
5. 24/7 Support
- Get direct access to Atatus engineers who deeply understand the product.
- Receive fast, practical solutions instead of slow, tiered or scripted support.
- Ensure smooth operations, high uptime, and reliable performance for DevOps teams.
Have questions or need help? Contact Atatus anytime for support.
How to Get Started with Atatus APM
Getting started with Atatus is simple:
- Sign up for an Atatus account and create a new application project.
- Install the Atatus agent to start monitoring your application, see our Agent Installation Overview for detailed steps across different operating systems.
- Integrate with your framework such as Laravel, Symfony, or Slim using built-in support.
- Start sending performance data, errors, and traces to your Atatus dashboard.
- Set up custom alerts based on your app’s performance goals.
- Use the dashboard to monitor real-time performance, analyse issues, and improve your app continuously.
Atatus offers detailed documentation and a 14-day free trial so you can explore all features.
FAQs
What are the common issues users face with New Relic APM?
Many users report slow dashboards, complex UI, high pricing tiers, and steep learning curves. These issues often make it harder for DevOps teams and SREs to get real-time insights and act quickly.
Why is New Relic APM considered expensive for growing teams?
New Relic’s pricing is based on data ingestion and user count, which can quickly increase costs as applications scale. This makes it less budget-friendly for startups and mid-sized DevOps teams.
What are the performance limitations of New Relic APM?
Slow dashboard loading, query delays, and limited historical data can impact mean time to resolution (MTTR) and root cause analysis during incidents.
What is the best alternative to New Relic APM?
Atatus application performance monitoring (APM) is a strong New Relic alternative that offers transparent pricing, simple setup, full historical data, and real-time visibility, making it ideal for developers, DevOps engineers, and SREs.
How does Atatus APM compare to New Relic in pricing and value?
Atatus provides a clear, predictable pricing model with no hidden costs or data usage surprises, unlike New Relic’s complex tiers. You pay only for what you use.
Is Atatus easier to use than New Relic?
Yes. Atatus offers a clean, intuitive dashboard with fast setup and easy navigation. It gives immediate performance insights without requiring deep application performance monitoring (APM) expertise.
How easy is it to switch from New Relic to Atatus?
Yes, switching from New Relic APM to Atatus APM is relatively straightforward. Atatus offers a quick agent installation process and supports multiple languages and platforms. Atatus documentation highlights a dedicated transition path from New Relic, including migration guidance and support.
#1 Solution for Logs, Traces & Metrics
![]() APM
APM
![]() Kubernetes
Kubernetes
![]() Logs
Logs
![]() Synthetics
Synthetics
![]() RUM
RUM
![]() Serverless
Serverless
![]() Security
Security
![]() More
More


