Exploring Kubernetes Nodes: Essential Components of Container Orchestration
Kubernetes serves as a robust tool for managing and orchestrating applications across multiple computers. These computers are referred to as 'nodes.' Picture nodes as fundamental units in the ecosystem of your applications. Every node possesses its own computing resources, encompassing memory, processing capabilities, and storage capacity.
Your apps are hosted and run by nodes. They give your apps the room and resources they need to work. These nodes are monitored by Kubernetes, which makes sure they are functional and prepared to carry out duties.
We are about to delve into the fundamental essentials you should grasp regarding Kubernetes nodes. This blog will serve as your introduction to the core concepts of nodes, helping you familiarize yourself with the terminologies involved. Get set to explore this captivating aspect of Kubernetes.
Time to begin!
Table of contents
- What are Kubernetes Nodes?
- Node Components
- Node vs Pod
- Kubernetes Node Management
- Node Health Checks and Conditions
What are Kubernetes Nodes?
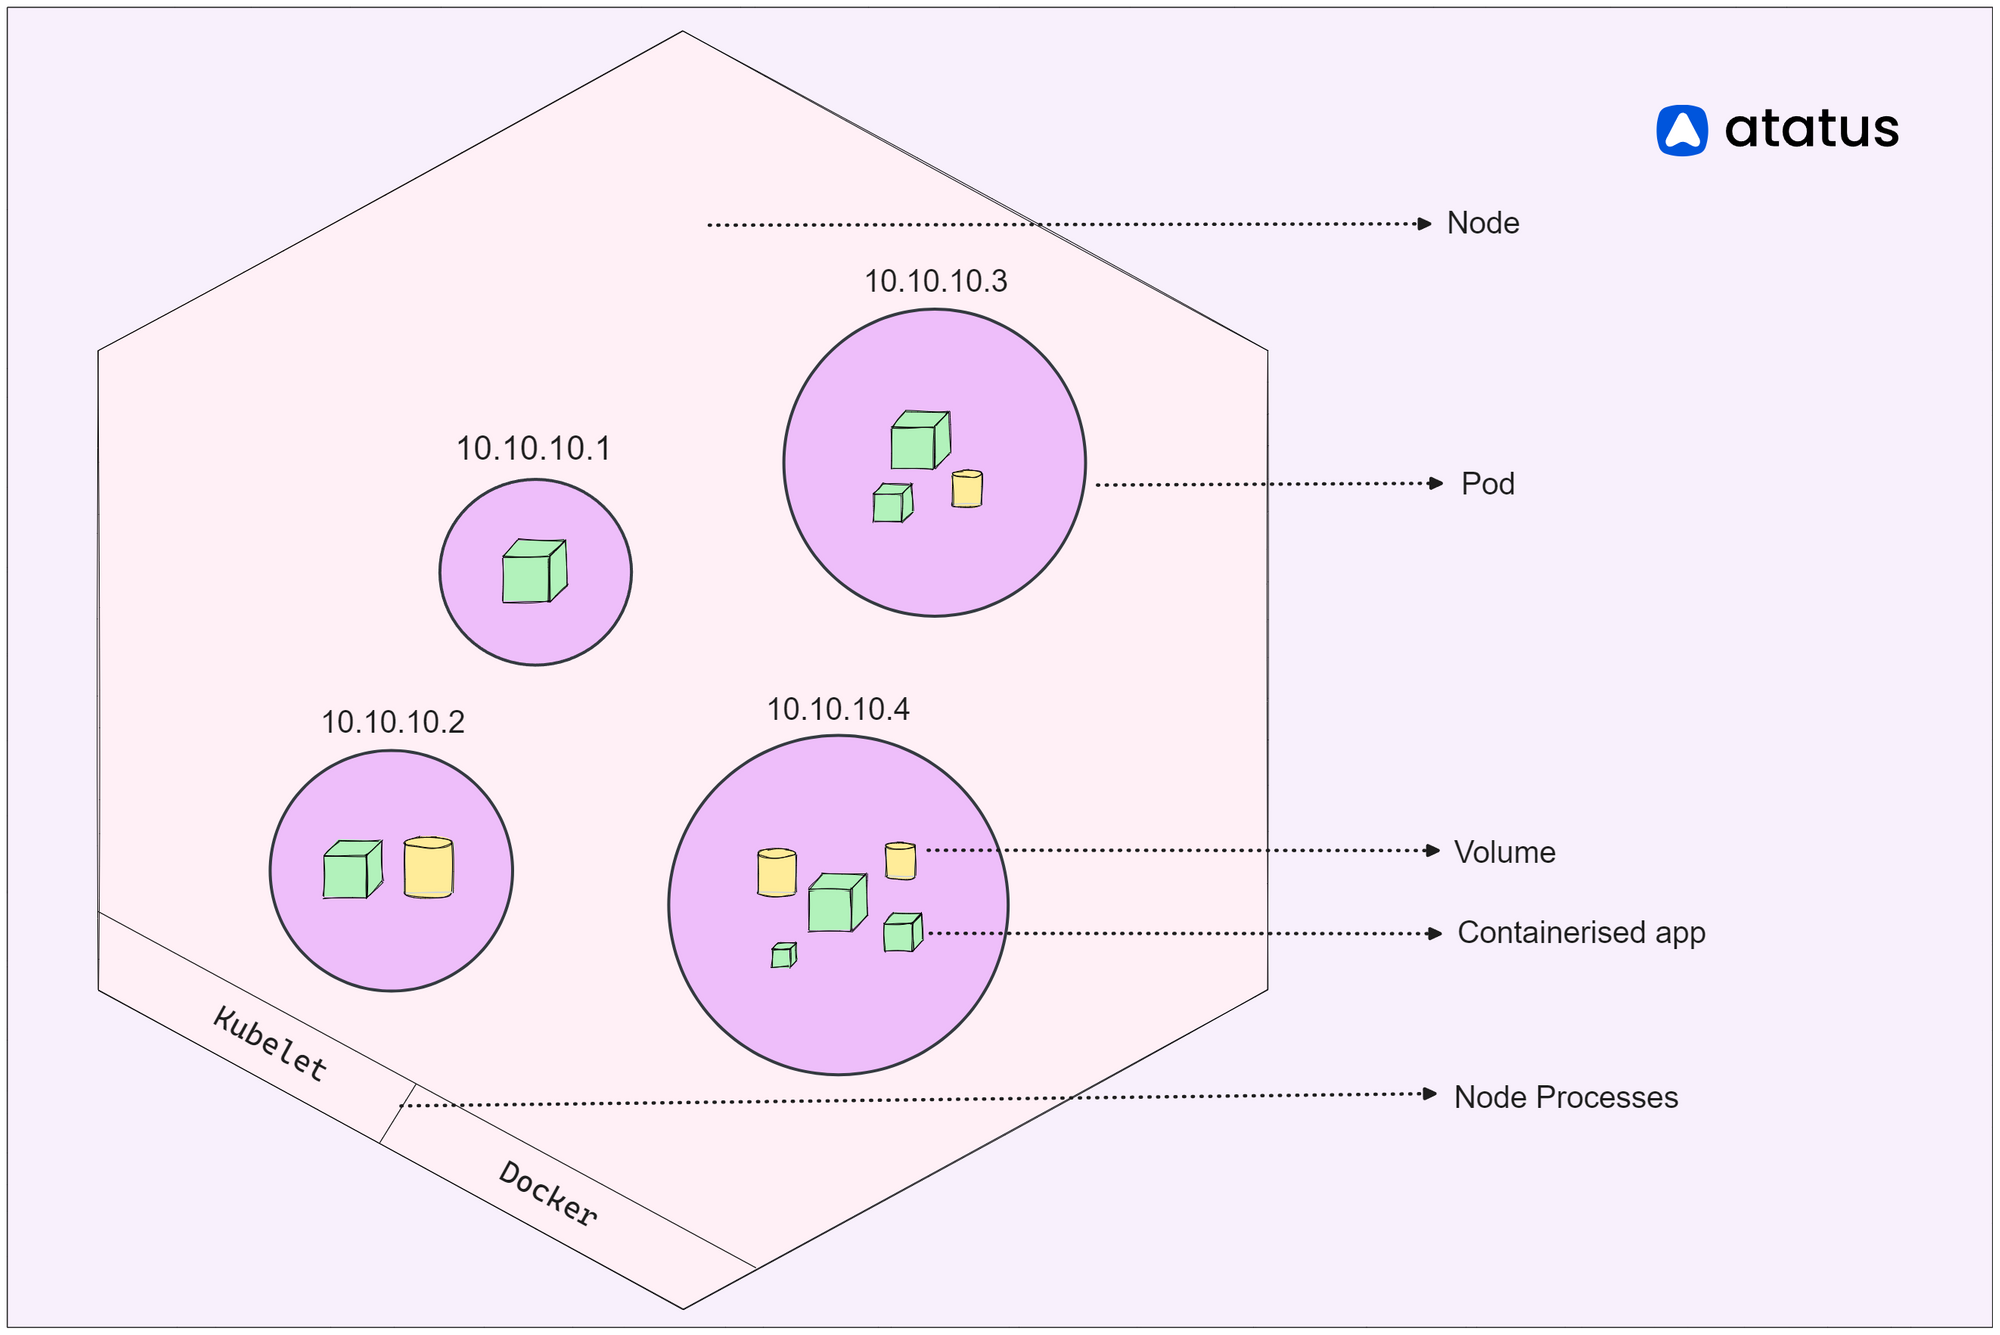
Kubernetes Nodes are the individual computing instances within a Kubernetes cluster that serve as the operational units for running containerized applications. Each node hosts and manages containers, providing the necessary computing resources, networking, and storage to support the execution of application workloads.
Nodes are orchestrated and coordinated by the Kubernetes control plane, which allocates tasks, monitors node health, and ensures the proper functioning and distribution of workloads across the cluster.
In Kubernetes, there are primarily two types of nodes:
- Worker nodes and
- Control plane nodes
Worker Nodes : Worker nodes, are the operational units of a Kubernetes cluster responsible for executing containerized applications. They provide the necessary resources and environment for running containers and handling application workloads.
Control Plane Nodes: Control plane nodes, often referred to as master nodes, are the administrative components of a Kubernetes cluster that manage and coordinate the overall cluster behaviour. They orchestrate tasks such as scheduling applications, maintaining their desired state, and handling scaling and availability.
Node Components
A Kubernetes node is a worker machine that runs applications in containers. It consists of key components,
- Kubelet
- Kube Proxy
- Container Runtime
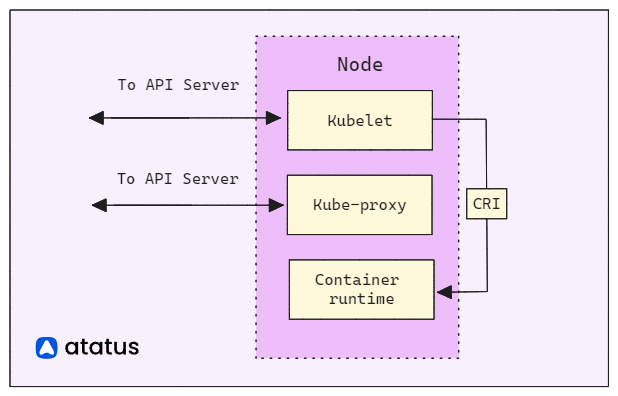
The Kubelet interfaces with the control plane and oversees container management. Kube Proxy guarantees network connectivity, while the Container Runtime handles container execution.
Kubelet: The Kubelet acts as the node-level supervisor, interacting with the control plane. It ensures that containers within Pods are running and healthy. It fetches Pod specifications from the control plane and manages their lifecycle by starting, stopping, and restarting containers. It also monitors resource usage, reports node status, and handles image pulling and caching.
Kube Proxy: Kube Proxy maintains network rules on the node, enabling seamless communication between Pods and services. It performs packet forwarding, load balancing, and service discovery, ensuring that each Pod can be reached via its unique IP address and port. Kube Proxy supports different proxy modes, such as userspace, iptables, or IPVS, to suit varying networking requirements.
Container Runtime: The Container Runtime, like Docker or containerized, manages container execution. It handles image management, container creation, resource isolation, and lifecycle operations. The runtime ensures efficient resource utilization by allocating CPU and memory resources, isolating containers from each other and the host system, and providing mechanisms for networking and storage integration.
Node vs Pod
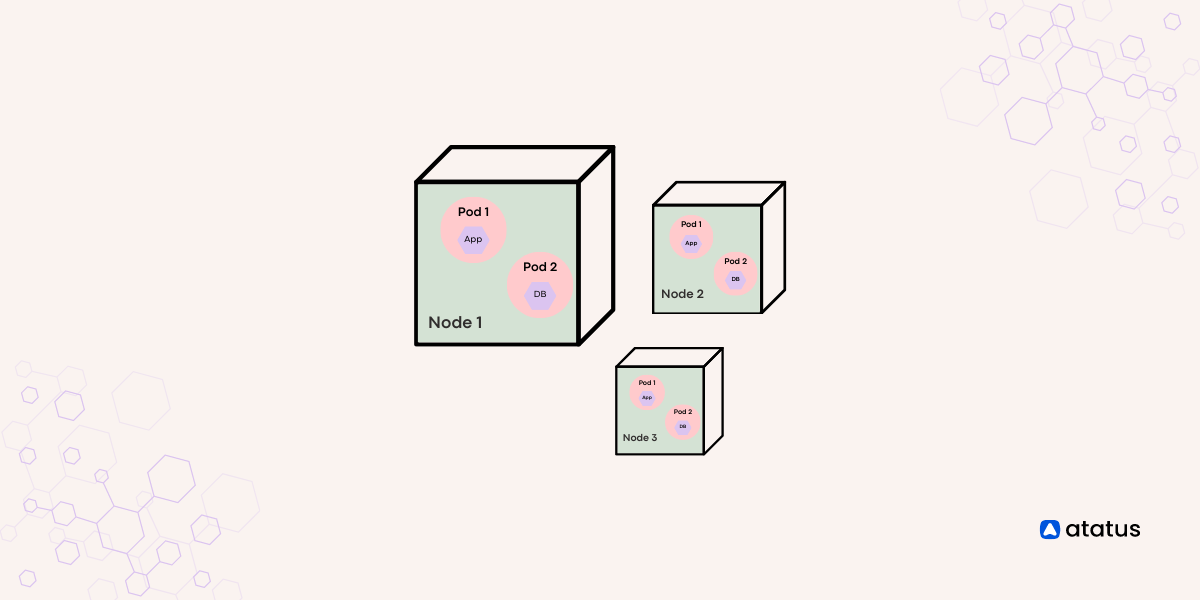
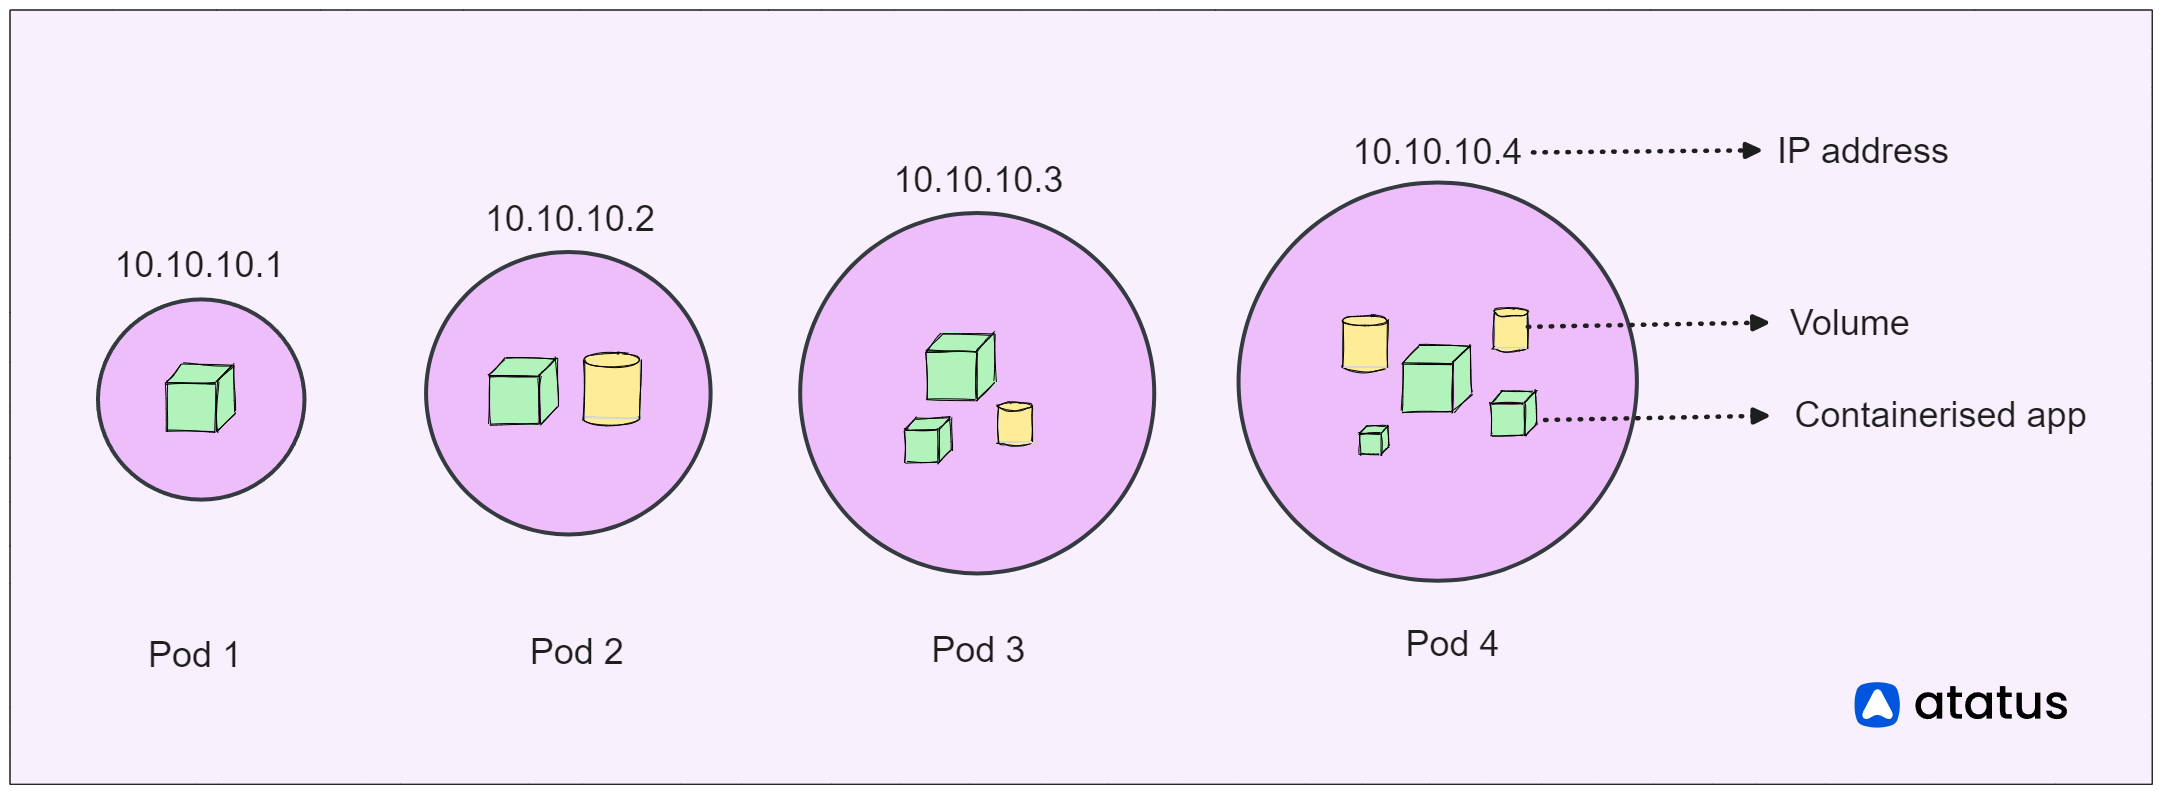
Nodes serve as the foundational elements of a Kubernetes cluster, similar to the computers or servers that furnish the essential computational resources for running applications. Just as a team of workers collaborates in a factory, nodes collaborate to guarantee the operational status of your applications.
These nodes provide the necessary CPU, memory, storage, and networking capabilities to support your containers. They undertake the task of overseeing the lifecycle of containers, making sure they initiate, halt, and expand as dictated by requirements. Communication with the cluster's control plane is the responsibility of nodes, receiving directives concerning container execution, placement, and administration.
On the other hand, pods resemble closely-coordinated groups within the Kubernetes framework. Each pod can encompass one or multiple containers that operate in close coordination and share the same network environment, IP address, and storage provisions. Imagine a group of colleagues cooperating on a project – they are situated together and can seamlessly engage with one another. Similarly, containers within a pod can effortlessly communicate via the "localhost" network, simplifying the exchange of information.
Kubernetes Node Management
Kubernetes node management refers to the set of practices, tools, and techniques used to oversee and control the individual worker units within a Kubernetes cluster, known as nodes.
1. Node Scaling and Autoscaling
Efficiently managing node scalability is vital to adapt to fluctuating workloads. Consider an e-commerce website that encounters high user traffic on holidays, yet experiences lower activity on regular days.
In such scenarios, Kubernetes' capability to scale nodes becomes invaluable. It allows for automatic addition of nodes during peak traffic and their removal when demand subsides.
Illustration: Picture a bustling Black Friday sale where an e-commerce platform faces a surge in visitors. With Kubernetes, this spike in demand is promptly recognized.
Additional nodes are seamlessly deployed to handle the heightened load. Subsequently, as the sale concludes and traffic normalizes, Kubernetes intelligently reduces the node count to conserve resources.
2. Node Labels
Just like putting tags on boxes to know what is inside, Kubernetes uses labels as tags for nodes. If you have different kinds of computers, you can tag them to show their strengths. For example, you could tag some as "web servers" and others as "database servers." This helps Kubernetes pick the best spot for your apps. Labels are like labels on boxes that guide Kubernetes to choose the right spot for each job.
Consider you're managing a Kubernetes cluster spread across various places, with nodes stationed both in the "East" and "West" regions. To make things organized, you can stick labels on these computers saying where they are. For example:
apiVersion: v1
kind: Node
metadata:
  labels:
    region: east
With these labels, you can make sure that applications needing low latency are scheduled on nodes that are physically closer to the users in the respective regions.
apiVersion: apps/v1
kind: Deployment
spec:
  template:
    spec:
      affinity:
        nodeAffinity:
          requiredDuringSchedulingIgnoredDuringExecution:
            nodeSelectorTerms:
              - matchExpressions:
                  - key: region
                    operator: In
                    values:
                      - east
3. Node Annotations
Annotations work in a way similar to labels, but they're like extra sticky notes you can put on things. In the world of Kubernetes, nodes can have labels that tell what they're good at, like being fast or slow.
Annotations, on the other hand, are like little notes you can attach to nodes. These notes are there to give extra information or details.
For example, you might put an annotation on a node to remember when it was last upgraded, or to mention who is responsible for it. These notes are for keeping track and adding explanations about the nodes.
They help people understand the nodes better and make decisions based on more information.
So, while labels are like tags that categorize nodes, annotations are like small comments that give extra insights. They make the Kubernetes world more organized and well-informed.
apiVersion: v1
kind: Node
metadata:
  name: my-node
  annotations:
    owner: ravi@example.com
    maintenance-date: 2023-08-15
In this instance, we're putting two special notes on a computer named "my-node." The first note, named "owner," says that a person named Ravi (who has the email address ravi@example.com) is looking after this computer.
The second note, called "maintenance-date," tells us that this computer will be checked and fixed on August 15, 2023. Just like how you might put sticky notes on things to remember important stuff, Kubernetes uses these notes to remember details about the computers.
4. Node Draining
Node draining is the process in which all the pods from a node are relocated before performing maintenance tasks or decommissioning the node.
When you drain a node, Kubernetes reschedules the Pods from that node to other available nodes in the cluster.
This makes sure your apps keep running smoothly and do not experience downtime during node maintenance. The kubectl drain command is typically used to initiate node draining.
kubectl drain <node-name> --ignore-daemonsets
5. Node Cordoning
Node cording is a process which includes the act of marking a node as unschedulable. When you cordon a node in Kubernetes, it prevents new Pods from being scheduled onto that node. It is like setting a sign on a computer that says "no more entry."
It's a technique for temporarily isolating a node to ensure its stability, especially during planned maintenance or when you are troubleshooting issues on that specific node. While the node is cordoned, the existing Pods on it continue to run without any impact. This prevents new work from being assigned to the node, allowing ongoing tasks to proceed smoothly.
This is frequently done when you are preparing to perform maintenance on a node or when you want to make sure that the tasks already on the node keep running without any interruptions.
kubectl cordon <node-name>
6. Node Troubleshooting and Recovery
Node troubleshooting and recovery encompass the process of identifying, diagnosing, and resolving issues that may impact a Kubernetes node. Such issues range from resource shortages to misconfigurations or network glitches. Effective troubleshooting guarantees the dependability of both the nodes and the applications they host.
For instance, imagine a Kubernetes cluster hosting multiple applications. If a node becomes intermittently unresponsive, affecting the connected Pods and application availability, the following steps are taken:
- Identify: Employ Kubernetes monitoring tools and resource metrics to pinpoint the issue's origin, checking for sustained high CPU or memory usage.
- Diagnose: Examine logs of affected Pods and the node. Look for error messages or resource exhaustion signs. It may unveil network configuration troubles as the reason for connectivity glitches.
- Rectify: Based on the root cause, apply corrective measures. If network configuration is the culprit, troubleshoot network components, modify firewall rules, or adjust networking settings.
- Recovery: After resolving the problem, initiate recovery. For unresponsive nodes, consider temporarily draining and cordoning them to halt new workloads. Post-recovery, uncordon the node to resume normal scheduling.
Node Health Checks and Conditions
Keeping track of how well the nodes in a Kubernetes group are doing is really important to make sure your apps work reliably and don't have any problems. Kubernetes has a built-in functionality called "Node Conditions" facilitate the tracking of node health.
Node Conditions are predefined status indicators that reflect the health and readiness of a node in a Kubernetes cluster. Here are some commonly used node conditions,
- DiskPressure: Indicates whether the node is running low on available disk space.
- MemoryPressure: Reflects whether the node is experiencing memory pressure.
- PIDPressure: Checks if the node is running out of process IDs (PIDs). If True, it implies there's a shortage of resources to launch new processes, which can impact the node's ability to accommodate new workloads.
- NetworkUnavailable: Indicates if the node is facing network connectivity issues.
- OutOfDisk: Reflects whether the node's available disk space has been fully utilized.
- Unschedulable: This condition indicates whether a node is currently marked as "unschedulable," meaning it won't accept any new pods.
- NetworkNotReady: Indicates whether the node's network interfaces are not yet ready to handle network traffic.
- ConfigOK: Indicates whether the node's configuration is in an acceptable state.
In Kubernetes, the "Conditions" part of a node's status report gives you a quick view of how the node is doing. It tells you if the node is healthy and working well. Please look at this example so that you can better understand it
Conditions:
  Type                   Status  LastHeartbeatTime           LastTransitionTime          Reason                       Message
  ----                   ------  -----------------           ------------------          ------                       -------
  MemoryPressure         False   2023-08-14T10:30:00Z       2023-08-14T09:00:00Z       KubeletHasSufficientMemory   Node has sufficient memory available
  DiskPressure           False   2023-08-14T10:30:00Z       2023-08-14T09:00:00Z       KubeletHasSufficientDisk     Node has sufficient disk space available
  PIDPressure            True    2023-08-14T10:30:00Z       2023-08-14T09:00:00Z       KubeletOutOfPID              Node is running out of process IDs
  NetworkUnavailable     False   2023-08-14T10:30:00Z       2023-08-14T09:00:00Z       KubeletHasNetwork            Node network is functioning properly
  OutOfDisk              False   2023-08-14T10:30:00Z       2023-08-14T09:00:00Z       KubeletHasSufficientDisk     Node has sufficient disk space available
  Unschedulable          False   2023-08-14T10:30:00Z       2023-08-14T09:00:00Z       NodeSchedulable              Node is ready to schedule new pods
Each condition is like a signal showing if something important is okay or not, and it comes with a simple explanation. It looks like a checklist that helps you see if everything is fine with the node.
Conclusion
Through Kubernetes nodes, We have explored a collection of vital concepts that fit together like interconnected tools in a toolbox. These ideas include things like labels that help organize nodes, annotations that provide extra details, and actions like draining and cordoning for smooth operation.
Node labels act like tags that help sort and group nodes, making sure everything is in its right place. Annotations, on the other hand, add extra notes to nodes, making it easier to understand their roles.
When it's time for maintenance or changes, the concepts of draining and cordoning come into play. When discussing nodes, a vital aspect is their health. This involves checking if nodes have enough resources, are working fine, and are ready to handle tasks.
Bringing all these concepts together, Kubernetes nodes become like the center of making applications work well. They combine tags, notes, actions, and health checks to keep things organized, reliable, and ready for action. As we conclude, remember that nodes are not just parts; they are the important part that keeps the whole Kubernetes system connected.
Monitor Kubernetes Nodes and Pods with Atatus
Ensure your nodes and pods are operating at their best by leveraging our advanced monitoring features. Stay ahead of issues, optimize performance, and deliver a seamless experience to your users. Don't compromise on the health of your Kubernetes environment.
- Effortless Node Insights: Gain real-time visibility into CPU, memory, network, and disk usage on nodes, preventing bottlenecks and failures.
- Precise Pod Monitoring: Monitor container resource usage, latency, and errors in pods, ensuring seamless application health.
- Seamless Integration: Atatus smoothly integrates with your Kubernetes setup, simplifying node and pod monitoring setup.
- Smart Alerts: Receive timely anomaly alerts, empowering you to swiftly respond and maintain a stable infrastructure.
- Enhanced Application Performance: Ensure consistently reliable application delivery, improving user experience and satisfaction.
Start monitoring your Kubernetes Nodes and Pods with Atatus. Try your 14-day free trial of Atatus.
#1 Solution for Logs, Traces & Metrics
![]() APM
APM
![]() Kubernetes
Kubernetes
![]() Logs
Logs
![]() Synthetics
Synthetics
![]() RUM
RUM
![]() Serverless
Serverless
![]() Security
Security
![]() More
More