Choosing the Right Opentelemetry Backend: Key Considerations

With applications becoming increasingly distributed and complex, gaining insights into their behavior and performance is essential for maintaining reliability and delivering exceptional user experiences. OpenTelemetry has emerged as a powerful framework for instrumenting applications to collect, process, and export telemetry data.
However, while OpenTelemetry provides the means to capture a wealth of telemetry data, the real challenge lies in choosing the right backend to process and store this information effectively. Selecting an OpenTelemetry backend is akin to choosing the foundation upon which your observability strategy will be built—a decision that can significantly impact your ability to derive actionable insights and optimize system performance.
When choosing an OpenTelemetry backend, several factors must be considered to ensure it effectively meets your requirements. In this article, we'll explore those key considerations.
Let's first understand the OpenTelemetry tool and what it does. Then, we will move on to the need for an OpenTelemetry backend and all the questions you must ask yourself before choosing an external Observability solution.
Table Of Contents:
- What is Opentelemetry, and What does it do?
- Why do we need an Opentelemetry Backend?
- Three Questions before Choosing an Observability Solution
- Key Considerations for Choosing the right Opentelemetry Backend
What is Opentelemetry, and What does it do?
OpenTelemetry is an open-source observability framework designed to standardize the collection, processing, and export of telemetry data from modern software applications and services.
It enables developers to instrument their code to capture various types of telemetry data, including metrics, traces, and logs, providing insights into the performance, behavior, and health of distributed systems.
Here's what OpenTelemetry does:
- Instrumentation: OpenTelemetry provides libraries and SDKs for various programming languages and frameworks, allowing developers to instrument their applications with minimal effort. By adding instrumentation code to their applications, developers can capture telemetry data at various points in their codebase.
- Collection: Once instrumented, applications generate telemetry data, such as metrics (e.g., CPU usage, request latency), traces (e.g., distributed request flows), and logs (e.g., application events, errors). OpenTelemetry collects this data in a standardized format, regardless of the underlying technologies or infrastructure.
- Processing: OpenTelemetry offers flexibility in how telemetry data is processed and aggregated. It supports customizable pipelines for filtering, sampling, and transforming data before it is exported to backend systems for storage and analysis.
- Export: Telemetry data collected by OpenTelemetry can be exported to various backend systems for further analysis and visualization. Popular backend systems supported by OpenTelemetry include distributed tracing systems like Jaeger and Zipkin, metric systems like Prometheus, and logging platforms like Elasticsearch and Fluentd.
By leveraging the telemetry data collected and processed by OpenTelemetry, developers, and operators gain deep insights into the behavior and performance of their applications and services. This observability enables them to identify bottlenecks, diagnose issues, optimize performance, and ensure the reliability of their systems.
Why do we need an Opentelemetry Backend?
Imagine your software applications as intricate networks of interconnected components, constantly exchanging data and performing tasks. Now, picture trying to understand how these components interact, where bottlenecks occur, and how to optimize performance without proper visibility into their behavior. This is where an OpenTelemetry backend becomes indispensable.
An OpenTelemetry backend acts as a centralized hub for processing and storing the wealth of telemetry data generated by your applications. Think of it as a command center where data from metrics, traces, and logs converge, providing a comprehensive view of your system's performance and health.
Without an OpenTelemetry backend, you'd be left sifting through a deluge of raw data scattered across various sources, making it nearly impossible to derive meaningful insights. It's akin to trying to solve a puzzle with missing pieces and no picture to guide you.
By funneling telemetry data into a centralized backend, OpenTelemetry allows you to:
- Analyze performance trends and identify anomalies - Track metrics over time to spot patterns, anomalies, and potential performance bottlenecks.
- Trace requests across distributed systems - Follow a request's journey as it traverses different components of your application, pinpointing where delays or errors occur.
- Aggregate and correlate logs - Consolidate logs from various sources to troubleshoot issues more efficiently, correlating events to understand their impact on system behavior.
In essence, an OpenTelemetry backend serves as a vital tool for gaining actionable insights into your applications' behavior, enabling you to optimize performance, enhance reliability, and deliver a superior user experience. It transforms raw telemetry data into valuable insights, empowering you to make informed decisions and drive continuous improvement in your software systems.
Three Questions before Choosing an Observability solution!
1. How exactly does the observability solution support telemetry data?
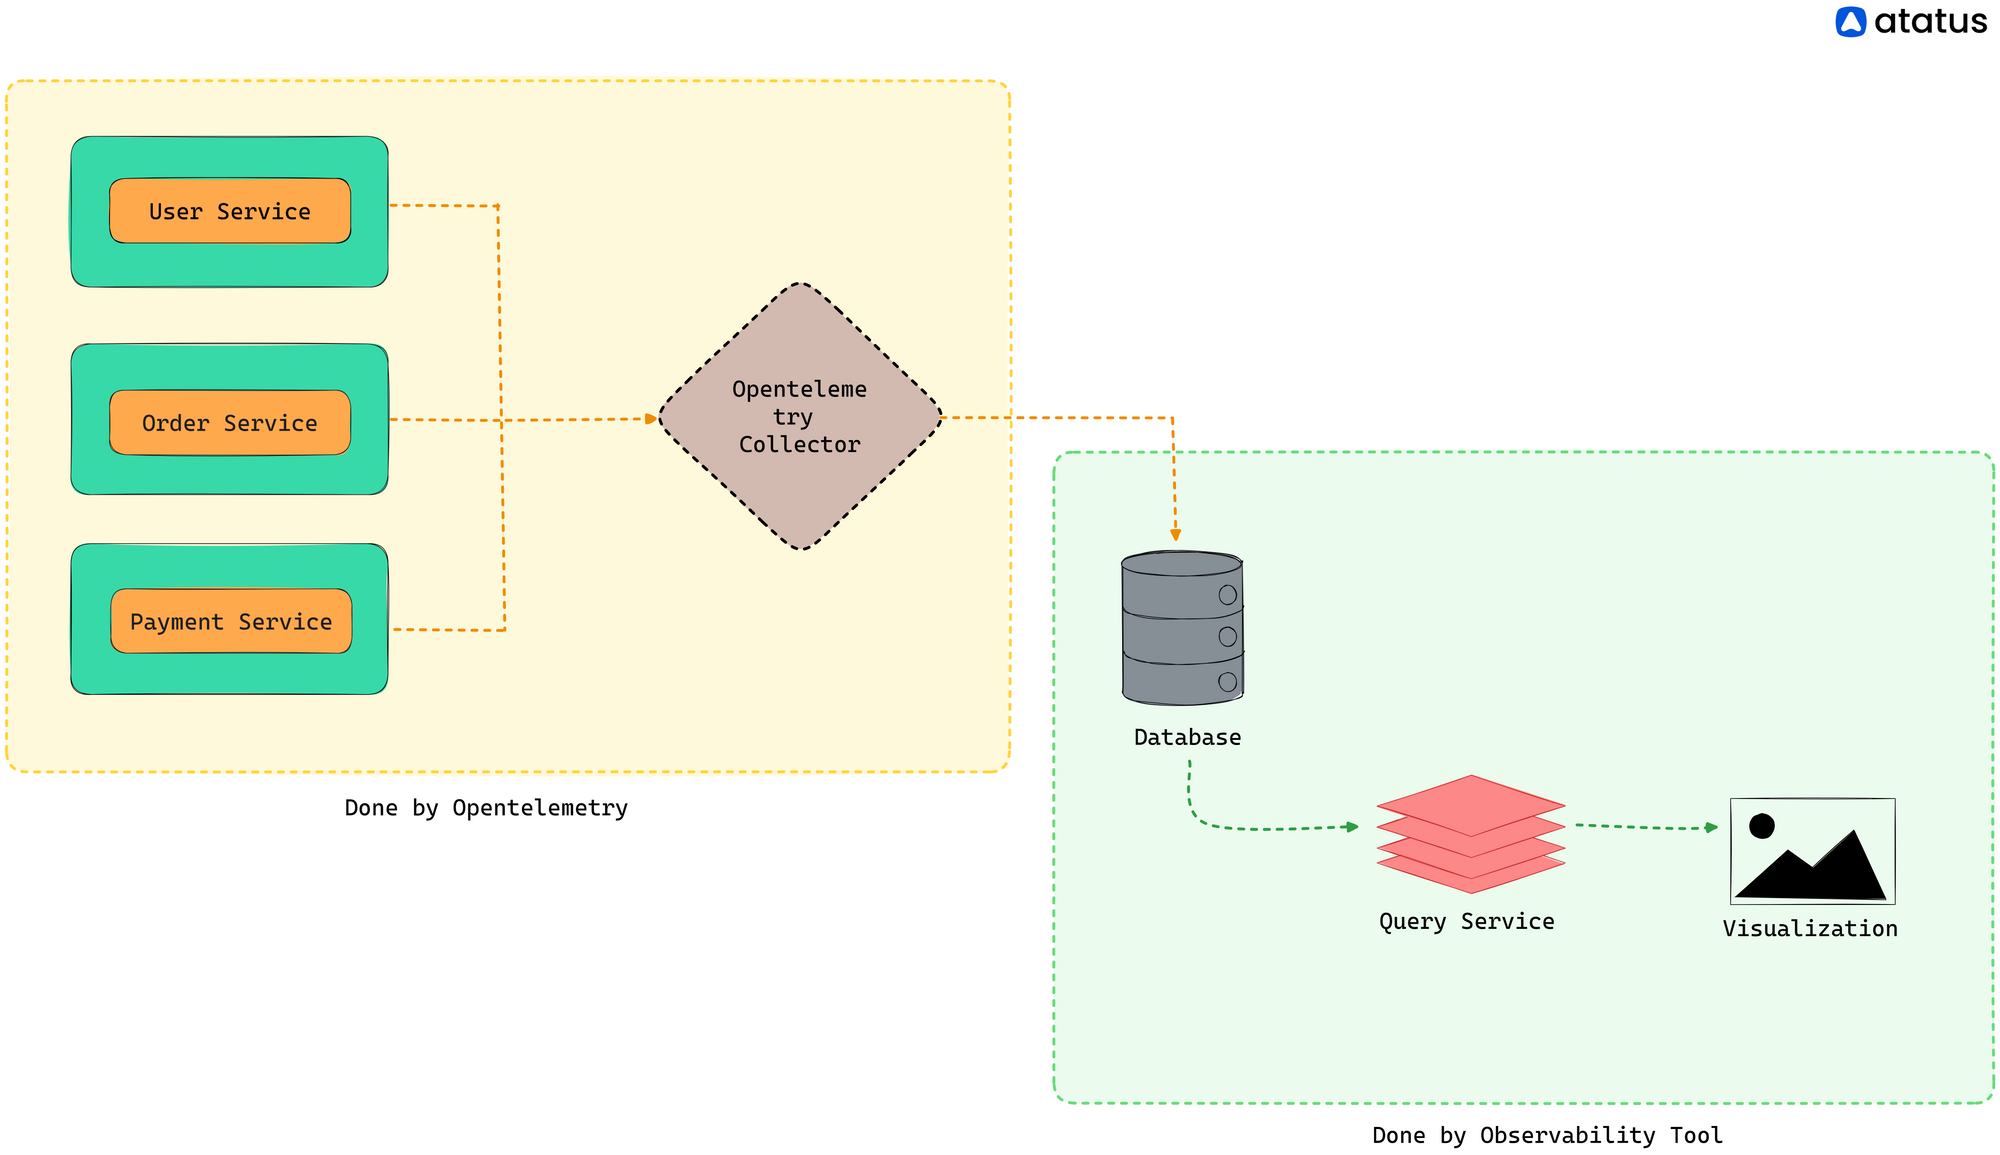
OpenTelemetry efficiently collects data and metrics from different components but does not store and visualize that data. So, we definitely need an external analysis platform that can interpret all this data and create expressive visual charts.
You need to derive value from data; if not, it is merely numbers!
Even those solutions that claim OpenTelemetry compatibility sometimes fall back on proper data storage. They might store these telemetry metrics away from the proprietary agent, somewhere else in the backend. The problem with this is that you might not be able to use all the features of the agent when it is not integrated with the data.
2. What are the features available to manage metrics?
Opentelemetry by itself is designed only to collect metrics; it does not dive into the other aspects of observability.
Observability is the process of understanding the internal state of your system or a set of systems only by looking at their external outputs. It is more like the ability of a system to measure a system's current state by the data it generates.
Since Opentelemetry is limited in its capabilities to analyze and interpret data, it becomes the job of the external observability tool to take this up. And because you have a choice here, it is better to choose a tool that offers all the features you specifically require.
It has been the case many times that some premium observability tools boast a variety of monitoring tools, but then all this complexity adds up, and finally, you just have a hard time understanding the tool properly (high learning curve).
But for any observability tool, some of the standard likely features include:
- The tool should be able to collect various metrics - CPU usage, memory utilization, request latency, error rates, etc.
- It should provide intuitive visualization capabilities, such as customizable dashboards and charts, to help users analyze and interpret the data effectively.
- Provide insights into the latency and dependencies of each component involved in processing a request, helping users identify performance bottlenecks and optimize system performance.
- The observability tool should be able to aggregate logs from various sources, correlate related log entries, and provide powerful search and filtering capabilities to facilitate troubleshooting and debugging.
- Scalability features
- Easy to integrate with existing infrastructure and applications, supporting various data ingestion methods such as agents, SDKs, and APIs.
- Security features - inquiry, authentication, and access control.
- Documentation facility and vendor or community support
3. Do they offer optimized control of data security and costs?
OpenTelemetry allows users to decide what metrics to collect and analyze. When you allow auto instrumentation, all the data gets collected regardless of whether you want it or not. However, with the newer version, OpenTelemetry should offer features for users to manipulate whatever data is to be collected and where it has to be stored. They can also fix the sample rate now.
Opentelemtery by itself does not provide a lot of built-in tools to segregate and correlate all this data. Then who does?
Well, your third-party integration should do it. Choosing solely visualization tools like Grafana is a good choice, as is choosing a complete observability platform like Atatus or New Relic.
The upside of choosing tools like Atatus is that it also collects data, tracks errors, offers health checks, and puts everything into comprehensive dashboards. Not only that, whenever your application or system encounters a pre-set threshold breach, they warn and alert you via chosen notification channels.
Key factors for Choosing the right Opentelemetry Backend
Choosing the right OpenTelemetry backend involves considering several key factors to ensure it meets your requirements for monitoring, observability, scalability, and compatibility with your existing infrastructure.
Here are some important factors to consider:
i.) Compatibility and Support
Start by ensuring that the backend you choose supports the OpenTelemetry protocol. Popular choices like Jaeger, Zipkin, and Prometheus have native support for OpenTelemetry. Additionally, consider factors such as community support, documentation quality, and the availability of integrations or plugins.
ii.) Scalability
Scalability is paramount, especially for high-traffic applications. Choose a backend capable of handling your expected telemetry data volume and scaling horizontally to accommodate future growth. Look for features like distributed tracing and efficient data aggregation to ensure optimal resource utilization.
iii.) Performance Overhead
Assess the performance overhead introduced by the backend. Look for benchmarks and performance metrics to understand how they impact your application's latency and throughput. Minimizing overhead is crucial for maintaining the responsiveness of your system, particularly in latency-sensitive environments.
iv.) Data Retention and Storage
Consider your data retention and storage requirements. Select a backend offering sufficient storage capacity and flexible retention policies to store telemetry data for the desired duration. Features like data compression and lifecycle management can help optimize storage costs and performance.
v.) Querying and Visualization
Evaluate the backend's querying and visualization capabilities. Choose a solution that provides intuitive querying interfaces, interactive dashboards, and integration with popular monitoring tools like Grafana or Kibana. Effective querying and visualization are essential for deriving actionable insights from your telemetry data.
vi.) Security and Compliance
Ensure that the backend aligns with your organization's security and compliance standards. Look for features like encryption, authentication, and access control to protect telemetry data from unauthorized access or tampering. Depending on your industry, compliance with regulations such as GDPR or HIPAA may also be necessary.
vii.) Community and Ecosystem
Consider the size and activity of the backend's community and ecosystem. A vibrant community can provide valuable resources, support, and ongoing development contributions. Evaluate the quality of documentation, forums, and support channels to gauge the level of community engagement.
viii.) Operational Overhead
Assess the operational overhead associated with deploying and managing the backend. Consider factors such as installation complexity, configuration flexibility, and ongoing maintenance requirements. Choose a backend that aligns with your team's expertise and operational capabilities to minimize overhead.
ix.) Cost and Licensing
Finally, consider the backend's cost and licensing model. While some options may be open source and free to use, others may require a subscription or commercial license. Evaluate the total cost of ownership, including infrastructure, support, and additional features or services offered by the backend provider.
Conclusion
Overall, OpenTelemetry simplifies the process of instrumenting, collecting, and analyzing telemetry data, providing developers and operators with valuable insights into the behavior and performance of their distributed systems.
Coupling it with an observability monitoring tool would improve your chances of catching performance bottlenecks in advance, keeping track of trends and patterns, and detecting anomalies in the first instance of an error or an exception.
Consider all the key points I've listed here before you select an observability tool to have a hassle-free user experience.
Whether you're embarking on a new observability initiative or looking to enhance your existing setup, this guide will equip you with the knowledge needed to make informed decisions and set a solid foundation for effective observability practices.
Atatus API Monitoring and Observability
Atatus provides Powerful API Observability to help you debug and prevent API issues. It monitors the consumer experience and is notified when abnormalities or issues arise. You can deeply understand who is using your APIs, how they are used, and the payloads they are sending.
Atatus's user-centric API observability tracks how your actual customers experience your APIs and applications. Customers may easily get metrics on their quota usage, SLAs, and more.
It monitors the functionality, availability, and performance data of your internal, external, and third-party APIs to see how your actual users interact with the API in your application. It also validates rest APIs and keeps track of metrics like latency, response time, and other performance indicators to ensure your application runs smoothly.
#1 Solution for Logs, Traces & Metrics
![]() APM
APM
![]() Kubernetes
Kubernetes
![]() Logs
Logs
![]() Synthetics
Synthetics
![]() RUM
RUM
![]() Serverless
Serverless
![]() Security
Security
![]() More
More

![New Relic vs Splunk - In-depth Comparison [2025]](/blog/content/images/size/w960/2024/10/Datadog-vs-sentry--19-.png)
![New Relic vs Sentry - Which Monitoring Tool to Choose? [2025]](/blog/content/images/size/w960/2024/10/VS--1-.png)
![Splunk vs Prometheus: A Side-by-Side Comparison [2025 Guide]](/blog/content/images/size/w960/2024/08/Datadog-vs-sentry--13-.png)