How to Get Started with Heroku Logging
Heroku is a platform for deploying, running, and managing applications, which is written in a variety of programming languages, including Python, Java, C#, JavaScript, PHP, and others. Heroku's goal is to free you up to focus on your applications rather than infrastructure management. Logging is usually included in infrastructure management. Heroku provides a high-level log maintenance tool.
In this Heroku logging article, we'll learn how to get the most out of Heroku logs. We will start with a review of Heroku's basic anatomy to have a clear understanding of the terminologies and mechanics of Heroku's logging feature.
Here is how it’s done:
- Heroku Architecture Overview
- Getting to Know Heroku Logging
- View Heroku Logs
- Heroku Release Logs
- Heroku Router Logs
- Log Runtime Metric Logs
- Managing Sensitive Log Data
- How to Create a Log Drain in Heroku
- Heroku Tail Logs
- Heroku Logging (Specific Languages)
- Heroku Logging – PHP
- Heroku Logging – Java
- Heroku Logging – Node.js
- Heroku Logging – Python
- Heroku Logging – C#
#1 Heroku Architecture Overview
Heroku architecture is made up of a platform stack that includes a language runtime, multiple libraries, the operating system, and the underlying infrastructure for building scalable web applications.
The following diagram depicts the Heroku platform's high-level architecture:
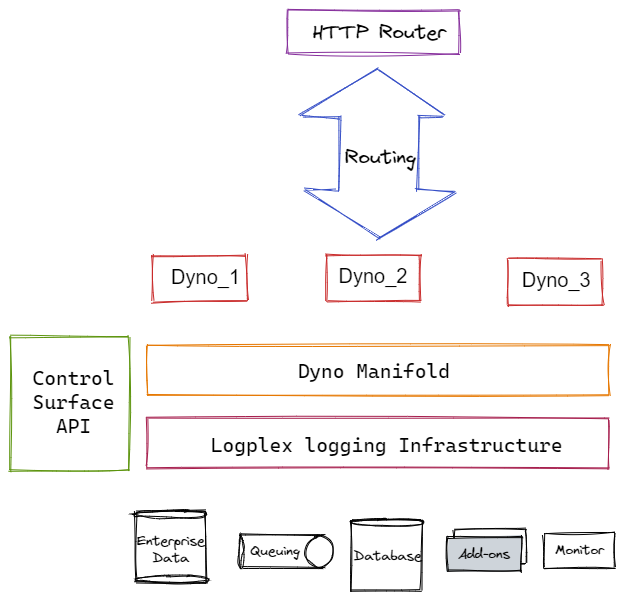
Process Management
On the Heroku platform, the dyno manifold (DM) is the foundational component for the execution environment. It's a horizontally scalable, distributed, fault-tolerant execution environment for application dynos. It maintains a wide range of process type instances using a process model in an automated and low-maintenance manner.
A dyno is the unit of work on the Heroku platform. On the dyno manifold, dynos are fully isolated, highly accessible (virtual) containers.
Dynos receives web requests from routing mesh, uses environment variables to connect to application resources such as a database, and writes output to the Heroku Logplex log message sink.
A process type specifies the template that will be utilized to create a specific process. It's a command that's been declared. When a dyno of that process type is started, the command is run. On Heroku, there are at least two process types: Web and Worker.
HTTP client requests are normally handled by an instance of the web process type. All requests are sent through the router to the web process type.
Other tasks, such as custom jobs, long-running background jobs, and queuing tasks, are executed using the worker process type instance. Heroku also allows you to design new process types based on your requirements.
Logging
Logplex collects log streams from a variety of sources, including application tasks, system components, and backend services, and consolidates them into a single output pool. Additional filters can be used to look for specific log messages, allowing for more flexibility in logging.
HTTP Routing
The routing mesh routes requests for a web resource to the appropriate web process dyno. A load balancer receives incoming requests and automatically distributes HTTP requests to specified dynos via this mesh. The routing mesh is in charge of locating the application's web dynos within the dyno manifold and routing the HTTP request to one of these dynos.
Heroku Interfaces
For constructing and running an application, Heroku provides numerous control surfaces such as process management, routing, logging, scalability, configuration, and deployment. A command-line interface (CLI), a web-based console, and a full REST API are all provided. These control surfaces give the application developer the ability to manipulate different features of the application through several touchpoints.
#2 Getting to Know Heroku Logging
Over the various application logs, Heroku logging provides a more abstract layer. Multiple components make up the application, including a database, web routing with REST API, and others. Heroku can collect logs from a variety of sources and visualize them using a Heroku add-on.
For the log, Heroku uses the following type of source:
- Application Logs
The application code generates log records. Application developers are in charge of the message format. - System Logs
The Heroku platform is built on these log records. It logs actions including building, deploying and crashing processes. - API Logs
The messages record the developers' application administrative operations (deploy new code, scale the dyno resources, rollbacks). - Add-on Logs
The add-on services generate log entries. You can see the complete list of supported add-ons in their documentation for more logging information.
Log Structure
There are four fields in each log record:
- Timestamp
When the dyno generates the event, the timestamps have been appropriately generated. RFC5424 is the standard format for timestamps. UTC (Universal Time Zone) is the default time zone. - Source
The source of the log record. It might be the application itself (the source is the application), the Heroku platform (the source is Heroku), a third-party add-on, or anything else. - Dyno
The name of the Heroku process (dyno) that generates the log record. - Message
A string containing an unprocessed log message. The message contains not only a human-readable record of the event but also metadata (such as an inner timestamp or severity) in a format appropriate for the type of event (for example, Heroku URI routing includes fields from HTTP requests).
The actual log record might look like this:
2022-03-17T08:25:21.297420+00:00 app[api]: Initial release by user your@email.comThe example, as you can see, covers all four log record fields.
#3 View Heroku Logs
Another important CLI parameter is the filter. For example, we can opt to only see log entries from a specific Dyno by using the following filter:
$ heroku logs --dynoView Heroku App Logs:
$ heroku logs --source appView Heroku API Logs:
$ heroku logs --source app --dyno APIView Heroku System Logs:
$ heroku logs --source HerokuBy default, Heroku utilizes the UTC timezone for its logs. You can modify it, but it's best to adapt to the client's local timezone when showing the data, which you can do with a library like Luxon.
To find out what timezone you're in:
$ heroku config:get TZTo change the timezone for Heroku logs:
$ heroku config:add TZ="America/New_York"A complete list of timezone formats is available here.
#4 Heroku Release Logs

The status of each application release is shown in the release logs. This includes pending failed releases caused by a release command that has yet to yield a status. In the following release log entry, version 44 of an application deployment failed:
v44 Deploy ada5527 release command failedCurl can be used to verify the status of a release programmatically. Use the Platform API to look for specific releases or to see a list of all available releases. A GET request on the URL can also be used to retrieve release output programmatically. The output_stream_url attribute specifies where the output can be found.
#5 Heroku Router Logs
In Heroku's common runtime, the router logs contain entries concerning HTTP routing. The entry and exit points for web applications and services running on Heroku Dynos are represented by these. Dynos in a multi-tenant network is managed by the runtime. Only the routing layer sends connections to Dynos in this network.
The following is an example of a Heroku router log entry:
2022-03-17T07:14:01.621068+00:00 heroku[router]: at=info method=GET path="/db" host=quiescent-seacaves-75347.herokuapp.com request_id=777528e0-621c-4b6e-8eef-74caa34c1713 fwd="104.163.156.140" dyno=web.1 connect=0ms service=19ms status=301 bytes=786 protocol=httpsFollowing the timestamp in the previous example, we observe a message with one of the following log levels: at=info, at=warning, or at=error. The entry has extra fields after the alert level that describe the problem being reported.
#6 Log Runtime Metric Logs
Heroku Labs offers a tool called "log-runtime-metrics" to monitor load and memory utilization for applications running in Dynos. The CLI command $heroku logs —the tail can be used to view data about memory and swap use, as well as load averages, all of which flow into the application's log stream.
The following are some examples of runtime metric logs:
source=web.1 dyno=heroku.2808254.d97d0ea7-cf3d-411b-b453-d2943a50b456 sample#memory_total=21.00MB sample#memory_rss=21.22MB sample#memory_cache=0.00MB sample#memory_swap=0.00MB sample#memory_pgpgin=348836pages sample#memory_pgpgout=343403pagesMore information on how to use runtime metrics may be found in the documentation.
#7 Managing Sensitive Log Data
The source of the web application's vulnerability was shockingly exposed in poorly configured and improperly monitored log streams in recent security breaches at big eCommerce companies like Aeroflot and Uber.
Developers were unaware that their log streams contained OAuth passwords, API secret keys, authentication tokens, and a range of other confidential data in several recent situations involving customer credit card loss and proprietary source code exposure.
Log files generated by cloud platforms with default output including authentication credentials may not be effectively safeguarded. Unauthorized individuals obtained access to numerous recent security breaches by accessing log entries containing authentication credentials.
Sensitive data should be obscured before transmitting logs. After the logs have been transmitted, you should remove specific data from them.
#8 How to Create a Log Drain in Heroku
Logplex makes it simple to gather logs from applications and send them to log archives, search and query engines, and log analytics add-on applications. We can use two types of drain to control how application logs are processed: Syslog drains and HTTPS drains.
Step 1: Install a log analytics application, preferably one that supports machine learning analytics, and get an authorization token to use it.
Step 2: Configure a Heroku Log Drain using Syslog or HTTPS to transport data from a Heroku Dyno application to the Add-on analytics application (appName).
To start a TLS Syslog drain, use the following CLI command:
$ heroku drains:add syslog+tls://logs.this-example.com:012 -a appNameHere's the plain text Syslog drain for the same appName:
$ heroku drains:add syslog://logs.this-example.com -a appNameTo configure an HTTPS drain:
$ heroku drains:add https://user:pass@thislogdrain.app.com/logs -a appNameStep 3: With the add-on analytics application's dashboard of visualizations, you can monitor the application performance running in the Dyno.
#9 Heroku Tail Logs
The real-time tail parameter is the Heroku logs –tail option. Its goal is to show current log entries while keeping the session alive for new ones to come in while the application is still running in production. This is useful for putting live applications through their paces in real-world settings. Real-time log monitoring has several subtleties. Before we get into the details of how to use the log –tail, let's go over the basics.
Logs are treated by Heroku as time-ordered event streams. If an application is deployed across multiple Dynos, the whole log is not present in *.log files, because each log file only contains one view per container. As a result, all log files must be combined into a single log for log analysis.
Heroku's filesystem is also temporary. All previous logs are lost when a Dyno restarts. Running Heroku console or "run bash" on Cedar Stack does not connect to an existing Dyno, but instead generates a new one only for this bash command, hence the term "one-off process." As a result, the HTTP processes for this newly generated Dyno are missing from earlier Dynos' log files.
With this in mind, use the -t (tail) parameter to examine a real-time stream from a running application, for example:
$ heroku logs -t2022-03-17T12:33:16-07:00 app[web.1]: Processing PostController1#list (for 208.39.138.12 at 2010-09-16 15:13:46) [GET] 2020-09-16T15:13:20-07:00 app[web.1]: Rendering template layouts/application 2020-06-16T15:13:46-07:00 heroku[router]: GET myapp.heroku.com/posts queue=0 wait=1ms service=2ms bytes=1975 2020-06-16T15:13:47-07:00 app[worker.12]: 23 jobs processed at 16.6761 j/s, 0 failed ...We're looking at the behavior of a running application in the above log entry. This is useful for monitoring in real-time. We can build a drain to an add-on log analytics application to store the logs for extended periods and triggers, alerts, and analysis.
#10 Heroku Logging (Specific Languages)
Each language includes built-in logging capabilities that can be used to write to Heroku logs. Third-party logging applications are made to supplement built-in logging features and compensate for inadequacies.
Heroku's original supported language was Ruby. As a result, many of the well-known developer shortcuts for getting the most out of Heroku logs came from Ruby application development and deployment. A running application can write to logs. This is done in Ruby with puts:
puts "User clicked twice before callback result, logs!"With Java, the identical log entry would be written as follows:
System.out.println("User clicked twice before callback result");Heroku maintains an application log for everything that is written to stdout. Heroku is language-independent, although the application logs are created in the application-specific language. You can use the logging framework provided by each language.
We'll go through a few of them, but there are dozens more. Keep in mind that Heroku collects logs from a variety of sources when selecting a logging framework.
Your logging framework should be able to add application identity (process ID, machine name) and a timestamp to log records. Furthermore, the logging framework should keep log verbosity (the severity levels such as into, debug, error are a matter of course).
#11 Heroku Logging – PHP
For PHP, there are several logging frameworks to choose from. The built-in PHP error log is sent to stderr by default, and any message logged with the error_log() method will appear in Heroku logs:
error_log("This is an error log.");However, if you utilize a web application server framework, it usually comes with some logging built-in. As a simple monolithic web application framework, Laravel is highly popular nowadays. The file app/config/logging.php in the Laravel project tree contains the configuration of the various logging channels. The variable LOG_CHANNEL in the configuration file sets up a log channel by default. For proper logging on Heroku, simply set the LOG_CHANNEL variable to the value errorlog:
$ heroku config:set LOG_CHANNEL=errorlogThe following code sample shows how to use log static functions. The documentation contains a list of all possible methods. If you run this code, you'll get log reports that look somewhat like this:
[2022-03-17 12:26:29] production.INFO: This is an INFO log.
[2022-03-17 12:26:30] production.ERROR: This is an ERROR log.
The log record comprises the timestamp, log level severity, and log message, as you can see.
#12 Heroku Logging – Java
SLF4J is a Java facade that allows us to integrate any Java logging framework at runtime. So, while SLF4J is not a logging framework, it can be used to construct any Java logging framework at runtime. We'll use the Java logging framework Log4J to demonstrate this.
The log template is defined by Log4J in the configuration file log4j.properties, which is located in the java project's src/main/resources directory. The file log4j.properties can contain the following setup for the Heroku logging:
log4j.rootLogger = ERROR, stdout
log4j.appender.stdout = org.apache.log4j.ConsoleAppender
log4j.appender.stdout.layout.ConversionPattern = % d % 5 p[ % t]( % F: % L) - % X {
    sessionId
} % n - % m
The logs are written to stdout, and each log record has fields like a date (%d), severity level (%p), file and line number in java code (%F:%L), sessions ID, message (%m), and others.
Now we need to connect Log4J and SLF4J. The following dependencies must be defined in the POM (read the official documentation for further information on POM and Maven building):
<dependency>
	<groupId>log4j</groupId>
	<artifactId>log4j</artifactId>
	<version>1.2.17</version>
</dependency>
<dependency>
	<groupId>org.slf4j</groupId>
	<artifactId>slf4j-log4j12</artifactId>
	<version>1.7.30</version>
	<scope>test</scope>
</dependency>
The first dependence defines Log4J, while the second associates it with the SLF4J facade.
You can now import the SLF4J dependencies into your Java code:
import org.slf4j.Logger;
import org.slf4j.LoggerFactory;
If you wish to log something, create a Log4J logger instance and name it with the appropriate severity:
Logger logger = LoggerFactory.getLogger("MyLogger");
logger.info("This is an INFO log record.");
logger.error("This is an ERROR log record.")
The application generates log records that look like this:
2022-03-17 05:37:59,100 INFO [main] (MyLogger.java:71) - 123456 - This is an INFO log record.
2022-03-17 05:38:03,767 ERROR [main] (MyLogger.java:72) - 123456 - This is an ERROR log record.
As you can see, the log4j.properties configuration defines the log record fields.
#13 Heroku Logging – Node.js
A web application layer, where REST API routing occurs, is a common use case for Node.js on the server-side. The framework Express.js is the most popular for this purpose. In the case of REST API, you'll usually want to log requests. Morgan is a framework that focuses only on recording HTTP requests. It's incredibly easy to use. Take a look at the following simple Express.js application, which includes Morgan logging:
const express = require('express');
const morgan = require('morgan');

const app = express();
app.use(morgan('combined'));

app.get('/', (req, res) => {
    res.send('Hello from Express.js server!')
});

// run the server on the port 8080
app.listen(8080, () => {
    console.log('Hello!!!');
});
The application only has a single URI route "/" and when this route is requested, the log record is generated. The app.use(morgan(")) enables Morgan logging, which determines the verbosity and format of the log output.
The two possible verbosity levels for Heroku logging are significant: Common and Combined.
Template for Apache common log output:
:remote-addr - :remote-user [:date[clf]] ":method :url HTTP/:http-version" :status :res[content-length]For example:
::1 - - [17/MAR/2022:10:44:19 +0000] "GET / HTTP/1.1" 304 –Template for Apache's combined log output:
:remote-addr - :remote-user [:date[clf]] ":method :url HTTP/:http-version" :status :res[content-length] ":referrer" ":user-agent"For example:
::1 - - [17/MAR/2022:10:50:52 +0000] "GET / HTTP/1.1" 200 29 "-" "Mozilla/5.0 (X11; Linux x86_64) AppleWebKit/537.36 (KHTML, like Gecko) Chrome/91.0.4472.77 Safari/537.36"Morgan, as you can see, uses Apache common format, which is a well-known standard that many log manipulation can accept.
If you wish to log something other than routing, you can use Winston, Pino, or Loglevel, which are all general-purpose Node.js logging frameworks.
#14 Heroku Logging – Python
Flask, Gunicorn, and Django are some of the most popular web server frameworks for Python. Each one comes with its logging tool. Python, on the other hand, has native logging functionality, which all of these frameworks simply expand.
As a result, all of the most popular Python web servers provide logging functionality. We'll show logging for the Flask (a lightweight Python web framework). In Flask, you can use a basic logger for routing:
#!/usr/bin/python
# -*- coding: utf-8 -*-
import os
from flask import Flask
app = Flask(__name__)  # create Flask server

# get instance of logger and set log severity as defined by the cli parameter
gunicorn_logger = logging.getLogger('gunicorn.error')
app.logger.handlers = gunicorn_logger.handlers
app.logger.setLevel(gunicorn_logger.level)

@app.route('/')
def hello():
    app.logger.debug('This is a DEBUG log record.')
    app.logger.info('This is an INFO log record.')
    app.logger.warning('This is a WARNING log record.')
    app.logger.error('This is an ERROR log record.')
    app.logger.critical('This is a CRITICAL log record.')
    return 'Hello!!!'
The app.logger creates log records based on well-established priorities (debug, info, error, and others). The timestamp and process ID are added to each log report by the logger. The following log records will be generated when method hello() is called (the method will be executed every time a user requests the endpoint "/"):
[2022-03-17 11:38:57 +0200] [72137] [DEBUG] This is a DEBUG log record.
[2022-03-17 11:38:57 +0200] [72137] [INFO] This is an INFO log record.
[2022-03-17 11:38:57 +0200] [72137] [WARNING] This is a WARNING log record.
[2022-03-17 11:38:57 +0200] [72137] [ERROR] This is an ERROR log record.
[2022-03-17 11:38:57 +0200] [72137] [CRITICAL] This is a CRITICAL log record.
As you can see, the logger converts the log message to plain text format. When launching the server, use the CLI option to set the log verbosity level. If you run the previous python script with the parameter —log-level=warning, only log records of severity warning and above will be generated.
If you want to use a specific logging system, Python has several options, including Loguru.
#15 Heroku Logging – C#
Log4Net, Nlog, and Serilog are just a few of the C# logging frameworks available. They all have logging features in common. The Log4Net framework will be demonstrated.
The log record template was built up in the XML configuration file by Log4Net. For example:
<log4net>
	<appender name="A1" type="log4net.Appender.ConsoleAppender">
		<layout type="log4net.Layout.PatternLayout">
			<conversionPattern value="%-4timestamp [%thread] %-5level %logger %ndc - %message%newline" />
		</layout>
	</appender>
	<root>
		<level value="DEBUG" />
		<appender-ref ref="A1" />
	</root>
</log4net>
The log is written to stdout with the ConsoleAppender appender. The output will be formatted with a PatternLayout, which allows you to customize the pattern (timestamp - %timestamp, process name - %thread, verbosity level - %level, and others). The root logger is set to DEBUG, which is the lowest degree of verbosity.
The following code snippet shows how to load Log4Net's XML configuration and create several log records:
using log4net;
using log4net.Config;
public class MyApp {
    private static readonly ILog log = LogManager.GetLogger(typeof(MyApp));

    static void Main(string[] args) {
        XmlConfigurator.Configure(new System.IO.FileInfo(args[0]));
        log.Info("This is an INFO log record.");
        log.Error("This is an ERROR log record.");
    }
}
The XmlConfigurator parses the XML configuration file specified on the command line. If you want to alter the logging behavior, all you have to do is change the XML configuration; you don't have to recompile the code.
The following log output will appear in your console if you run this code with XML configuration as a command-line parameter:
2022-03-17 13:47:43,508 [main] INFO  MyApp - This is an INFO log record.
2022-03-17 13:47:43,529 [main] ERROR  MyApp - This is an ERROR log record.
The log record fields, as you can see, are defined by the XML configuration.
Conclusion
In this article, you learned about Heroku logging and what it can do, as well as the different types of logs that may be kept and the log record format. You also learned how to use the command-line interface to inspect Heroku logs and filter the logs based on the source.
After that, you configured your service's application log in platform-specific languages (Python, Java, C#, JavaScript, and PHP) to be kept by Heroku.
Heroku allow you to focus on developing excellent applications rather than getting bogged down in the details of setting up and managing infrastructure. The Heroku logs, which allow you to monitor your stack error debugging, are one of the many fantastic aspects of working with it.
Atatus Logs Monitoring and Management
Atatus offers a Logs Monitoring solution which is delivered as a fully managed cloud service with minimal setup at any scale that requires no maintenance. It monitors logs from all of your systems and applications into a centralized and easy-to-navigate user interface, allowing you to troubleshoot faster.

We give a cost-effective, scalable method to centralized logging, so you can obtain total insight across your complex architecture. To cut through the noise and focus on the key events that matter, you can search the logs by hostname, service, source, messages, and more. When you can correlate log events with APM slow traces and errors, troubleshooting becomes easy.
#1 Solution for Logs, Traces & Metrics
![]() APM
APM
![]() Kubernetes
Kubernetes
![]() Logs
Logs
![]() Synthetics
Synthetics
![]() RUM
RUM
![]() Serverless
Serverless
![]() Security
Security
![]() More
More

![New Relic vs Splunk - In-depth Comparison [2026]](/blog/content/images/size/w960/2024/10/Datadog-vs-sentry--19-.png)