Real User Monitoring - Beginners Guide
Do you know what your website users are really experiencing? Are they satisfied with your website's performance? Are they able to easily navigate and find what they're looking for?
Real User Monitoring (RUM) is a powerful technique that can answer these questions and more. By collecting and analysing data on real user interactions, RUM provides valuable insights into user behaviour, website or application performance, and overall user experience.
In this blog, we will explore everything you need to know about RUM, including its benefits, techniques, tools, and vendors. So, if you want to improve your website's user experience, boost your conversion rates, and stay ahead of the competition, read on to discover the power of Real User Monitoring.
Table of Content
- What is Real User Monitoring?
- How RUM Works?
- Real User Monitoring Metrics
- Role of RUM in SRE Observability
- Advanced RUM techniques
- Best Real User Monitoring Tools
- RUM Benefits for Website Optimization
What is Real User Monitoring?
Real user monitoring (RUM) is a method of tracking and analysing the behaviour of users on a website or application in real-time.
It is like having a camera that watches what people do when they use the website. With RUM, you can see how long it takes for the website to load, which pages people look at the most, and how long they stay on each page. This information can help website owners and developers make the website work better and be more enjoyable for users.
By understanding how people use a website, they can fix any problems that might make it hard to use or frustrating. RUM is an important tool for making sure that a website is running smoothly and that people are having a good experience when they use it.
Real User Monitoring (RUM) utilizes JavaScript-based code that runs on the client-side in a user's web browser to collect data about their actual experience using a website or application. This method contrasts with synthetic monitoring tools, which simulate user behavior from a remote location.
The data collected through RUM is analyzed to identify any performance issues, such as slow page load times, high server response times, or errors that occur during user interactions. This information can be used to improve website performance, user experience, and increase user engagement and conversions.
RUM also provides valuable insights into user behavior, including which devices and browsers are most commonly used, which pages have high bounce rates, and which features or content are most engaging to users. This information is valuable in informing design and development decisions, as well as prioritizing feature development and bug fixes.
One of the significant advantages of RUM is its real-time monitoring and alerting capabilities, which enables developers and operations teams to quickly detect and respond to issues as they arise. This feature helps reduce downtime and prevent user frustration, ultimately minimizing lost revenue.
How RUM Works?
Real User Monitoring (RUM) functions by inserting a code into an application, which enables the capturing of performance metrics while the application is being used. Here is a step-by-step explanation of how RUM works.
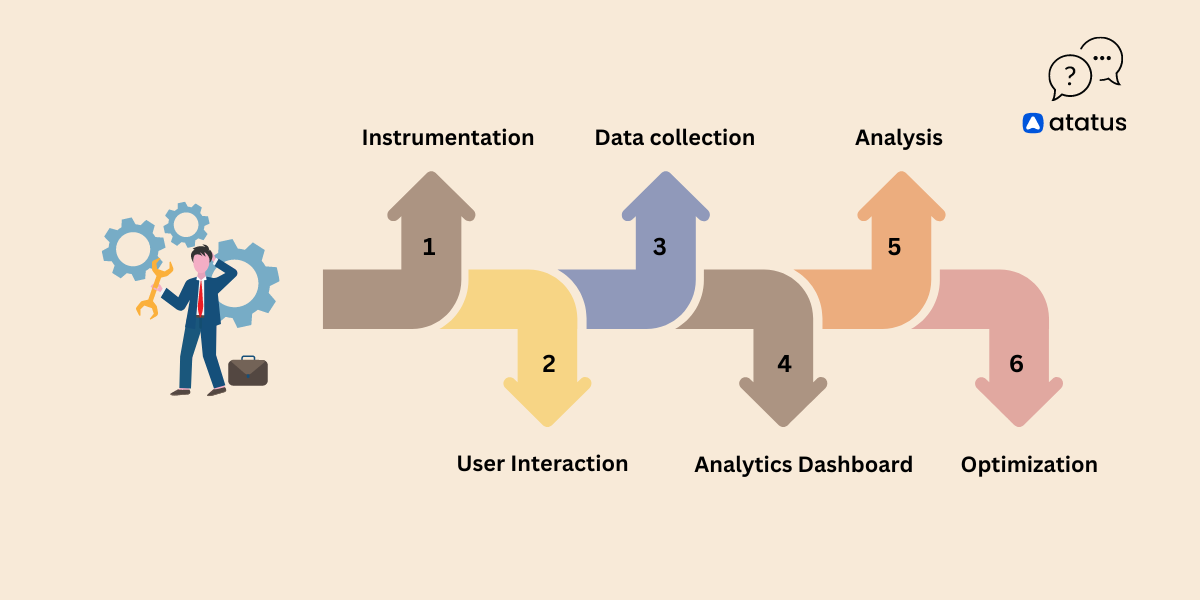
- Instrumentation: The website or application is instrumented with a small JavaScript code that is inserted into the page's HTML code.
- User Interaction: When a user interacts with the website or application, the JavaScript code captures various performance metrics like page load time, network requests, and user input events.
- Data Collection: The captured data is then sent back to a data collection server for processing and analysis.
- Analytics Dashboard: The collected data is displayed on an analytics dashboard where developers and product managers can view real-time metrics, like the number of active users, page views, and user engagement.
- Analysis: The analytics dashboard provides insights into how users are using the website or application, and where improvements can be made to enhance user experience and increase user engagement.
- Optimization: Using the insights gained from the analytics dashboard, developers can make targeted optimizations to improve website or application performance and user experience.
Real User Monitoring Metrics
Metrics of Real User Monitoring (RUM) measure how users interact with websites and web applications.The metrics provide insight into how real users feel about the performance and user experience.
- User Session Traces
- Page Load Time
- Page Views and Unique Visitors
- Core Web Vitals
- AJAX Response Time
- CPU and Memory Usage
- Javascript Errors
- Geographical Distribution
1. User Session Traces
Detailed transaction traces are provided for individual user sessions, allowing you to analyze the sequence of actions performed by a user.In addition to capturing all user interactions, they also capture network requests, allowing you to analyze specific user sessions' behavior and performance.
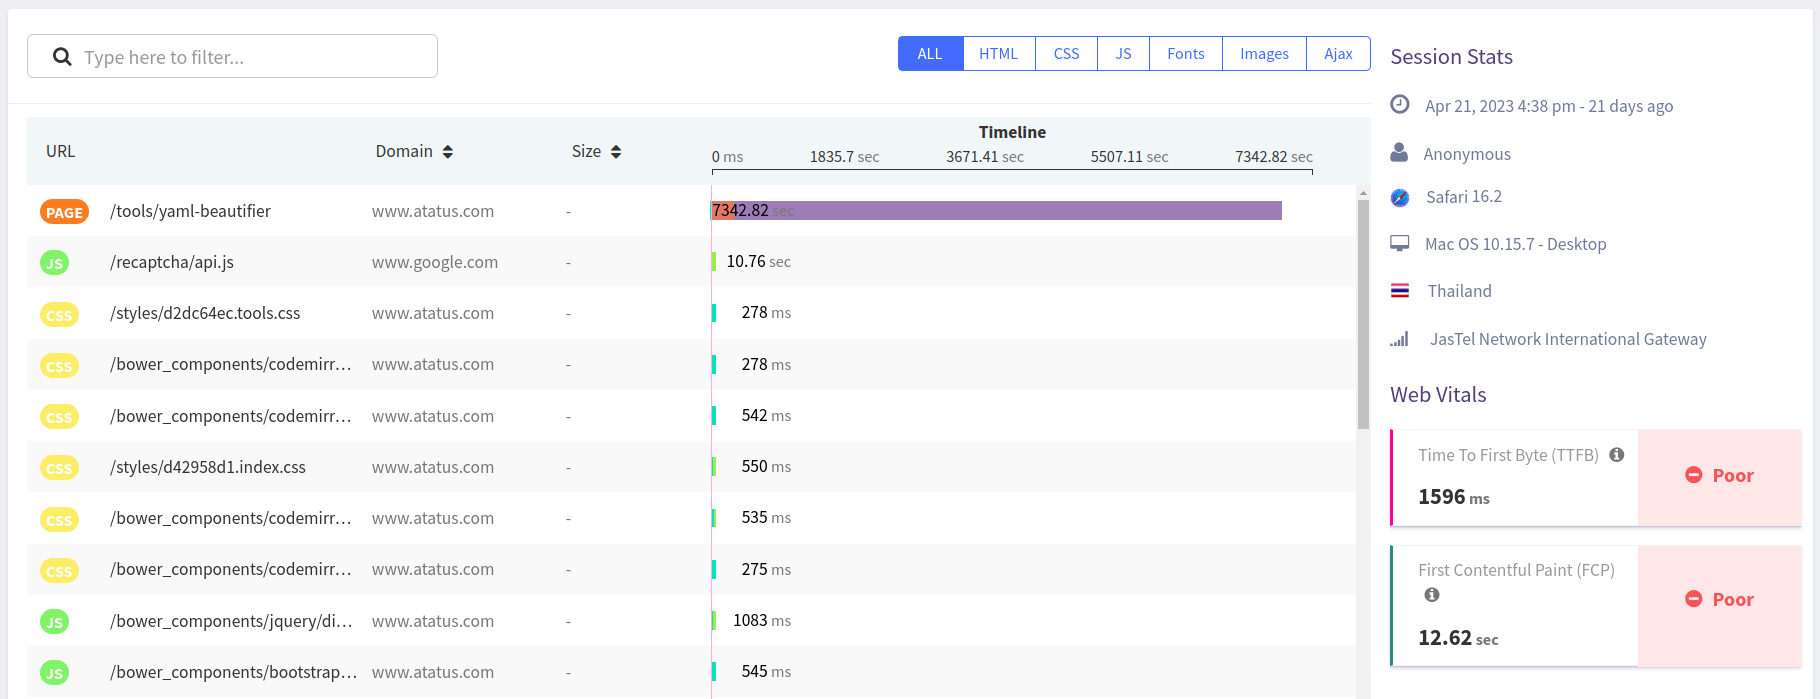
Session traces allow you to analyze user journeys and identify any friction points or areas where users may drop off. Optimizing the flow, layout, and functionality of your site can improve conversions and user engagement by understanding how users interact with it.
2. Page Load Time
The total time it takes for a web page to load completely in the user's browser. By monitoring the Page Load Time, you can identify any performance bottlenecks, slow-loading resources, or network-related issues that may impact the user experience.
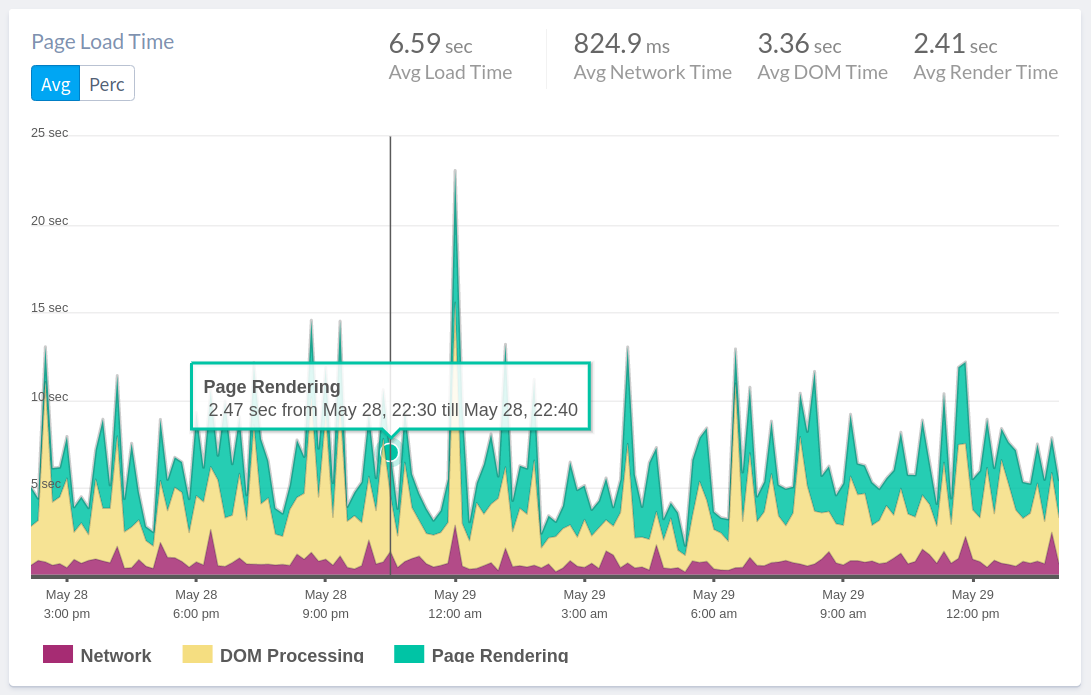
This information allows you to optimize your web application and improve its overall speed and responsiveness.
3. Page Views and Unique Visitors
Tracks the number of times a page has been viewed and the number of unique visitors to your application. These metrics help assess overall traffic and user engagement with your website.
- Page views count the number of times users visit your website and view its pages. Pages viewed by users are counted as page views each time they open the page. Using page views, you can see which pages are most popular and how users navigate your site.
- Unique visitors are the number of unique users who have visited your website within a certain period of time. Each user is counted only once, regardless of how often they visit or how many pages they view. Unique visitors let you know how many distinct people have interacted with your website.
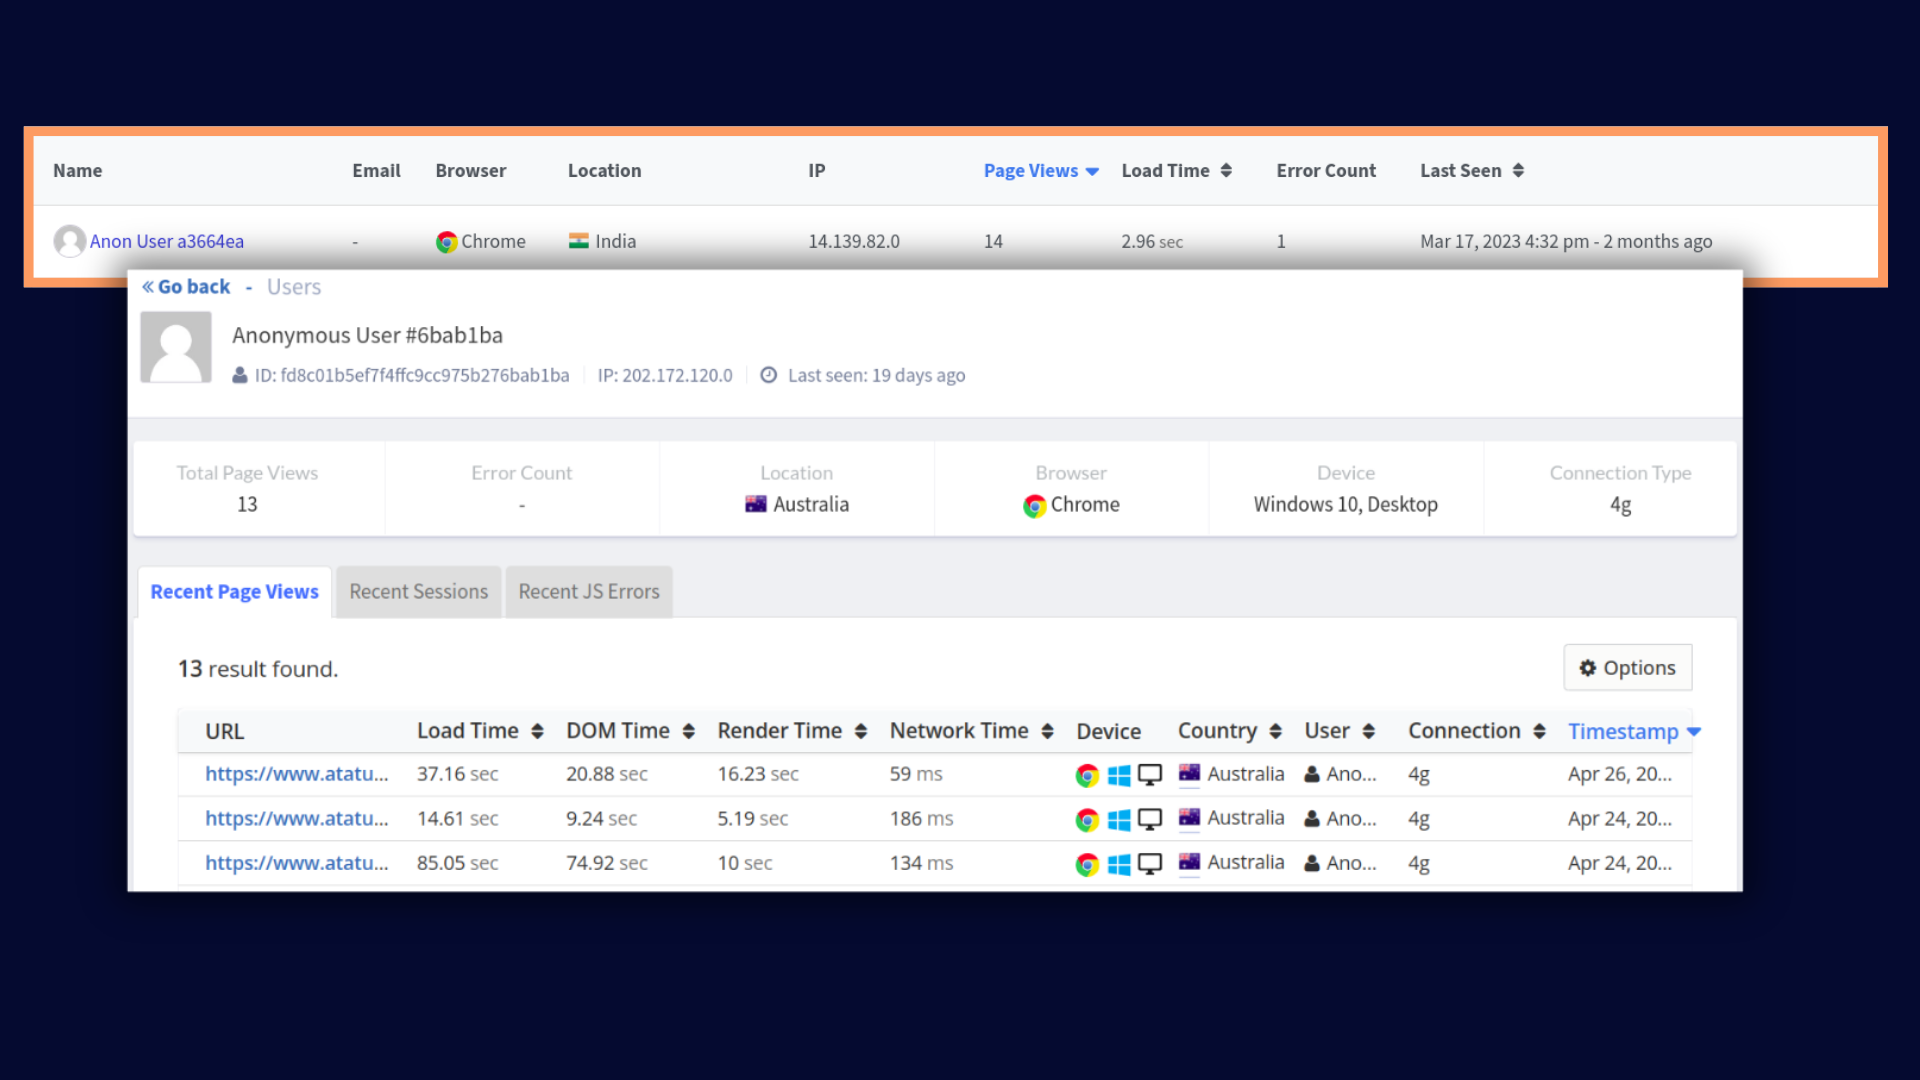
By analyzing the popularity and usage of different pages on your site, you can understand the size and reach of your audience.Data-driven decisions can be made to improve the performance and user experience of your website by using these metrics.
4. Core Web Vitals
Core Web Vitals are a set of specific website performance metrics that Google uses to assess the user experience provided by a web page. Websites that offer better performance in these areas may have an advantage in search engine rankings.
It includes three major key metrics:
- Largest Contentful Paint (LCP): Measures the loading speed of the largest visible element on the page.
- First Input Delay (FID): Measures the responsiveness of the page to user interactions.
- Cumulative Layout Shift (CLS): Measures the visual stability of the page by tracking unexpected layout shifts.
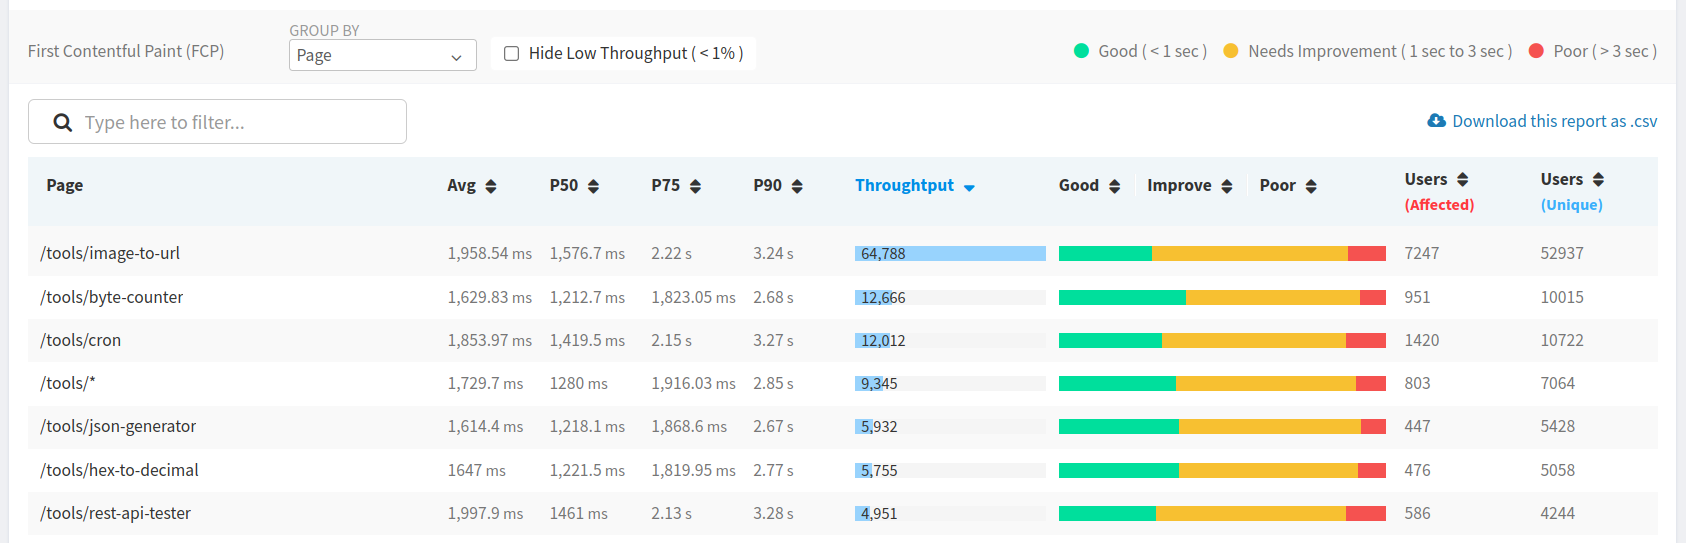
These metrics provide insights into how pages load, interact, and look, as well as how they are visually stable. In order to improve performance, reduce user frustration, and enhance the overall quality of their website, website owners and developers should monitor and optimize these core web vitals.
5. Ajax Response Time
Measures the time it takes for asynchronous requests (Ajax) to complete. Monitoring Ajax response time helps identify slow or failing requests that may impact the responsiveness of your application.
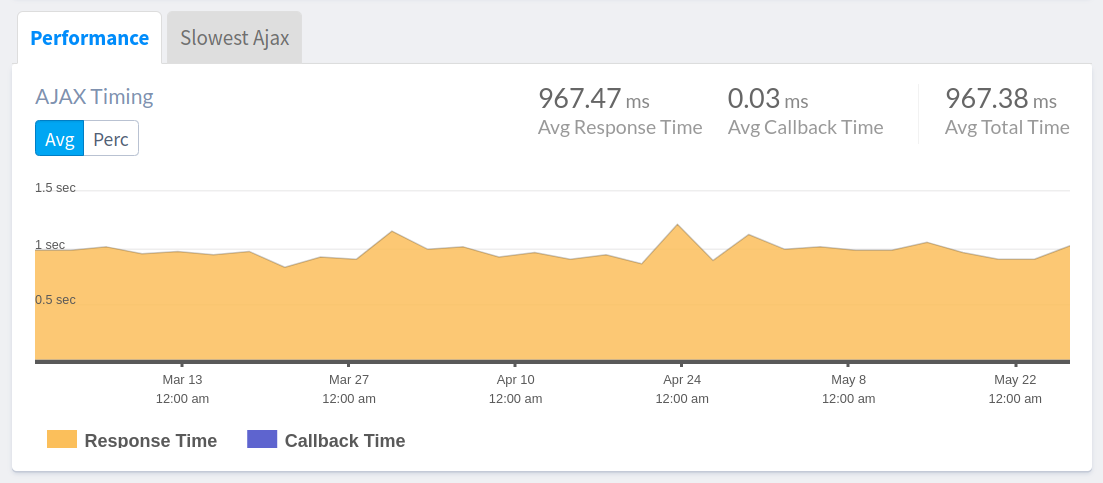
By monitoring the Ajax Requests metric, you can gain insights into how your application performs in terms of asynchronous data retrieval and interaction. This allows you to identify bottlenecks, optimize request handling, and improve the overall user experience.
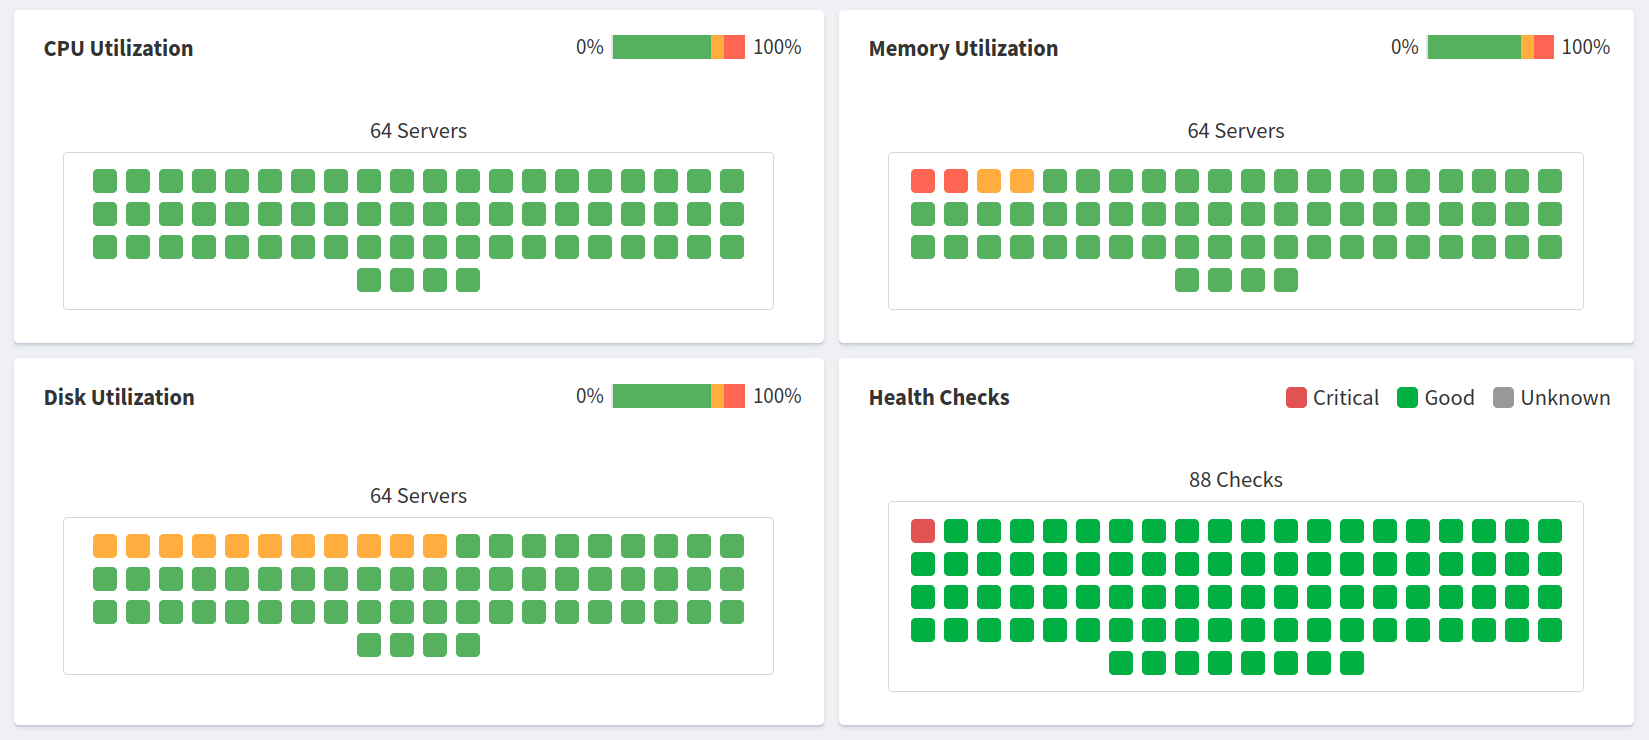
6. CPU and Memory Usage
CPU and memory usage are crucial metrics in browser monitoring as they provide insights into the resource utilization and performance of web applications. Here's a more detailed explanation of these metrics:
- CPU Usage: CPU usage relates to the amount of processing power the browser consumes while executing JavaScript and handling tasks. Using a large amount of CPU results in slow performance, unresponsive UIs, and increased battery drain on mobile devices.By monitoring CPU usage, we can identify code that is resource-intensive and optimize its performance.
- Memory Usage: Web application uses memory to store data, JavaScript objects, DOM elements, and images.Inefficient memory management and memory leaks can be detected through monitoring memory usage.When there is a high amount of memory being used, the rendering process becomes slow, unresponsive, and resource consumption increases.
7. JavaScript Errors
Counts the number of JavaScript errors occurring in the user's browser. Monitoring JavaScript errors helps detect and diagnose issues that affect the functionality and stability of your web application.
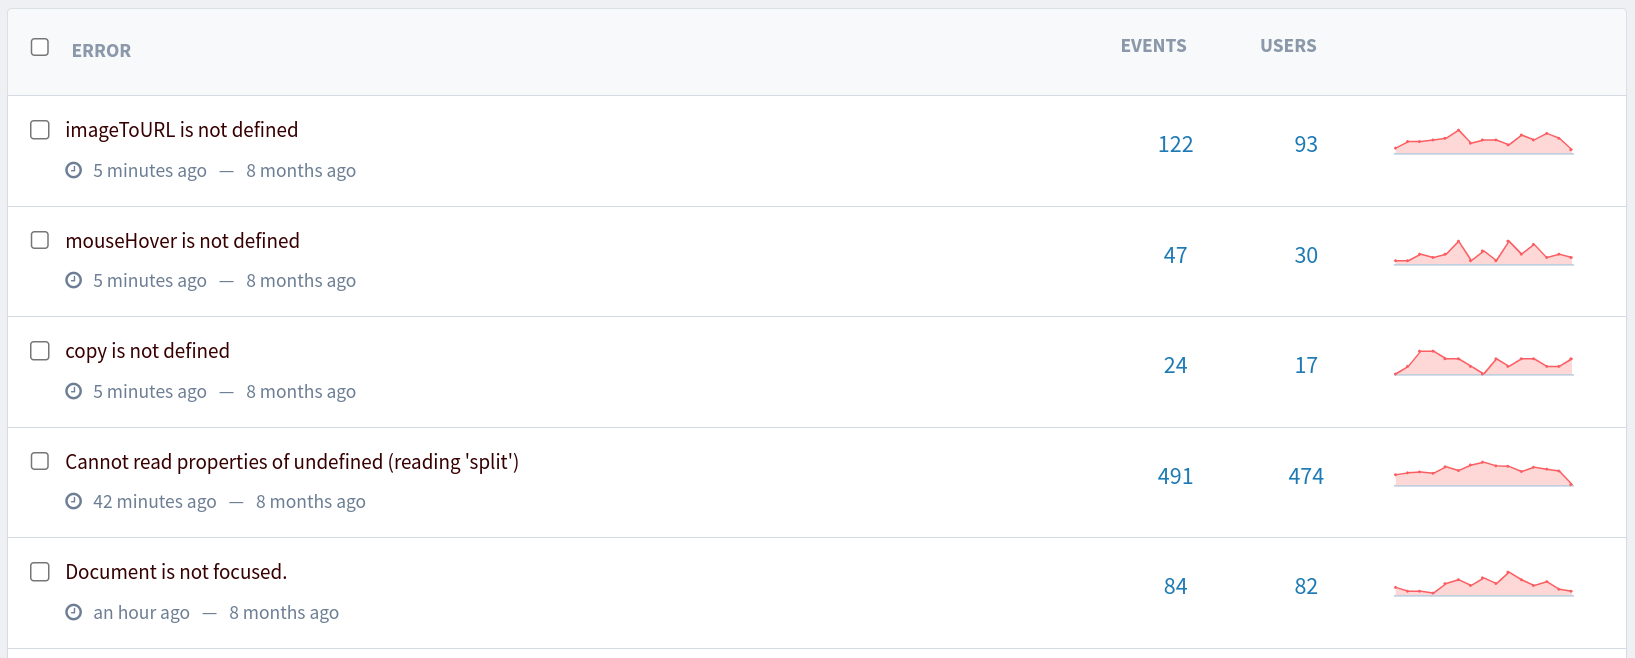
Obtain full visibility into the location of errors within your application, including the precise line of code where the error occurred. This saves valuable developer time by facilitating quick identification and resolution of errors.
You will have access to the specific function call or method that triggered the error, allowing for efficient debugging and troubleshooting.
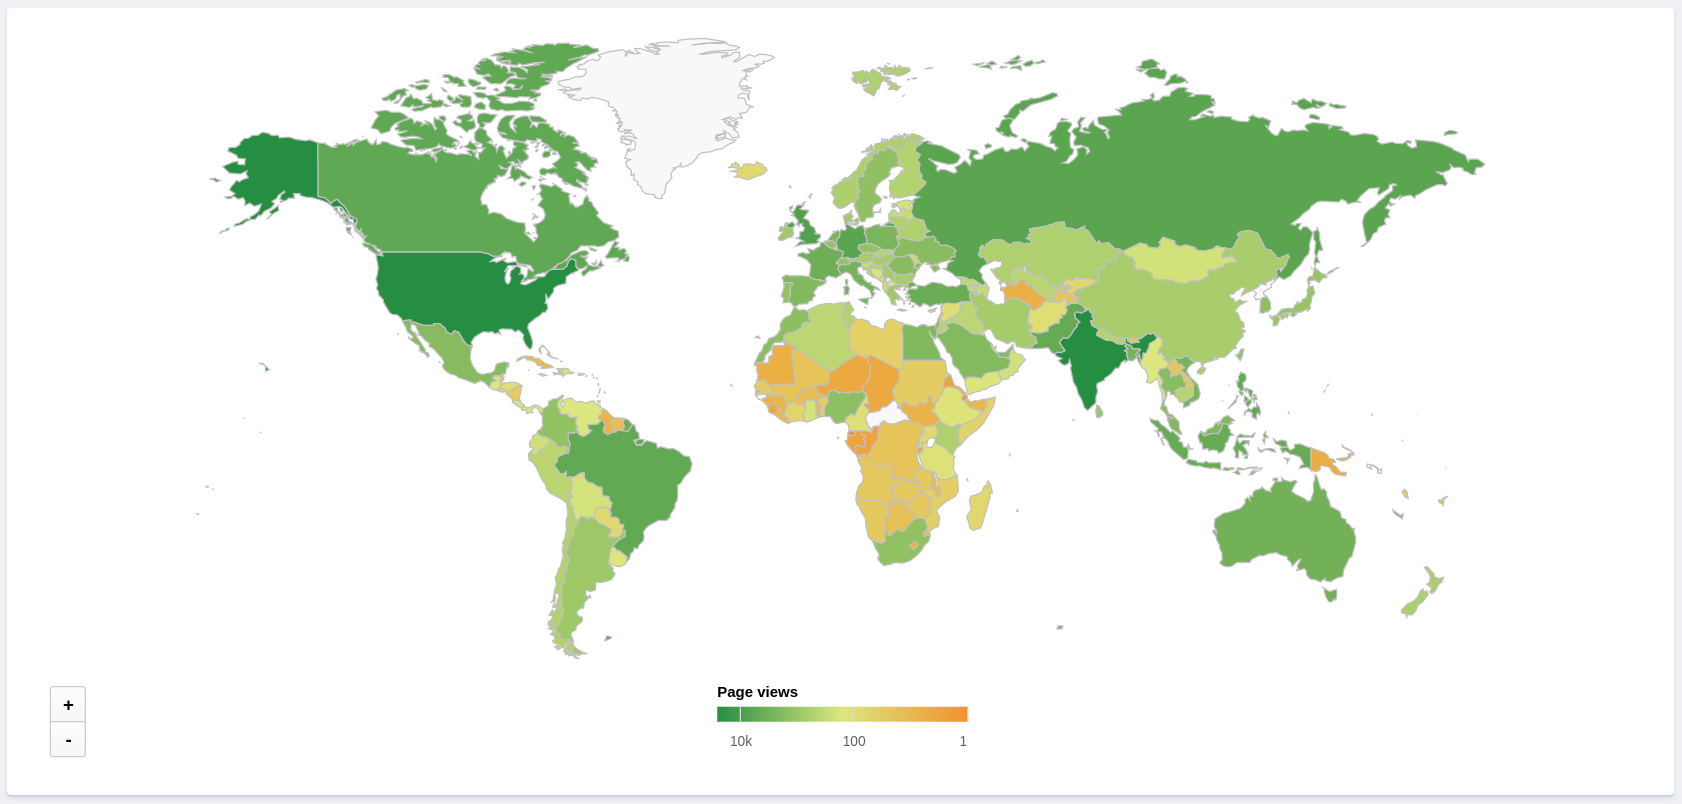
8. Geographical Distribution
Shows the geographic locations from which users are accessing your application. This metric helps identify regions with higher response times or connectivity issues, allowing you to optimize infrastructure or content delivery.
Role of RUM in SRE Observability
Real User Monitoring (RUM) is an important component of an SRE (Site Reliability Engineering) observability toolbelt. It provides valuable insights into the user experience and can help SRE teams quickly identify and diagnose performance issues, optimize website speed, and improve the user experience.
RUM fits into the SRE observability toolbelt in several ways. Firstly, it provides real-time data on user behaviour, allowing SRE teams to monitor and identify issues as they occur, and enabling them to take proactive measures to resolve them. This is crucial for maintaining high levels of uptime and ensuring the reliability of websites and applications.
Secondly, RUM helps measure website/application performance from the user's perspective, providing valuable insights into how users interact with websites and applications. This helps SRE teams understand how to optimize user experience, identify areas for improvement, and prioritize their efforts to deliver the best possible experience for users.
Finally, RUM helps optimize website/application performance by providing data that can be used to identify and fix performance issues. By analysing RUM data, SRE teams can identify slow page load times, high error rates, and other performance issues that can negatively impact user experience. This information can then be used to make improvements, such as optimizing code or server configurations, or implementing content delivery networks (CDNs) to improve page load times.
Advanced RUM Techniques
Advanced RUM techniques refer to the use of more sophisticated methods to collect and analyse Real User Monitoring (RUM) data. These techniques can provide deeper insights into website or application performance and user behaviour, helping to identify and resolve complex issues.
- Segmentation: This involves breaking down user data into different segments based on user behaviour, location, device type, and other factors. By analysing RUM data at a granular level, SRE teams can gain more insights into user behaviour and preferences, and identify areas for improvement.
- Synthetic Monitoring: This technique involves simulating user behavior on a website or application to collect data on performance and user experience. Synthetic monitoring can provide insights into how the website or application performs under different conditions, allowing SRE teams to identify potential issues before they affect real users. This proactive testing philosophy is gaining ground in customer operations too, where voice AI agents simulate and handle real user queries at scale before issues escalate to human teams.
- Error Analysis: This involves analysing error rates and types to identify patterns or common causes. By tracking errors over time and correlating them with user behaviour, SRE teams can identify and resolve issues that may be impacting the user experience.
- Performance Budgeting: This technique involves setting performance targets or budgets for various aspects of website or application performance, such as page load times or resource utilization. RUM data can be used to track performance against these budgets, helping SRE teams identify areas for improvement and prioritize their efforts.
Best Real User Monitoring Tools
There are a variety of RUM tools and vendors available on the market, each with their own unique features and capabilities. When choosing a RUM tool, it is important to consider factors such as pricing, ease of use, features, and support, to ensure that the tool meets the needs of your organization.
In the following sections, we will discuss some popular RUM tools and vendors and their features in more detail. Here are some popular RUM tools:
- Atatus: Atatus is a scalable end-user experience monitoring system that allows you to see which areas of your website are underperforming and affecting your users. Understand the causes of your front-end performance issues and how to improve the user experience.
- New Relic: New Relic is a cloud-based application performance monitoring tool that includes RUM capabilities. It provides real-time insights into user behaviour and application performance, allowing SRE teams to identify and resolve issues quickly.
- Dynatrace: Dynatrace is a full-stack monitoring tool that includes RUM capabilities. It provides real-time insights into user behaviour and application performance, as well as AI-powered analytics that can identify and prioritize issues.
- AppDynamics: AppDynamics is an application performance management tool that includes RUM capabilities. It provides real-time insights into user behaviour and application performance, as well as AI-powered analytics and automated root cause analysis.
- Pingdom: Pingdom is a website monitoring tool that includes RUM capabilities. It provides real-time insights into user behaviour and website performance, as well as alerts and reports on uptime and downtime.
Benefits of RUM for Website Optimization
RUM offers a number of benefits for website optimization. One of the key benefits of RUM is that it provides insight into how users are interacting with a website. This can include data on how long it takes pages to load, how long users are spending on each page, and how many clicks or interactions users are making on each page. By analysing this data, website owners can identify which pages are performing well and which ones need improvement.
- Provides real-time data: RUM provides website owners with real-time data on user behaviour and website performance. This data can be used to identify performance issues and areas where the user experience could be improved. For example, a user visits a website and RUM captures data on how long it takes for the page to load, how long the user spends on the page, and any interactions the user has with the page in real-time.
- Helps optimize website performance: By providing data on page load times, click-through rates, and other key metrics, RUM can help website owners optimize their website's performance. For example, if your RUM data shows that pages are taking a long time to load, you can investigate why this is happening and take steps to optimize page load times. This may include optimizing images or code, using a content delivery network (CDN), or leveraging browser caching.
- Improves end-user experience: RUM can help website owners identify areas where the user experience could be improved, such as with navigation or content. By making improvements based on RUM data, website owners can create a more engaging and user-friendly website. For example, if your RUM data shows that users are leaving your website after viewing only one page, you may need to improve your website's navigation or content to encourage users to explore further.
- Identifies issues before they become a problem: By providing real-time data on website performance, RUM can help website owners identify performance issues before they become a problem for users. This can help prevent user frustration and ensure a better overall user experience.
- Tracks the impact of website optimizations: RUM can help website owners track the impact of website optimizations over time. By monitoring changes in performance metrics after making changes to a website, website owners can determine which optimizations are having the greatest impact and adjust their optimization strategy accordingly.
Conclusion
Real User Monitoring (RUM) is a critical tool for ensuring the reliability and performance of websites and applications. By collecting and analysing data on real user interactions, RUM tools provide invaluable insights into user behaviour, website or application performance, and overall user experience.
SREs can use this data to identify and diagnose issues, prioritize optimization efforts, and ultimately improve the reliability and availability of their websites and applications. With the increasing importance of digital experiences, RUM will continue to play a crucial role in helping organizations deliver fast, reliable, and engaging digital experiences to their users.
By leveraging RUM, organizations can stay ahead of the competition and deliver exceptional digital experiences that keep users coming back for more.
Atatus Real User Monitoring
Atatus is a scalable end-user experience monitoring system that allows you to see which areas of your website are underperforming and affecting your users. Understand the causes of your front-end performance issues and how to improve the user experience.
By understanding the complicated frontend performance issues that develop due to slow page loads, route modifications, delayed static assets, poor XMLHttpRequest, JS errors, core web vitals and more, you can discover and fix poor end-user performance with Real User Monitoring (RUM).
You can get a detailed view of each page-load event to quickly detect and fix frontend performance issues affecting actual users. With filterable data by URL, connection type, device, country, and more, you examine a detailed complete resource waterfall view to see which assets are slowing down your pages.
#1 Solution for Logs, Traces & Metrics
![]() APM
APM
![]() Kubernetes
Kubernetes
![]() Logs
Logs
![]() Synthetics
Synthetics
![]() RUM
RUM
![]() Serverless
Serverless
![]() Security
Security
![]() More
More