The Real ROI of Using an APM Tool for SaaS Businesses in 2026
For every SaaS leader, engineer, and operations professional, growth is always the main goal. You’re expected to release features quickly, keep user experiences smooth, and manage everything within a limited budget.
But behind the scenes, your application may have hidden issues such as slow performance, unnoticed errors, and laggy transactions that quietly eat away at revenue, reduce customer trust, and exhaust your engineering team. Research indicates that poor application performance can have a staggering financial impact, noting that the average cost of IT downtime is $5,600 per minute, translating to over $300,000 per hour.
You’ve probably come across Application Performance Monitoring (APM) tools before. Maybe you’ve thought of them as just another expense or a developer’s dashboard. But it’s time to see them differently.
This article isn’t about monitoring for the sake of it. Instead, it’s about the real return on investment (ROI) that a strong APM tool can bring to SaaS businesses. We’ll show how performance improvements directly translate into business results: higher revenue, lower costs, and faster growth. And we’ll look at how Atatus is built to help drive that transformation.
What’s in this guide?
- What Exactly is Application Performance Monitoring (APM)?
- The Scope of APM
- Why SaaS Businesses Have a Non-Negotiable Need for APM?
- SaaS-Specific Challenges Addressed by APM
- Financial Benefits and ROI of SaaS Business Using APM
- How Atatus APM Solves SaaS Application Performance Issues?
- Conclusion
- FAQs about Atatus APM for SaaS Applications
What Exactly is Application Performance Monitoring (APM)?
At its core, Application Performance Monitoring (APM) involves tracking key software application performance metrics to ensure they meet expected service levels. It acts as the nervous system of your digital product.
A modern APM solution extends well beyond basic server uptime checks. It offers deep, code-level visibility into the entire application stack from backend infrastructure and to the frontend browser and everything in between. It answers vital questions:
- What is happening? (Is the app slow? Are there errors?)
- Where is it happening? (Which service, host, or line of code?)
- Why is it happening? (Root cause analysis)
- Who is affected? (Which users or customer segments?)
For SaaS companies, having this complete view isn’t optional; it's a core requirement for survival and growth.
The Scope of APM
Traditional monitoring might alert you when servers are unreachable. APM offering:
- End-to-end transaction tracing: Visualizes the path and latency of every user request on a per-service basis, including external API calls. This helps engineers pinpoint the exact service or query causing slowdown.
- Code-level diagnostics: Identifies specific lines of code, database queries, or external services responsible for anomalous behavior or errors.
- Real User Monitoring (RUM): Measures page load times, error rates, and responsiveness from the actual user's browser or device, capturing geographical and device-specific performance gaps.
- Anomaly Detection: Uses statistical baselines and machine learning (where applicable) to detect deviations from normal behavior and proactively alert teams before users complain.
- Infrastructure Correlation: Connects application metrics with underlying infrastructure data (CPU, memory, network) to correlate spikes or stress conditions that impact performance.
Why Precision Matters for SaaS?
SaaS apps often run distributed architectures with microservices, third-party integrations, and cloud infrastructure. The complexity makes manual troubleshooting time-consuming and error-prone.
APM takes care of spotting issues quickly and accurately, so SaaS teams can spend more time building new features instead of constantly fixing problems.
Why SaaS Businesses Have a Non-Negotiable Need for APM?
The SaaS model is unique because your product is delivered as a service over the internet, making performance critical. Even minor slowdowns or errors can hurt customer satisfaction, conversions, and revenue. SaaS apps often rely on complex architectures with microservices, cloud infrastructure, and third-party integrations, making issues hard to detect manually. Rapid deployment cycles further increase the risk of performance regressions. These factors create intrinsic challenges that make APM indispensable:
SaaS-Specific Challenges Addressed by APM
- Invisible Performance Issues: Without comprehensive APM, many application slowdowns or errors silently reduce conversions or increase churn before being noticed.
- Microservices Complexity: SaaS architectures now typically span dozens or hundreds of services and APIs. Single-point monitoring cannot capture distributed failures or cascading latency.
- Rapid Release Cadence: SaaS teams deploy multiple times daily, increasing the risk of performance regressions. Continuous visibility is required to maintain quality at speed.
- User-Centric Expectations: Modern SaaS customers expect near-instantaneous response times globally, any deviation risks abandonment.
APM takes care of spotting issues quickly and accurately, so SaaS teams can spend more time building new features instead of constantly fixing problems.
Curious which user journeys are hurting your SaaS conversions?
Financial Benefits and ROI of SaaS Business Using APM
The ROI of an APM tool isn't just about avoiding downtime. It's a compound effect of multiple efficiency and revenue-generating factors.
1. Enhanced Developer Productivity
- The Challenge:
Your highly-paid, talented developers are your innovation engine. Yet, they are constantly pulled away from strategic projects to play detective. They spend hours, sometimes days, sifting through logs, trying to reproduce bugs, and triangulating where a performance issue originated. This "mean time to resolution" (MTTR) is a massive hidden cost.
- How APM Helps:
A powerful APM tool transforms this process. When an error occurs, developers don’t just see a generic error message. They get a detailed trace that shows the exact file, method, and even line of code that failed. They can view the full journey of the request, including all database queries and external API calls, all connected together. What once took hours to figure out now takes only minutes.
- The Business Impact: This is a direct productivity multiplier
Calculate it: (Number of Engineers) x (Hours saved per week on debugging)
💡 Example: 10 engineers saving 5 hours/week each = 50 hours saved weekly, or 2,600 hours annually.
This reclaimed time is reinvested into building new features, improving code quality, and driving the business forward. You're not just saving money; you're accelerating time-to-market.
2. Increased Sales & Revenue
- The Challenge:
Performance is a conversion killer. A slow-loading checkout page, a failed search query, or a unresponsive dashboard directly abandons user journeys. For a SaaS business, every second of latency is a direct drag on conversion rates and Average Revenue Per User (ARPU).
- How APM Helps:
An APM tool offers Real User Monitoring (RUM), which tracks the real experience of users across different locations, devices, and networks. It helps you spot specific pages or transactions that perform poorly and improve them before they affect customers. By maintaining 99.9%+ uptime and smooth performance during peak sales periods, you safeguard every revenue opportunity.
- The Business Impact: The impact is direct and measurable
Calculate it: (Current Conversion Rate) x (Estimated % lift from performance improvements) x (Monthly Visitors)
💡 Example: A 1% lift in conversions for a business with 10,000 monthly visitors = 100 additional conversions per month.
APM directly contributes to top-line growth by removing friction from the user experience.
3. Reduced Operational Costs:
- The Challenge:
In the cloud, inefficiency is expensive. Over-provisioned resources, "noisy neighbor" problems, and inefficient database queries can cause performance issues while simultaneously inflating your AWS, Azure, or GCP bill. You're paying more for a worse outcome.
- How APM Helps:
An APM tool’s infrastructure monitoring and deep code profiling help uncover waste. You can see which database queries are the slowest and use the most resources. You can also spot underutilized containers or instances that can be resized to fit your needs better. This gives you clear, data-driven insights to optimize infrastructure costs. Enterprise SaaS management platform CloudNuro helps further by giving enterprises centralized visibility into SaaS subscriptions and unused licenses, enabling smarter spend governance and cost optimization across your SaaS stack.
- The Business Impact: This leads to significant and recurring efficiency gains.
Calculate it: (Current Monthly Cloud Resources) x (Estimated Optimization Percentage)
💡 Example: Optimizing cloud usage by 15% on a large-scale environment means fewer wasted resources every month, compounding over time.
APM helps by identifying and reducing this waste, ensuring resources are right-sized and fully utilized.
4. Better Customer Satisfaction & Retention
- The Challenge:
Customer churn is the silent assassin of SaaS ROI. Acquiring a new customer is far more expensive than retaining an existing one. Performance issues and errors are primary drivers of frustration and, ultimately, cancellation.
- How APM Helps:
By proactively monitoring and fixing issues before they affect a large portion of your user base, you demonstrate reliability and care. APM tool allows you to set up alerts based on error rates or performance degradation, enabling you to fix issues often before customers even notice them. This proactive care builds immense trust.
- The Business Impact: Improving retention has a monumental impact on Lifetime Value (LTV).
Calculate it: A common rule of thumb is that even a 5% increase in customer retention can create a major boost in long-term business performance. Reducing churn by just 1% can mean hundreds of customers retained over time, strengthening stability and predictability for SaaS growth.
5. Quantifying the Cost of Downtime
- The Challenge:
Total application downtime is a catastrophic event. But even partial degradation can be incredibly costly. The direct cost includes lost revenue, but the indirect costs such as brand damage, loss of customer trust, and engineering scramble are often far greater.
- How APM Helps:
APM is your best insurance policy against downtime. By providing a holistic view and early warning systems, it helps you prevent outages from happening in the first place. And if an incident does occur, it drastically reduces the MTTR, minimizing the blast radius.
- The Business Impact: The ROI is the cost of downtime avoided
Calculate it: (Revenue per hour) x (Hours of downtime) + (Cost of engineering firefight) + (Estimated cost of brand damage)
For even a mid-sized SaaS company, a single hour of downtime can easily cost tens of thousands of dollars.
Want to pinpoint the exact microservice causing downtime in your app?
6. Meeting & Exceeding SLA Requirements
- The Challenge:
Enterprise customers demand Service Level Agreements (SLAs) with financial penalties for non-compliance. Manually proving you've met these agreements is arduous and often disputed.
- How APM Helps:
APM tool provides irrefutable, historical data on uptime, performance, and error rates. You can generate automated SLA reports to share with clients, building trust and avoiding costly penalties. You can also use this data to confidently offer more aggressive SLAs as a competitive differentiator.
- The Business Impact:
This protects revenue (avoiding penalties) and can actually win new business by de-risking the sale for enterprise prospects.
How Atatus APM Solves SaaS Application Performance Issues?
Understanding the "why" is crucial, but the "how" is what delivers the value. Atatus is architected from the ground up to address the specific, complex needs of modern SaaS applications by providing deep, actionable insights and unparalleled visibility.
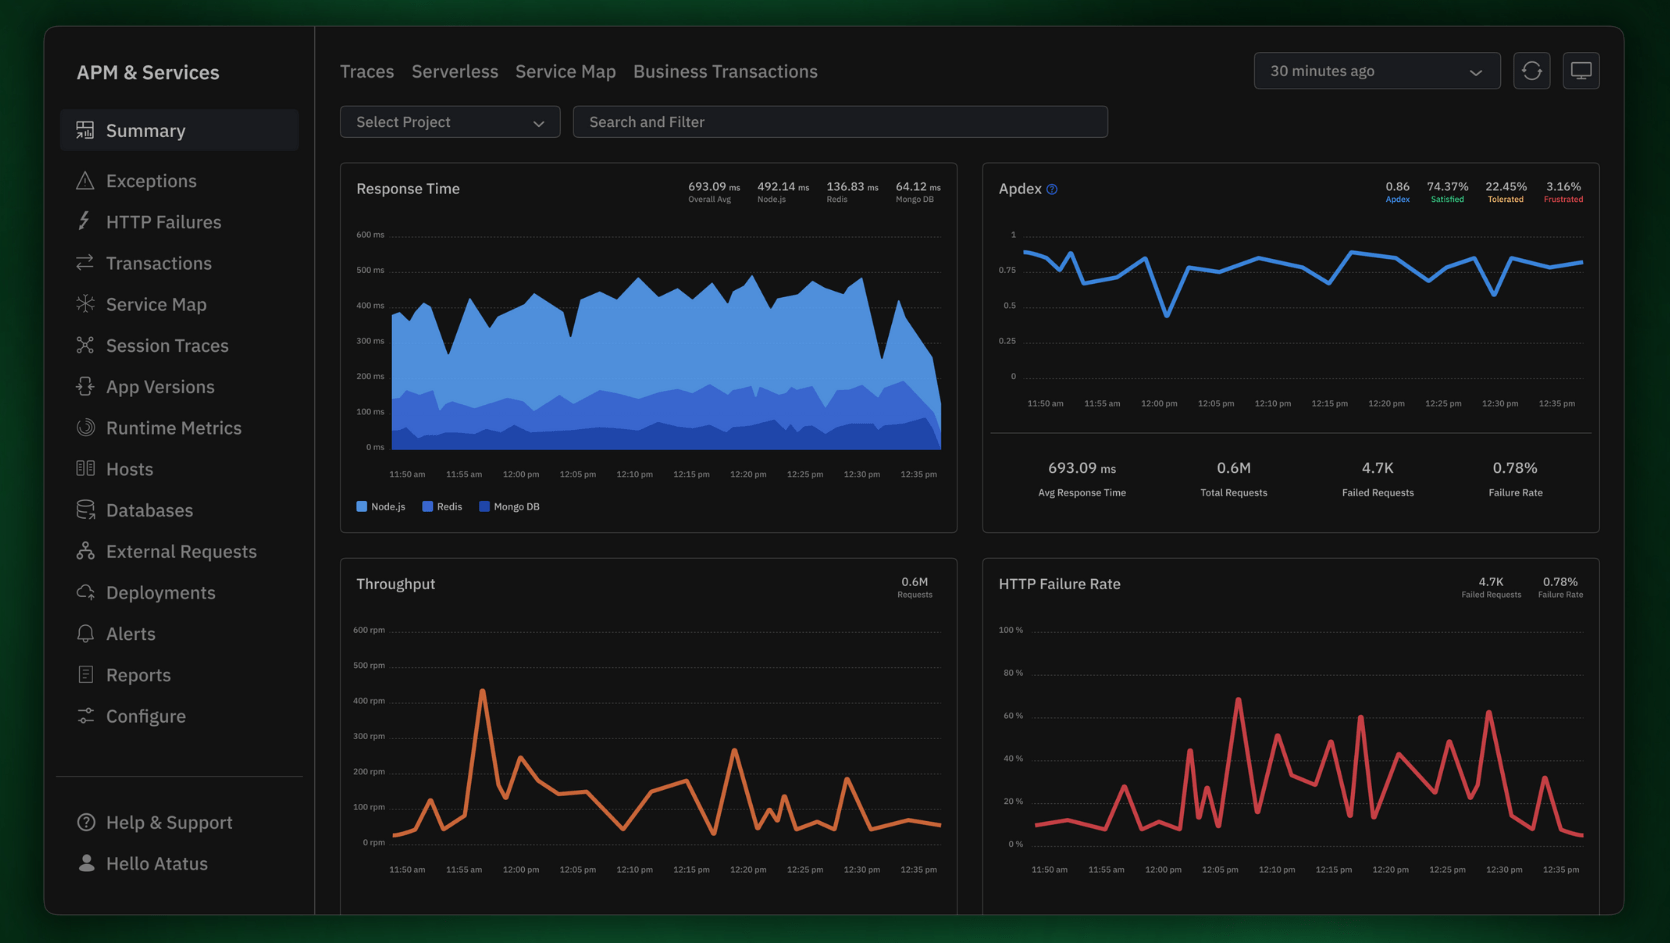
1. Full-Stack Visibility in a Single Pane of Glass
Atatus integrates Application Performance Monitoring, Infrastructure Monitoring, Real User Monitoring (RUM), and Logs into a unified platform. This correlation is transformative. A developer can start from a slow API call detected in APM, drill down to see the underlying host's CPU spike (Infrastructure), check the real-world experience for users in a specific region (RUM), and immediately surface the related error logs without switching between disparate tools. This context shaves hours off of investigative work.
2. Deep, Code-Level Distributed Tracing
Our tracing goes beyond identifying a slow service. It provides a granular, line-of-code breakdown of every transaction. You see the exact database query that's missing an index (SELECT * FROM large_table), the specific third-party API call that's timing out, or the inefficient function within a microservice. This precision eliminates the guessing game and provides developers with the exact context they need to fix issues, not just find them.
3. Proactive Alerting and Intelligent Anomaly Detection
Atatus allows you to move from a reactive to a proactive stance. You can configure precise alerts based on thresholds for error rates, response times, and Apdex scores. More importantly, our platform analyzes historical data to establish performance baselines, helping you spot anomalies and emerging trends before they escalate into user-impacting incidents. This enables you to address performance degradation before it affects customers.
4. Unfiltered Insight into the End-User Experience
Our Real User Monitoring (RUM) captures the true experience of every user. It goes beyond metrics, allowing you to see session replays, user interactions, and JavaScript errors exactly as they occurred in the browser. This turns abstract performance data into actionable product and customer experience insights, helping you understand not just if your app is slow, but where and why users are encountering friction.
5. Built for the Scale and Security Demands of SaaS
We understand that your platform is critical. The Atatus agent is engineered for minimal overhead, ensuring monitoring doesn't become a performance issue itself. Our backend is built on a secure, highly scalable architecture that can handle your largest traffic volumes. With SOC 2 compliance, we ensure your application performance data is handled with the utmost security and integrity.
For a SaaS business, choosing Atatus isn't just choosing a monitoring tool; it's choosing a strategic partner dedicated to maximizing your application's reliability, your team's productivity, and your company's profitability through clear, precise, and actionable observability.
Conclusion
Application performance affects every part of a SaaS business from developer efficiency to customer satisfaction and revenue. APM tools provide the insights needed to quickly find and fix issues, improve user experience, and reduce costs.
Atatus delivers powerful, SaaS-focused monitoring that helps teams resolve problems faster and keep applications running smoothly. This leads to real, measurable business benefits.
Ready to Resolve SaaS Performance Issues Today?
Don’t let hidden issues slow down your business growth. Sign up now and fix issues before they impact your SaaS business.
Start Free TrialFAQs about Atatus APM for SaaS Applications
What specific SaaS challenges does Atatus address?
- Complexity of microservices and distributed systems
- Lack of full-stack visibility across applications and infrastructure
- Slow detection and resolution of performance bottlenecks
- Limited insights into real user experience
- Difficulty meeting uptime and SLA goals
- Need to connect technical issues with business impact
How difficult is it to integrate Atatus into our existing SaaS application?
Atatus is designed for easy setup with minimal code changes. It supports many frameworks and languages commonly used by SaaS teams. For personalized integration guidance and timelines, it’s best to talk to our sales team.
Can Atatus scale with growing SaaS architectures?
Yes. Atatus scales with your SaaS business effortlessly, handling growth in users, microservices, and infrastructure without losing performance or visibility.
We have a complex microservices architecture. Can Atatus handle distributed tracing effectively?
Yes. Atatus provides automatic, detailed distributed tracing across all microservices, databases, and APIs, making it easier to spot and resolve performance issues anywhere in your system.
How does Atatus help us prove our ROI to management?
Atatus provides easy-to-understand dashboards and reports that connect uptime, response times, error rates, and user experience metrics to business outcomes such as retention and revenue. With this information, you can demonstrate the actual return on investment to stakeholders.
#1 Solution for Logs, Traces & Metrics
![]() APM
APM
![]() Kubernetes
Kubernetes
![]() Logs
Logs
![]() Synthetics
Synthetics
![]() RUM
RUM
![]() Serverless
Serverless
![]() Security
Security
![]() More
More