11 Top Website Uptime Monitoring Tools to Know in 2025
Uptime is the time period when your website and all of its contents are fully functional and accessible. It is expressed as a percentage, thus if your web is up 99% of the time, you can expect more than 7 hours of downtime every month.
Downtime, as the name suggests, is when all or a portion of your service is unavailable. Disruptions result and potential customers are lost. Uptime monitors are useful for correctly logging, assessing, and informing on each downtime.
Additionally, a Google study found that even a one-second delay in your website loading time might reduce conversions by 20%.
Fortunately, there are numerous methods available for monitoring uptime, ranging from open-source to closed-source, low-cost to high-end, and pretty much anything in between. This post will cover some of the top website uptime monitoring tools to help you get started.
We will go over the following:
- Atatus
- Uptrends
- Pingdom
- Sematext
- Uptime.com
- Better Uptime
- StatusCake
- Dotcom-Monitor
- Site24x7
- Datadog
- Uptime Robot
#1 Atatus
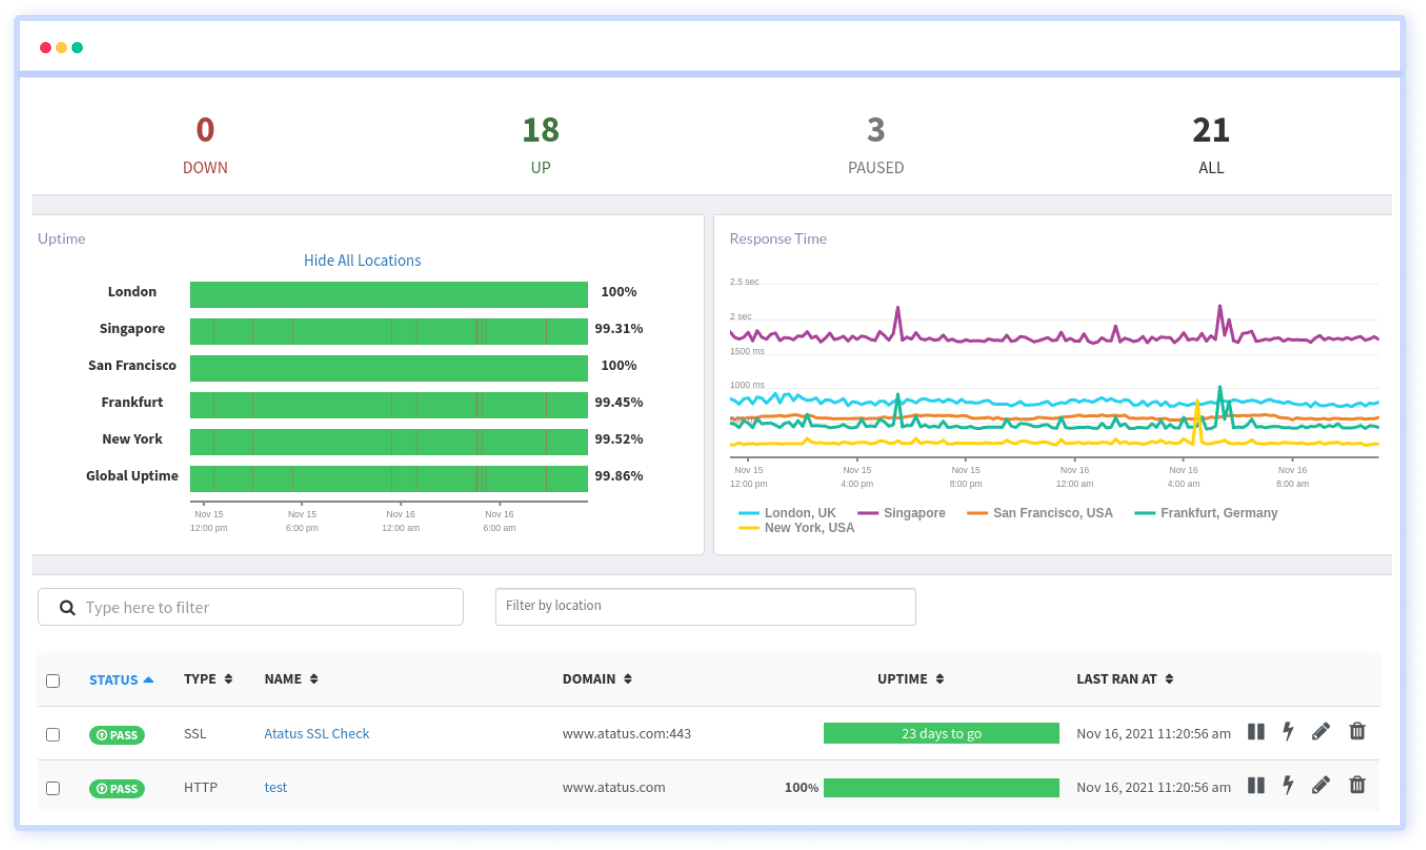
Atatus Uptime Monitoring simulates user interaction to check the availability of your website or application. It analyzes the speed and functionality of your application and provides accurate and useful insights in a simple interface.
You can achieve high performance by using Atatus to test the functionality of your website and locate any potential performance bottlenecks in your application.
Atatus multistep API test enables you to examine all of your application's API endpoints and finds any potential performance problems. At any phase or scenario, you can add new variables, retrieve variables that have already been stored, and use data that has already been collected.
You can perform various tests using various browsers worldwide and at the specified location using Atatus Uptime Monitoring. At the real browser levels, you can evaluate the genuine end-user experience of your website or application.
You can simply ensure the performance, functionality, and availability of your website or application by simulating traffic in a particular location. You can test the functionality of your application before your end-user runs into it and before releasing your product in a new location.
To inform your team of the critical errors, Atatus defines alert conditions depending on the retry count (number of retries to be performed when a failure happens) and the number of locations to be failed. You can receive notifications from your favorite channels, including Slack, Teams, VictorOps, OpsGenie, and a lot more.
The Atatus Uptime Monitoring is a tool that you should try out because of its affordable price, which starts at just $1.5 per month for 10K check runs. We also provide a 14-day unlimited free trial with no credit card required policy.
Features:
- Advanced search filtering
- Customize the frequency of check runs
- Deployment tracking
- Email support
- HTTP, TCP, SSL, DNS, and ICMP checks
- Multiple geo locations checks
- MultiStep API checks
- Real-time alerts & summaries
#2 Uptrends
Uptrends provides a simple way to keep track of the uptime, performance, and accuracy of your websites and APIs while running tests from 226 checkpoints worldwide. It is a member of the ITRS group and offers many solutions, such as Synthetics and Real User Monitoring (RUM).
Their website performance monitoring tools let you keep an eye on your website and pinpoint the problem if there are any speed-related problems. The proper operation of multi-step transactions is ensured by web application monitoring.
All of the data is displayed in interactive charts that allow you to zoom in on particular features or filter by date and time for a more detailed analysis of your data and perhaps the discovery of trends in your performance over time.
Several complimentary tools are available from Uptrends, such as uptime check, website speed test, traceroute, DNS report, and CDN performance check.
You'll receive a notification anytime there is a problem with your availability, and Uptrends also provides a public status page that you can personalize with your logo and color scheme to tell your users.
Three simple plans, starting at $17/month, give you 10 monitors, RUM and synthetics, uptime monitoring, status pages, SMS, email, push alerts, and status pages. Uptrends is available for a free 30-day trial.
Features:
- Easy to set up
- Favorable customer service
- Multi-location support
- Personal and team dashboard views
- Private checkpoints
- Simple onboarding
- Straightforward authentication
#3 Pingdom
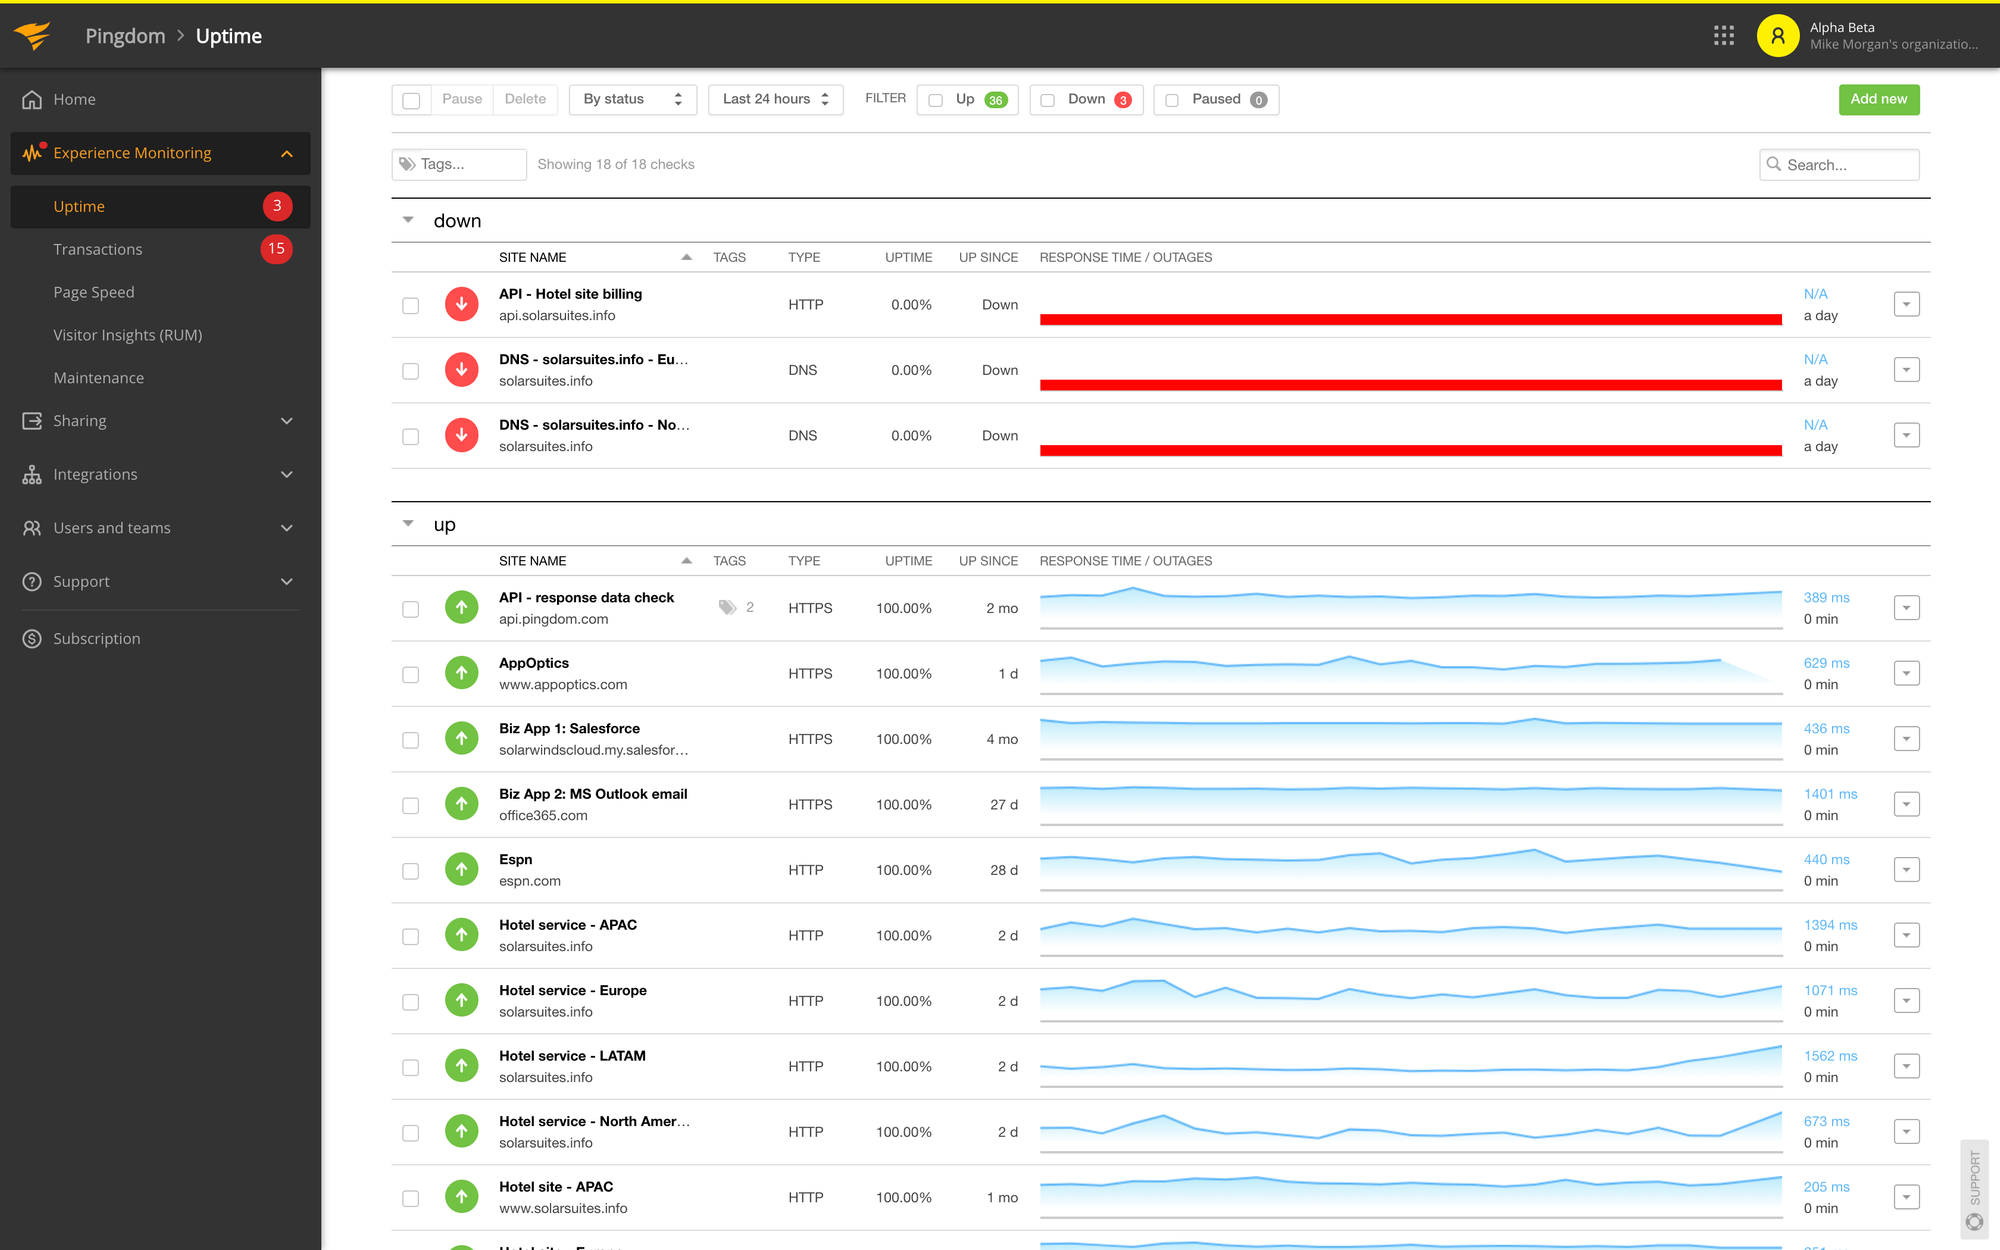
Pingdom is a well-known uptime monitoring tool that has been in existence for a long time. It enables users to keep an eye on their website from more than 100 locations across the globe and receive notifications the moment it stops functioning.
Pingdom provides its users with a simple status page that can be personalized with personal branding and can only show relevant checks. The Pingdom status pages can be set up in just 10 seconds and are free for all of their customers.
Setting up this uptime monitor to check on the functioning of your system requires relatively little labor because it is based on external servers. The service will continuously monitor your network and log alerts when performance standards are not met.
These notifications are displayed in the tool's dashboard, but you can also opt to get them through SMS, email, or a web API. This implies that performance issues can be discovered without you having to sit and watch the console.
This service is focused on remotely monitoring the accessibility of websites and other web services that your business might offer. The tool will dig further and look into the root causes of your issues in addition to identifying performance issues.
Plans from Pingdom start at $15/month and include 10 uptime monitors, 1 advanced monitor, and 50 SMS credits for notifications. You can also benefit from their 30-day free trial before deciding.
Features:
- Downtime alerts
- No software installation is required
- Page speed statistics
- Stored test results
- Tests from 100 locations
#4 Sematext
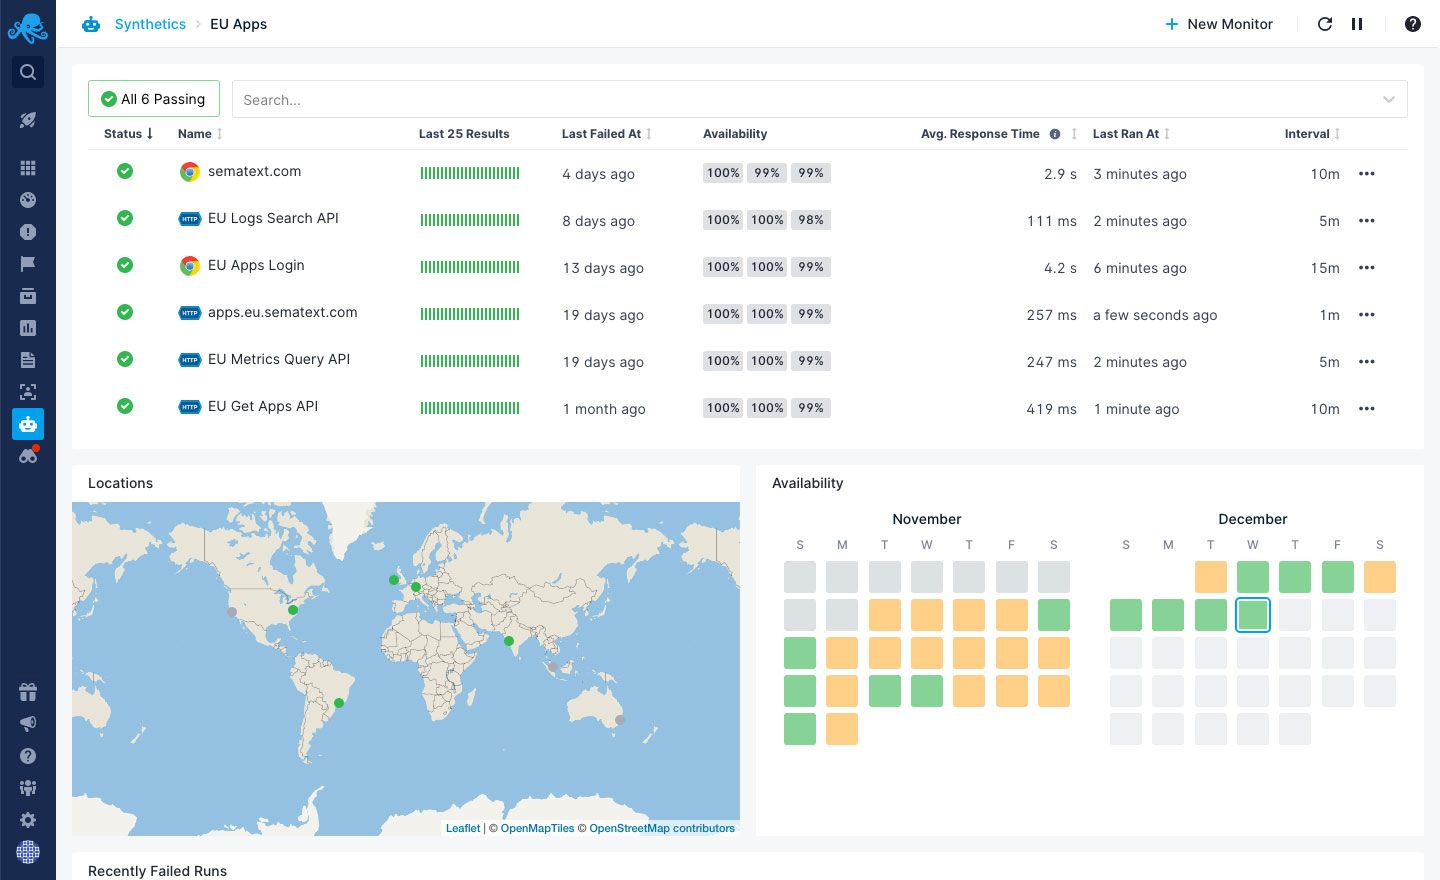
Sematext Synthetics is a powerful website uptime monitoring tool that enables you to track resources from various locations, track network timings across all layers, monitor APIs, and keep tabs on private networks that are protected by firewalls.
This service for synthetic modeling can complete full iterations of the path taken by the majority of website visitors. This is very helpful when adding new features to an existing website or while developing a new website before it is published.
Checking whether a website is accessible is another use for the Synthetics service. These uptime monitors can be used in combination with other tests, including load testing and API status checks.
Regular tests can be run from servers positioned in a variety of geographical areas all around the world. The user can also decide whether to conduct HTTP tests or browser-based testing.
Although every run is recorded and summarized in graphs that are accessible from the system dashboard, the problems are probably what system administrators are most interested in. The Sematext testing will continue, possibly without the tech team that oversees the website's interest.
If the monitored website is unavailable, the service issues an alert. This allows the technical staff to focus on other tasks and simply switch to the web server in the event of unanticipated downtime.
Sematext plan starts at just $2/month with the Pay-as-you-go plan and its 14-day trial requires no commitment.
Features:
- Custom integrations with different apps
- Helpful customer support team
- Immediate UI
- Incident investigation
- Possible customization
- S3 archiving is possible
- Self-improving tool
- Simple setup
#5 Uptime.com
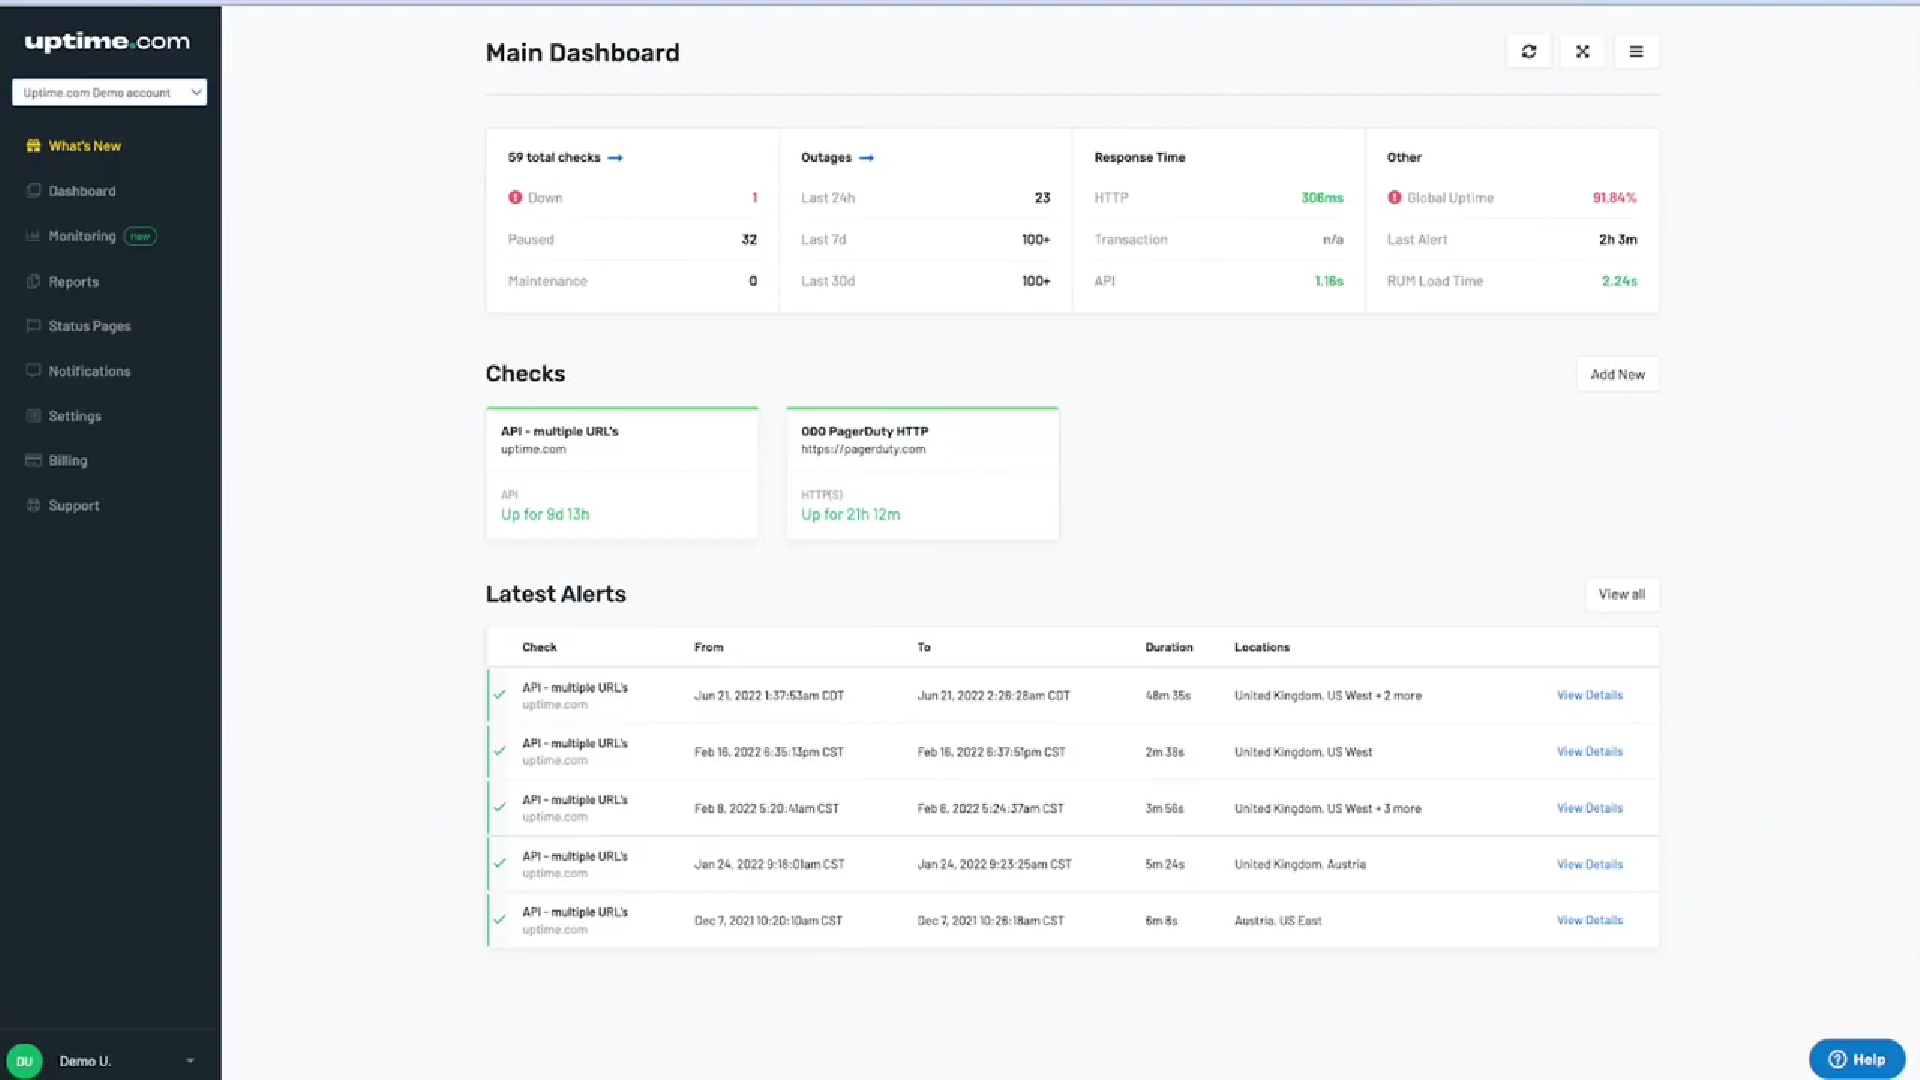
Uptime.com is a web-based service that provides consistent uptime tests in addition to synthetic monitoring and real-user monitoring systems. A total of 15 testing locations throughout the world are available for delivery of the package.
The Uptime system automatically records every test it runs, and it displays completion reports in the system dashboard. These reports are also stored on the Uptime cloud servers. Time-series graphs are used to summarize reports and let you understand how quickly your Web assets are still available.
The Premium plan appeals to managed service providers (MSPs) since it allows for the management of tests on client accounts through multi-tenant architecture.
Uptime.com provides trouble alerts that can be relayed as SMS and voice call notifications. Alerts can also be channeled through team collaboration tools like Microsoft Teams and Slack.
Uptime.com should not be confused with a UptimeRobot. This tool allows you to check your website, server, and APIs. They offer a variety of services, such as server monitoring, real user monitoring, server monitoring with real users, and synthetic monitoring.
You can do 1-minute interval checks using Uptime from 30 different locations. With their basic plans, which cost $16 a month, you also get 60 monthly SMS credits and 10 checks.
Features:
- Alerts for issues
- Automated uptime checking cycle
- Choice of 15 test launch locations
- Data retention in cloud storage
- Extensive synthetic testing and real user monitoring
- Integrations with third-party systems
- Testing integration into CI/CD pipelines
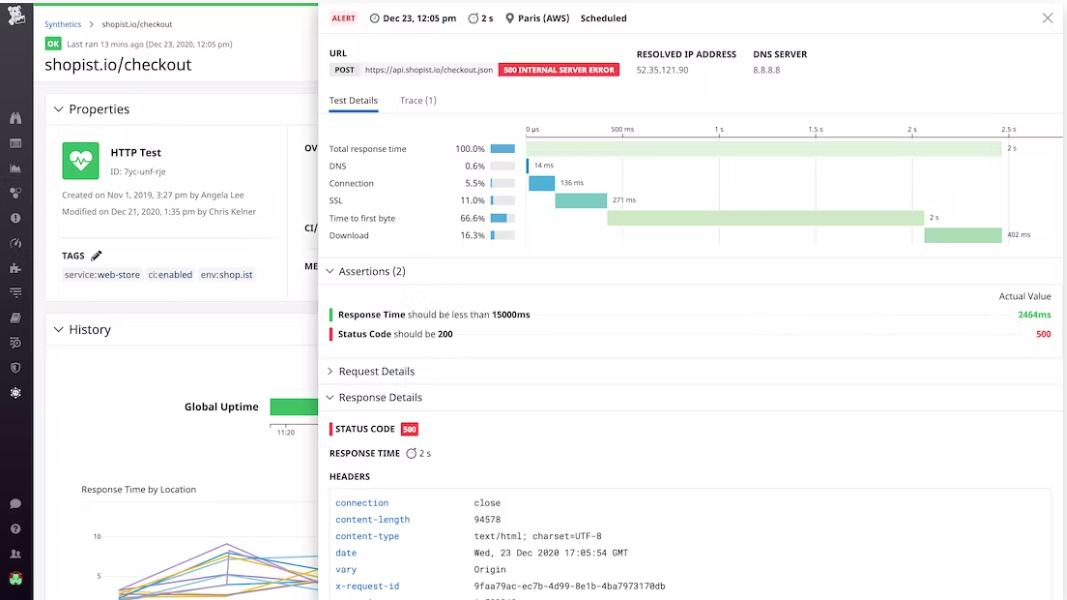
#6 Better Uptime
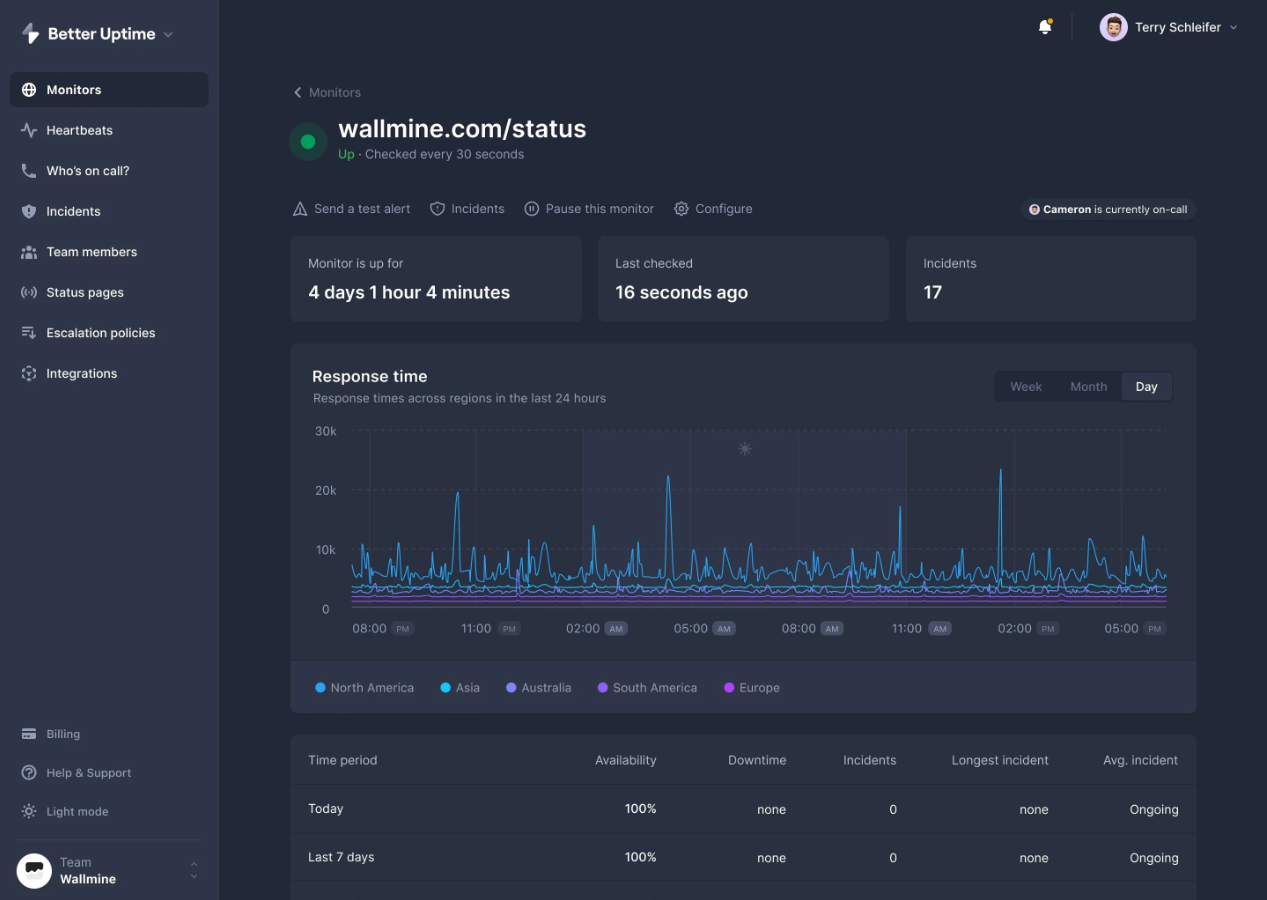
Better Uptime is a website availability monitor that regularly examines a site's uptime from five different locations. Ping tests and Web browser tests can both be run. You can choose between Google Chrome, Mozilla Firefox, and Apple Safari to perform your tests.
Not all of this system is automated. The testing system is manned by human operators as part of a managed service. Before telling the client if a target is down, the system retests it from two more locations.
This process is included in the service to avoid false-positive reporting and reduce the number of notifications that the client gets that might be the result of a problem with the Internet connection being utilized for the test.
Every test is recorded, and the user dashboard includes a list of every availability check. A color-coded bar on the console also displays the test results in order.
Screenshots of the failure notice that appears in a browser are used to document unsuccessful contact events. When a test fails, subscribers are notified. These alerts can be sent via Slack message, SMS, email, or phone call. The client can get in touch with the service's operators at any time.
The tests look at more than just whether Web pages are accessible. The user can specify tests to determine whether APIs and services that are triggered within website pages are accessible.
Better Uptime provides simple pricing that includes a free tier that offers free email alerts, 3-minute checks, and 10 monitors. With their pro services, which start at $30 per month, you can get unlimited phone calls, 50 monitors, and 30-second checks.
Features:
- Easy UI
- Fast customer support
- Free domain
- Gives status pages as well
- Intuitive setup
- Slack or SMS notifications
- Straightforward to use enough
- Very customizable tool
#7 StatusCake
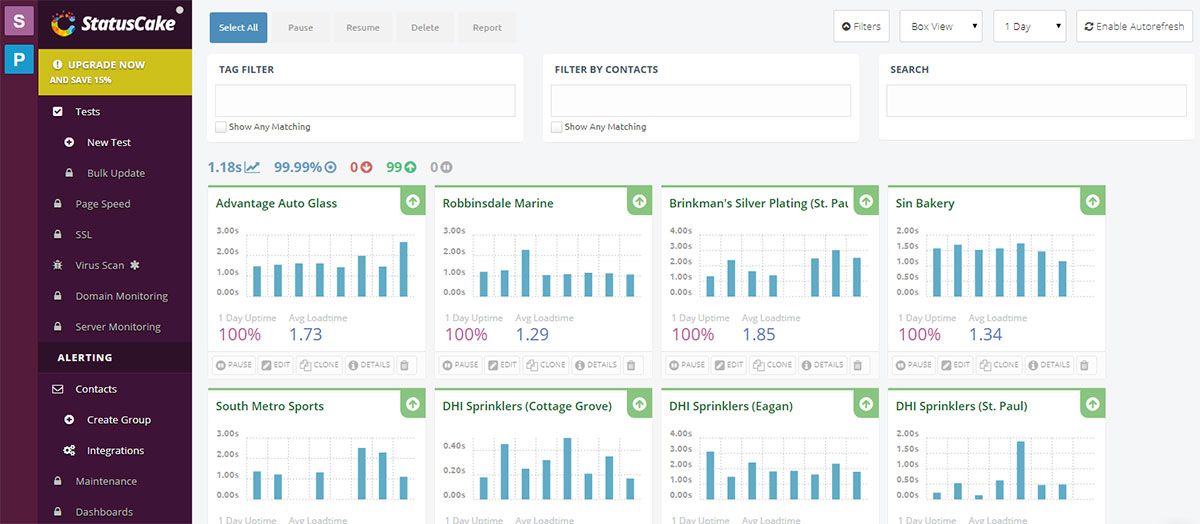
StatusCake is an uptime monitoring platform and public status pages. With their free subscription, you can automatically test the uptime of your website from 30 different countries every five minutes.
HTTP, HEAD, TCP, DNS, SMTP, SSH, PING, and PUSH are all monitored by StatusCake. You can also monitor your Page Speed, Domain, Servers, and SSL certifications in addition to that.
You can compare your website's uptime results and performance using StatusCake's historical uptime monitoring reports, which are available for up to a month old.
You can use one of their 14 integrations, which include Datadog, Discord, OpsGenie, Pushover, Slack, and more, to get notified right away if there is ever a problem.
With StatusCake, you can set up between 10 and 300 monitors. Its monitoring system is made up of five data points. The uptime and page performance monitoring tools are the most crucial.
A report describing performance issues with your website and what you can do to fix them will also be produced by the page speed test.
Additionally, the service will keep an eye on your server to spot any issues that can cause downtime and notify you when your domain and SSL certificate is set to expire.
With StatusCake, you can use 10 monitors at 5-minute intervals for free, and 100 monitors at 1-minute intervals are included in their premium subscriptions, which start at $24.49 per month.
Features:
- 30 seconds monitoring frequency
- Alerts through integrations
- Domain Monitors
- Historical uptime data
- Page speed monitoring
- Reporting
- Server monitors
- SSL monitors
- Team tools
- Uptime monitors
#8 Dotcom-Monitor
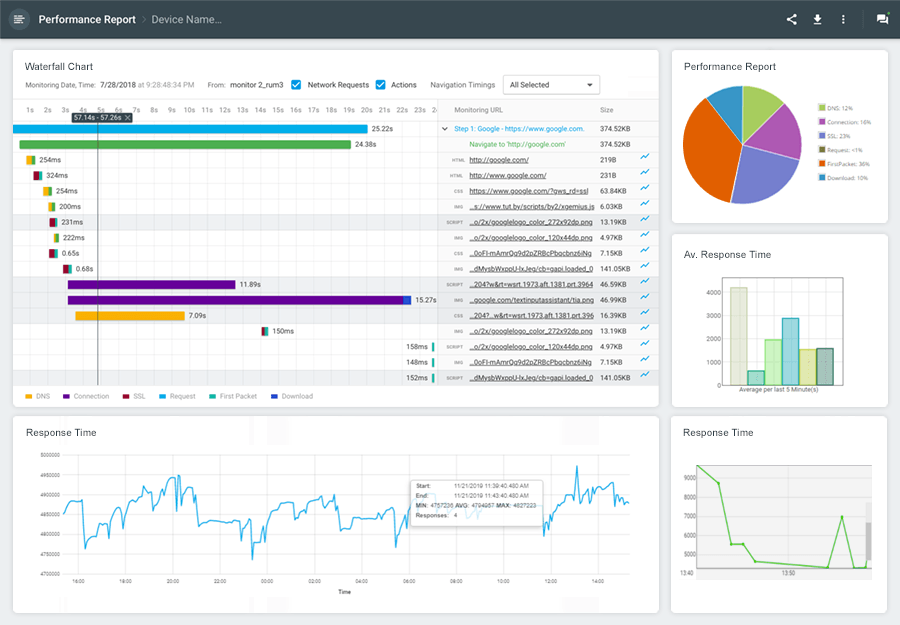
Dotcom-Monitor uses its cloud platform to offer several availability checks. Web Services Monitoring is the uptime availability plan offered by Dotcom-Monitor. This is one of the platform's four available plans.
The Web Services Monitoring plan primarily acts as an uptime monitor by repeatedly checking the availability of internet-based assets using the Ping protocol. The tests are conducted for HTTP and HTTPS availability; these are common techniques for verifying a website's availability.
Other experiments examine how SOAP and RESTful APIs function. Even though the pages they are on appear to still be available, if one of these activities fails, your website's main utilities may stop functioning.
A pop-up ad stopping functioning or the shopping cart not operating are two examples of faults brought on by API failure. This system can also test Web services that are XML- and JSON-based.
Your SSL certificate could have issues that you are unaware of. The fact that Google Chrome will prevent your website's pages from loading if the certificate has issues is a major drawback with SSL services. Therefore, doing routine automated checks on the SSL certificate is a crucial responsibility.
They offer 1 to 5-minute intervals, staggering 3-year data retention, SSL monitoring, API monitoring, and more with their services, which start at $19.95. Every plan offers a free 30-day trial, allowing you to try out all of its features before making a purchase.
Features:
- 30 locations
- Alert to SLA breaches
- API tests
- Great alert templates, highly customizable
- Monitor page load speeds
- Monitorings website traffic
- Website availability tests
#9 Site24x7
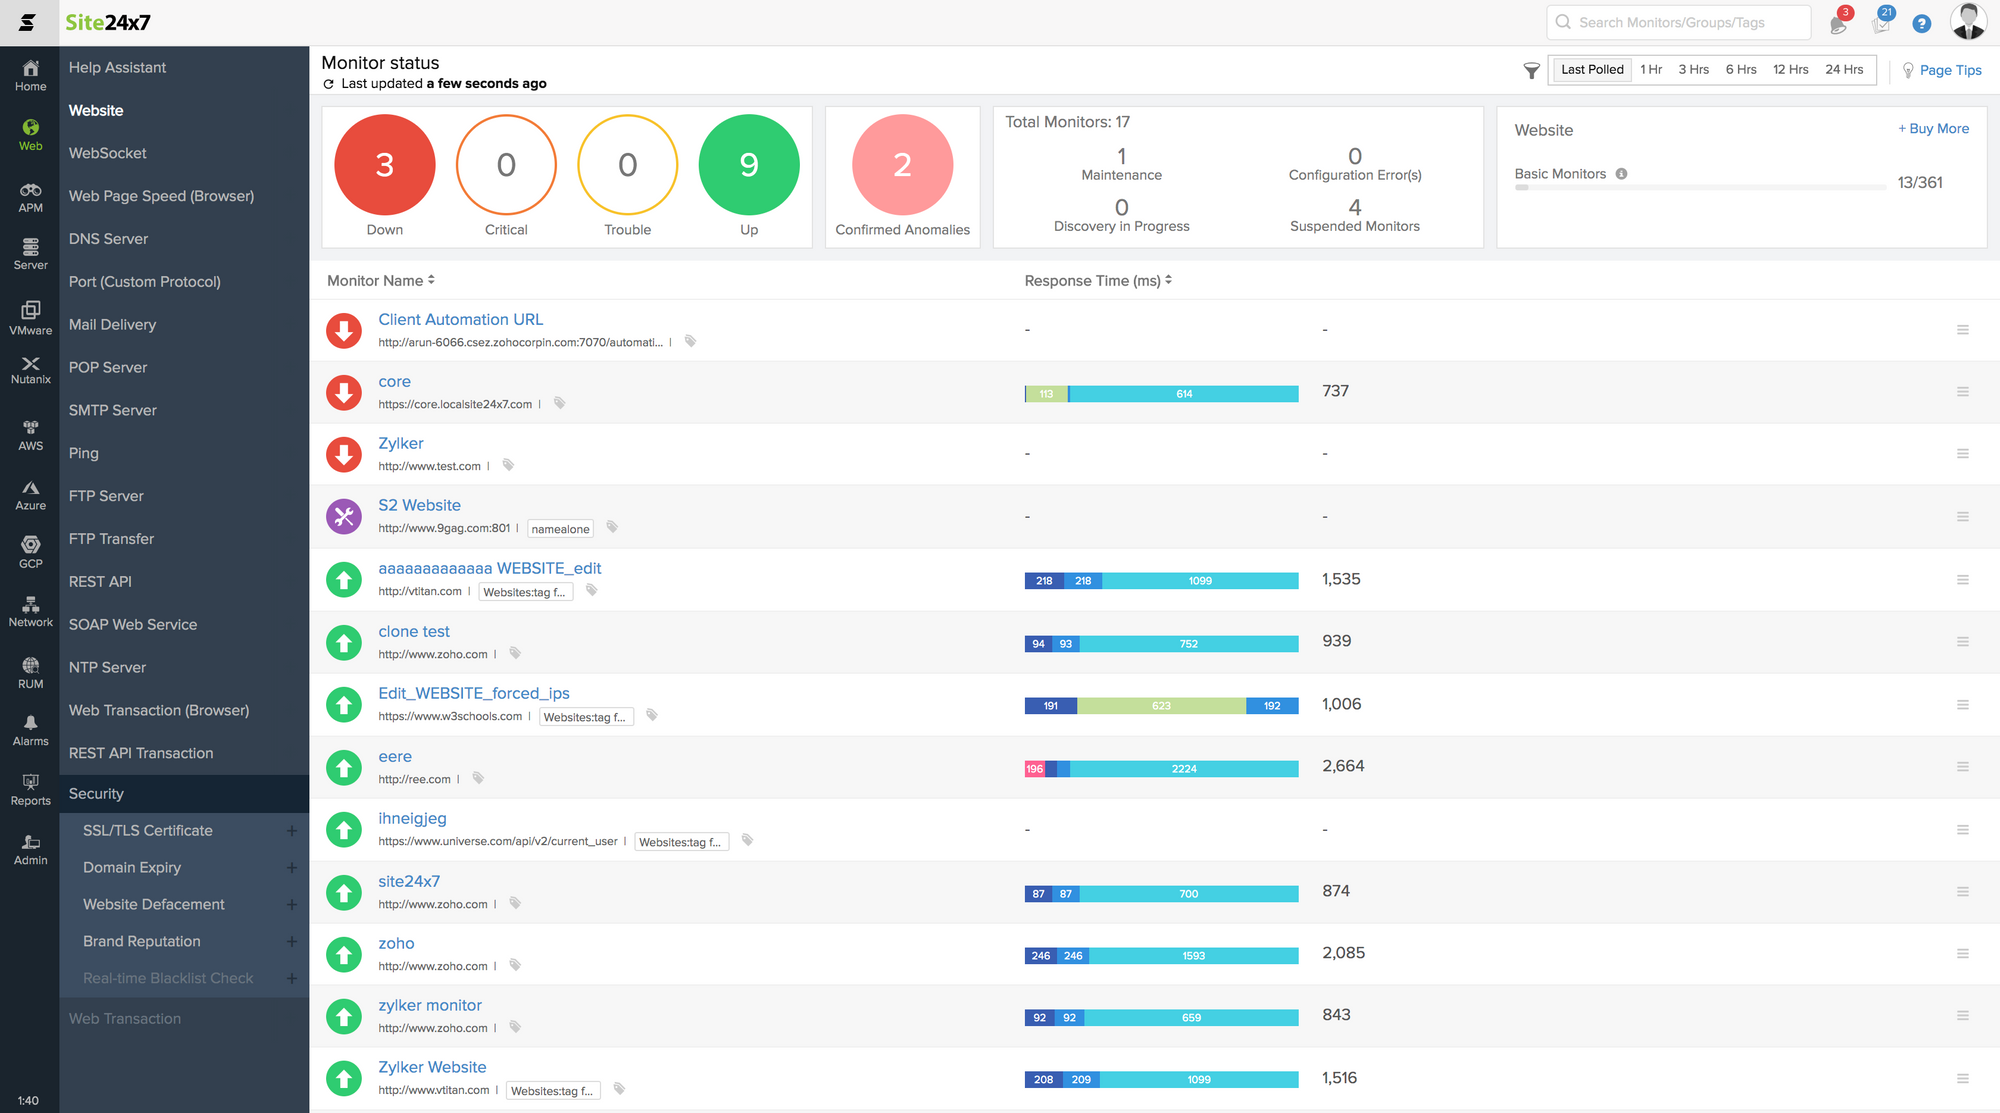
Site24x7 provides complete website IT support, enabling it to assist web entrepreneurs in maintaining the availability of their websites. Customers' websites from 90 different countries are routinely checked by the cloud service.
These tests not only identify downed websites but also those that are unavailable globally. It's possible that the regional outage was brought on by national government activities or poor internet performance.
Websites are the top of a stack of services, and if one of those layers fails, the website will also fail. Therefore, it is not sufficient to know that a website has crashed; website owners also need to ascertain the cause as soon as possible.
System administrators can prevent outages by using Site24x7 to locate stressed-out hardware and software. Systems administrators can reallocate resources to prevent disaster by spotting status issues on the network, server, and in-application performance.
If there are no indicators of a potential outage, the Site24x7 inspection can determine which internet service malfunctioned.
Among other automated monitoring tools, these checks include a Domain Expiry Monitor, SSL/TLS Certificate Monitor, Ping Monitor, and Web Transaction Monitor.
Site24x7 has simple pricing that starts at $9 per month, which includes 10 website or server monitors, 3 status pages, 500mb logs, and other features. Additionally, they offer a 30-day trial period without requesting a credit card.
Features:
- Customizable notification options
- Easy to deploy
- Fairly low charge
- Helpful customer support
- Immediate alert during the unstable service
- Robust tool
- Straightforward to use
#10 Datadog
Datadog Synthetics keeps track of the uptime of your websites and applications and notifies you as soon as performance worsens or the service is discontinued. You can set up monitoring such that it operates from both your private locations and their various places all over the world.
The uptime monitors perform checks using a browser or an API. For each scenario, a monthly subscription fee will be charged in increments of 1,000 access attempts for browser access and 10,000 for API access.
The browser tests are more thorough and provide more information. They also provide screenshots of unsuccessful access attempts.
Each test run for both approaches is logged and timestamped. Additionally, the website manager can design unique tests and repeatedly run them through the remote Datadog test agents.
The uptime monitors track response times in addition to verifying a site's availability and each of its pages. The test results are available to the site manager in a dashboard with excellent visuals.
Failures or poor responses exceed performance standards and cause alerts to be sent. Through a machine learning process that takes into consideration elements like the dependability of the internet connection, the threshold levels are modified.
Datadog Synthetics plan starts at $7 for every 10k tests run every month. You also have complete control over the frequency of your tests, the ability to track SLAs and SLOs, uptime, and latency. They provide a 14-day free trial so that you can take a look around before making a decision.
Features:
- Better observability in metrics
- Excellent notifications
- Following logins in real time
- Many integrations
- Monitoring AWS resources
- Opportunity to create a customizable dashboard
- Straightforward dashboard
- Tagging data
- Tracking users’ flow
#11 Uptime Robot
UptimeRobot provides an uptime monitoring solution with response time monitoring, ping monitoring, and port monitoring, among many others. You can start using it right away because it is a seamless tool, which makes it easy to get used to.
It must not be mixed up with uptime. Even though they are completely separate services, they do share other characteristics outside only the same name, such as nearly the same pricing.
Advanced capabilities include semi-customizable status pages, response times monitoring, maintenance windows, and custom HTTP queries. Incident updates are distributed via email to Status page subscribers.
With UptimeRobot, you can check on your endpoints as frequently as every 60 seconds from various locations, or every 5 minutes with the free subscription. Depending on your plan, checks are performed every five or one minute.
While SMS and voice messages are accessible in the premium version, alerts are sent via email on the free plan. Even maintenance windows can be established to stop warnings during planned downtime.
With UptimeRobot, you can set up 50 monitors as part of their generous free, forever plan. Despite being advertised at $15/month, premium plans start at $18/month or $180/year.
Features:
- 5-minute interval check
- Fair pricing for the most
- Flexible service
- Free and useful integrations
- Lots of configurations and setting options
- Possible usage in different locations
- Status page option
- Successful app design
Finally!!!
Our list of the top software and tools for uptime monitoring is now complete. Although choosing an uptime monitoring solution is not very challenging, you must first sit down and consider your goals.
The use of uptime monitoring tools will be quite beneficial. You'll be able to save a ton of time, money, effort, and other resources.
As a result, the future of your website can be decided with the help of uptime monitoring tools, allowing you to quickly learn what is happening.
Monitor Your Entire Application with Atatus
Atatus Observability Platform lets you review problems as if they happened in your application. Instead of guessing why errors happen or asking users for screenshots and log dumps, Atatus lets you replay the session to quickly understand what went wrong.
We offer Application Performance Monitoring, Real User Monitoring, Serverless Monitoring, Logs Monitoring, Synthetic Monitoring, Uptime Monitoring, and API Analytics. It works perfectly with any application, regardless of framework, and has plugins.

Atatus can be beneficial to your business, which provides a comprehensive view of your application, including how it works, where performance bottlenecks exist, which users are most impacted, and which errors break your code for your frontend, backend, and infrastructure.
If you are not yet an Atatus customer, you can sign up for a 14-day free trial.
#1 Solution for Logs, Traces & Metrics
![]() APM
APM
![]() Kubernetes
Kubernetes
![]() Logs
Logs
![]() Synthetics
Synthetics
![]() RUM
RUM
![]() Serverless
Serverless
![]() Security
Security
![]() More
More