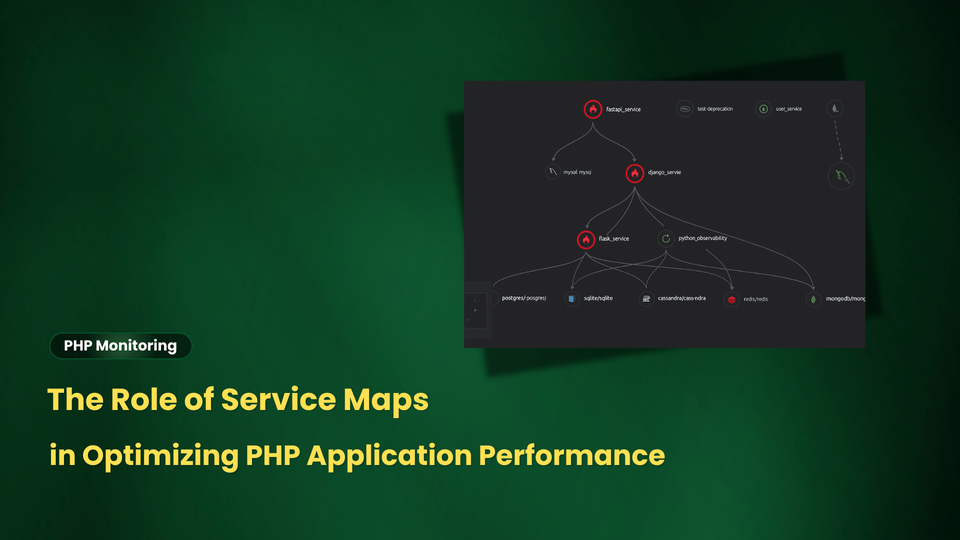
How Service Maps Improve PHP Application Performance in 2026?
Modern PHP applications rarely exist in isolation. They run across distributed environments, connect to MySQL or PostgreSQL databases, interact with Redis or Memcached, rely on APIs, and communicate with microservices. This interconnected web brings power but also enormous complexity.
When performance issues arise, finding the root cause can feel like searching for a needle in a haystack. Is it the database? A caching layer? A failing third-party API?
This is where service maps prove essential. They provide a clear visualization of how services interact, making bottlenecks, dependencies, and failures instantly visible. For PHP applications, service maps are critical to boosting performance, ensuring reliability, and accelerating incident resolution.
What’s in this guide?
- What is a Service Map in PHP Monitoring?
- Why PHP Applications Need Service Maps for Performance Optimization?
- Core Features of Service Maps
- The Challenges Without Service Maps
- How Service Maps Optimize PHP Performance?
- Best Practices to Get Real Value Quickly
- Introducing End-to-End Service Mapping with Atatus
- How Atatus Builds the Service Map?
- Wrapping Up
- FAQs on Atatus PHP Service Maps
What is a Service Map in PHP Monitoring?
A service map is a real-time, interactive diagram that illustrates all services in your environment and how they communicate. In PHP applications, these might include:
- PHP application servers
- MySQL/PostgreSQL databases
- Redis or Memcached caches
- Message brokers like RabbitMQ
- Third-party APIs
Each service is represented as a node, with connections showing dependencies and communication flows. Metrics like response times, error rates, and throughput can be overlaid for quick analysis.
Why PHP Applications Need Service Maps for Performance Optimization?
PHP is still the backbone of countless web applications. But modern systems are no longer simple monoliths, they’re distributed, dynamic and dependent on multiple moving parts.
Consider this:
- A single PHP request may pass through a cache, a database, and a payment API before returning a response.
- If any one of these services slows down, the user experience suffers.
- Failures can cascade, making root cause analysis difficult.
👉 Want to see how this looks in practice?
Try Atatus Service Maps and get real-time visibility into your PHP stack.
Get StartedWithout visibility into service-to-service dependencies, teams are left guessing. Service maps solve this by showing exactly how your PHP application behaves as a living system, not just through isolated metrics.
Core Features of Service Maps
Service maps are not just pretty diagrams. They come with actionable features that help DevOps teams, engineers, and developers identify problems and improve performance.
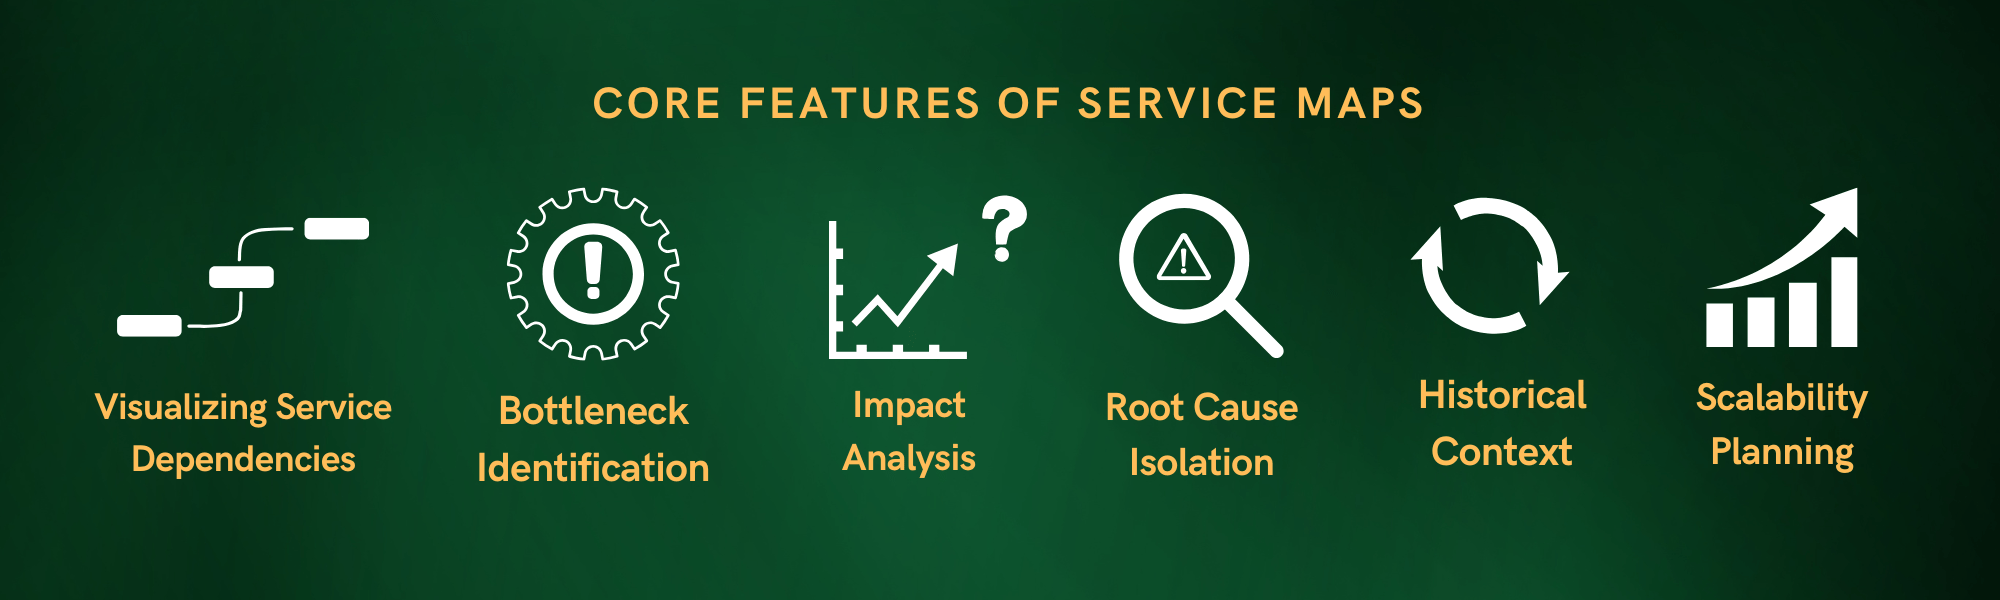
1. Visualizing Service Dependencies
In distributed PHP environments, applications interact with multiple services in real time. A service map provides instant visibility into these relationships, helping teams see the full request journey. You can:
- Understand which services directly depend on PHP application servers.
- Detect whether slow queries in MySQL/PostgreSQL are causing delays in PHP response times.
- Spot unhealthy downstream services (e.g., failing cache nodes) before they escalate into larger outages.
- See the chain of dependencies in one glance, instead of manually correlating logs or metrics.
2. Bottleneck Identification
Every second, PHP apps rely on databases, caches, APIs, and message queues. Service maps reveal exactly where slowdowns are happening. For example:
- Check if Redis or Memcached latency is causing sluggish PHP responses.
- Detect whether a third-party API integration is dragging down end-user performance.
- Identify retry storms in RabbitMQ or Kafka that increase processing delays.
- Pinpoint bottlenecks across multiple services instead of blaming the PHP layer by default.
3. Impact Analysis
Not every issue has the same impact on end-users. Service maps allow teams to visualize the blast radius of failures and prioritize fixes accordingly:
- Distinguish between background worker failures (low user impact) vs. core database downtime (critical impact).
- See how latency in one service cascades to other dependent services.
- Understand whether an outage is isolated or spreading across the entire PHP stack.
- Focus engineering efforts where they matter most for user experience.
4. Root Cause Isolation
When performance issues hit, teams often chase symptoms across logs, metrics, and dashboards. Service maps cut through the noise by showing the true origin:
- Trace a slow PHP endpoint back to a specific database query or unoptimized cache.
- Spot when multiple services fail due to one problematic third-party API.
- Identify whether bottlenecks are at the network layer, application logic, or downstream dependency.
- Reduce mean time to resolution (MTTR) by highlighting causes instead of just effects.
5. Historical Context
Performance issues often repeat themselves in patterns. With service maps that support history or replay, teams gain valuable hindsight during investigations:
- Compare system behavior before, during, and after an incident.
- Spot recurring patterns such as peak-time API failures or periodic database slowdowns.
- Analyze how fixes impacted system health over time.
- Build a Knowledge Base Software repository of incident insights to improve future responses.
6. Scalability Planning
Scaling PHP applications is tricky without a clear view of traffic flows. Service maps provide the insights needed to plan growth effectively:
- See which services handle the most load and may need additional scaling.
- Offload expensive PHP operations to queues for smoother performance.
- Adjust database and cache capacity to align with PHP request patterns.
- Optimize infrastructure spending by scaling only what’s necessary.
The Challenges Without Service Maps
Without service maps, teams rely on fragmented monitoring approaches that only tell part of the story. Here’s how the challenges look and how service maps with an PHP APM tool solve them:
How Service Maps Optimize PHP Performance?
- Faster troubleshooting
Instead of guessing where an issue is happening, you can visually follow a request through multiple services and pinpoint the failing component. - Understand the impact of failures
If your database slows down, Service maps shows exactly which upstream services are affected. This makes it easier to prioritize fixes and communicate impact. - Reduce on-call stress
When an alert fires, responders can land on the service map and instantly see the bigger picture. This saves precious time during incidents. - Collaboration made easier
Service maps make complex systems understandable not just for engineers but also for product managers and stakeholders. Everyone can see how the system is structured without needing to know the code. - Confidence during deployments
Rolling out a new service? You’ll see immediately if it’s talking to the right dependencies and whether the integration is causing any latency or errors.
💡 Also read → Advanced PHP Monitoring for Enterprise Applications
Best Practices to Get Real Value Quickly
To really benefit from service maps, it’s worth putting a few best practices in place:
- Keep service names consistent
Use the same naming convention across your applications and environments. If not, the same service might appear multiple times on the map, making it harder to read. - Start with the most critical paths
Instrument the services that matter most to your business like checkout, login, or APIs that handle customer requests. Even partial coverage gives you immediate insight. - Use trace sampling wisely
You don’t need every single trace to see patterns. Configure sampling so you keep the map accurate while managing costs. - Tie it into your incident process
Make the service map part of your on-call routine. When an alert triggers, responders should jump straight to the map for quick context. - Review it regularly
Applications evolve. Use the service map as part of sprint reviews or postmortems to keep everyone aligned on how your system actually looks today.
💡 Also read → PHP Monitoring Best Practices for Developers, DevOps, and SREs
Introducing End-to-End Service Mapping with Atatus
When applications grow beyond a single server, they quickly turn into a network of moving parts: APIs, background workers, caches, databases, and third-party services. The bigger the system, the harder it is to understand how everything fits together.
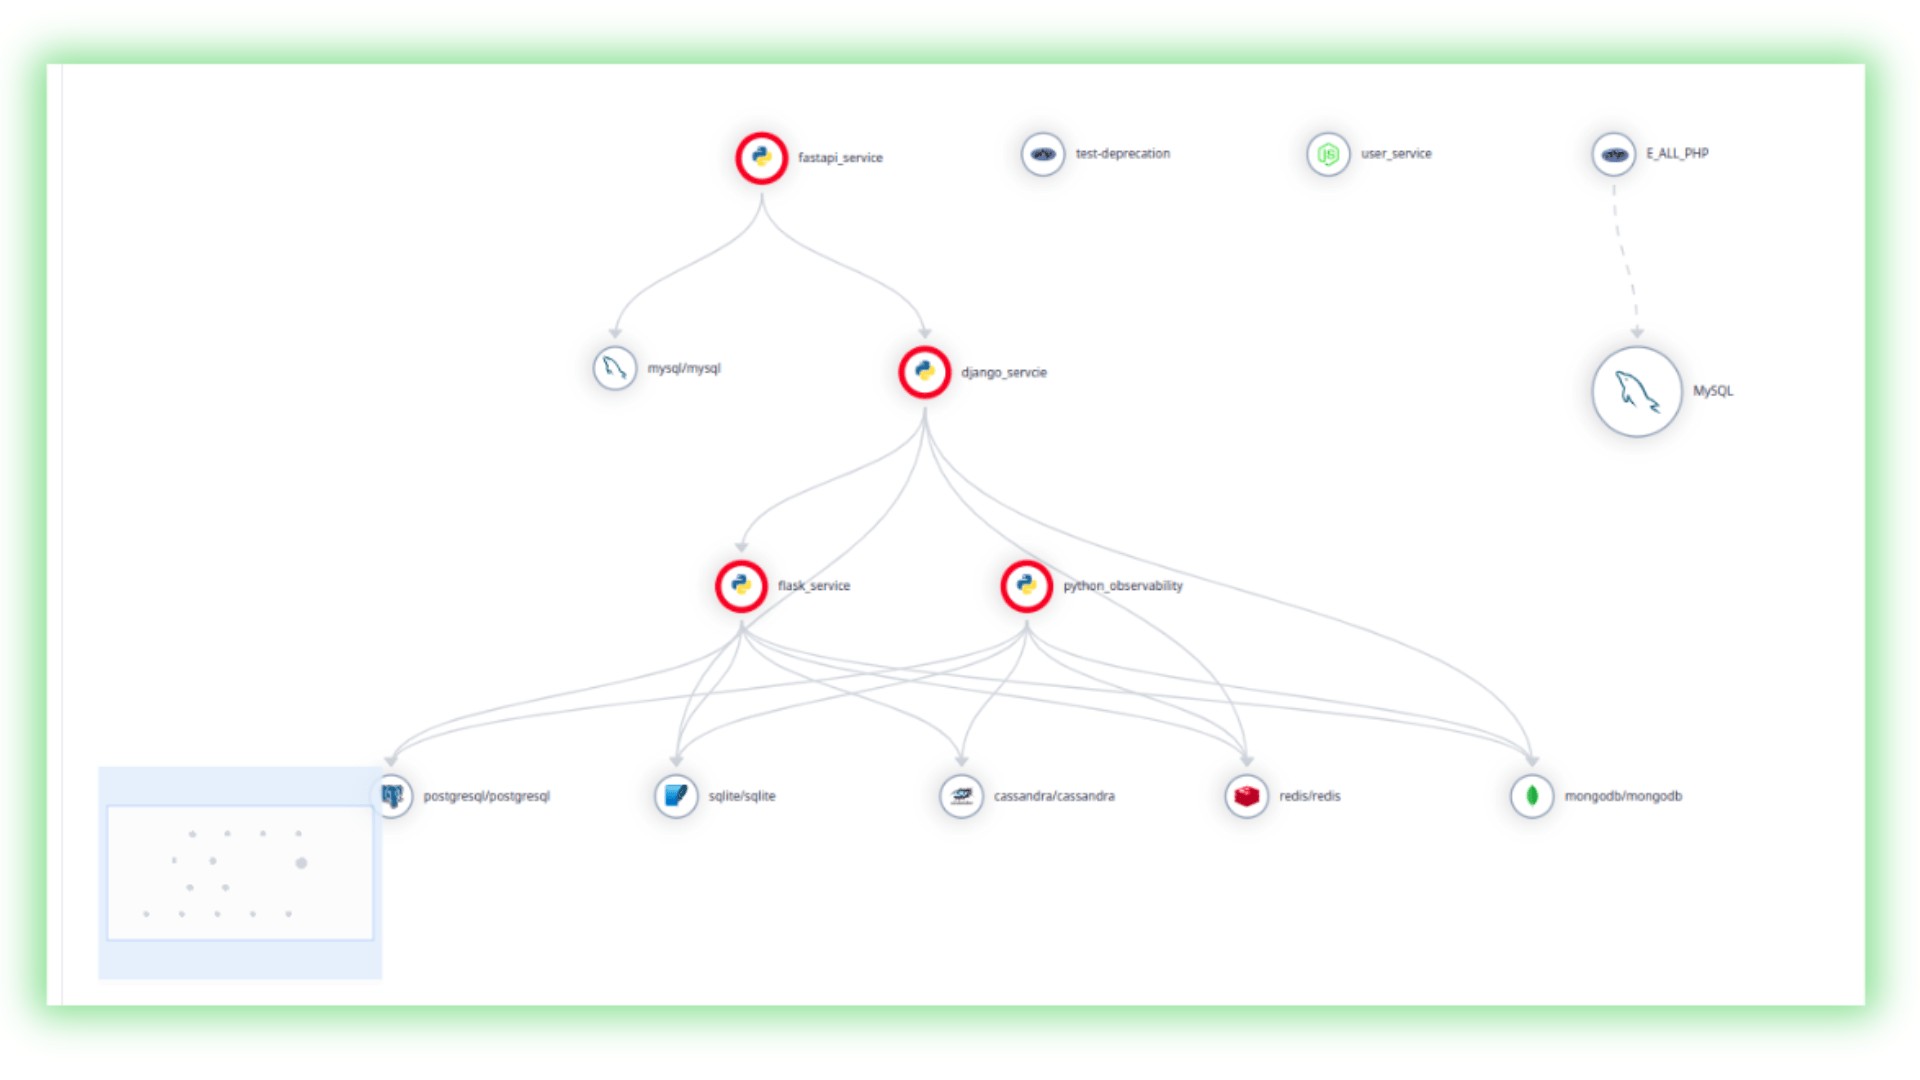
This is where Atatus Service Maps make a difference. Instead of digging through traces, metrics, and dashboards separately, you get a real-time, visual map of your application’s architecture. Each service shows up as a node, and the communication between them forms the connections. In one glance, you can see how data flows, where latency builds up, and which services are running into trouble.
How Atatus Builds the Service Map?
Atatus doesn’t ask you to manually draw out dependencies. The map is built automatically using the telemetry collected from your applications. Here’s how it comes together:
- Traces as the foundation
Every request that flows through your system is tracked as a trace. Atatus pieces these traces together, identifying which services are talking to each other and in what order. - Nodes and edges
From the trace data, Atatus generates nodes (representing services like your API, database, or cache) and edges (the communication between them). This creates a clear picture of service-to-service dependencies. - Health data at a glance
The service map isn’t just static. Each node carries live data such as error rate, request throughput, and latency. That way, you can immediately spot the hotspots without needing to open another dashboard. - Click to dive deeper
If something looks off, you don’t have to switch tools. You can click into any node or connection and jump straight to detailed traces, logs, or performance metrics for that service.
The end result is a living diagram that reflects your system as it exists right now, not just how you think it’s designed on paper.
Wrapping Up
Atatus Service Maps bring clarity to complex systems by showing you not just what services exist, but how they interact and perform in real time. They take away the guesswork from troubleshooting, improve collaboration across teams, and give you the confidence to roll out changes without fear of hidden dependencies. They give:
- Give clarity to complex environments
- Accelerate troubleshooting
- Improve performance and reliability
- Unite teams around one source of truth
Atatus takes service maps further. With deep PHP integration, distributed tracing, and cost-effective pricing, it’s built for engineering teams that demand results without overhead.
If you’re looking for an APM solution that delivers real-time insights and simplifies PHP monitoring, Atatus is the clear choice.
⚡ Turn complexity into clarity with Atatus
Modern apps are a web of services. Without visibility, every outage feels like detective work. Atatus Service Maps untangle the mess, giving your team a clear path from alert to resolution.
Start Free TrialFAQs on Atatus PHP Service Maps
How does Atatus service map work for PHP applications?
- Atatus automatically collects telemetry from your PHP app.
- Every request is traced, showing how it interacts with databases, caches, APIs, and services.
- A real-time map is built with nodes (services) and edges (communication).
- Each node shows health metrics like latency, throughput, and error rate.
Do I need to change my PHP code to use Atatus service maps?
- No code changes are required. Atatus agents handle the instrumentation.
- Setup is lightweight, so your app runs as normal.
- The service map is generated automatically from collected traces.
- This means faster onboarding and zero developer overhead.
How do Atatus service maps help with troubleshooting?
- They let you visually follow a request through multiple services.
- Problematic nodes are highlighted with error rates or high latency.
- You can click into a node to see traces, logs, or performance details.
- This makes root cause analysis much faster than switching tools.
Can Atatus service maps improve scaling decisions?
- Yes, Atatus shows which services hit performance limits.
- You can spot overloaded databases, caches, or APIs.
- Teams get data-driven insights to scale PHP servers or offload tasks.
- This prevents costly guesswork and ensures efficient resource use.
Why choose Atatus for PHP monitoring over other tools?
- Zero-instrumentation onboarding with OpenTelemetry support.
- Real-time service maps with live health data.
- Cost-effective pricing that scales with teams, not just data volume.
- Unified platform with traces, logs, metrics, and dashboards in one place.
#1 Solution for Logs, Traces & Metrics
![]() APM
APM
![]() Kubernetes
Kubernetes
![]() Logs
Logs
![]() Synthetics
Synthetics
![]() RUM
RUM
![]() Serverless
Serverless
![]() Security
Security
![]() More
More