Why Customers are Switching from New Relic to Atatus?

If you’ve worked in observability or application performance monitoring (APM) tools, you’ve likely come across New Relic. It has long been a prominent player in the market, offering a broad range of features including full-stack APM, infrastructure monitoring, real user monitoring, and analytics. However, while it provides powerful capabilities, many users have shared concerns about aspects such as pricing, complexity, and the learning curve.
For example, a review on Gartner Peer Insights highlights issues with setup complexity, unclear billing, and difficulty navigating the platform for smaller teams or rapid deployment cycles.
In this blog, we’ll explore why many teams are moving away from New Relic and why Atatus is considered the best alternative for New Relic. Drawing from real user experiences, we’ll show how Atatus offers a simpler setup, faster insights, transparent pricing, and responsive support, making it the ideal choice for engineering teams seeking full-stack observability without the complexity and high costs of New Relic.
What's in this blog?
- Key Challenges Users Encounter with New Relic
- Atatus Approach: Addressing What New Relic Misses
- Why Customers Choose Atatus Over New Relic?
- Case Study Highlight: Drezga’s Success with Atatus
- Conclusion
- FAQs: New Relic vs Atatus
Key Challenges Users Encounter with New Relic
Even the most popular tools aren’t perfect. While New Relic offers a wide range of features and deep insights, many teams find that it doesn’t always meet their day-to-day needs.
From conversations with developers, SREs, and engineering managers on platforms like G2, Capterra, and Reddit reveal clear patterns and highlight common issues that consistently push teams to explore alternatives to New Relic.
#1 Complex Pricing Structure
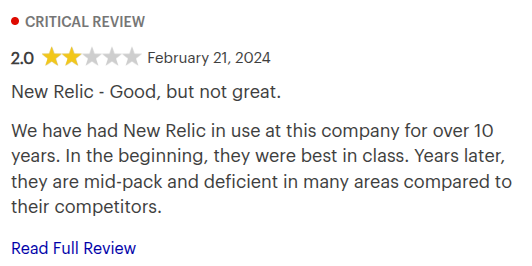
Many customers highlight that New Relic’s pricing is not only expensive but also hard to interpret. Their model combines user seats, data ingestion, and feature access tiers, a mix that often leads to cost surprises at the end of billing cycles.
For startups or growing companies, this becomes a budgeting nightmare. A small spike in data volume or new user accounts can dramatically increase monthly bills.
Insight: Teams want predictability in costs, especially when scaling. New Relic’s intricate licensing model often forces engineering and finance teams to constantly monitor usage instead of focusing on performance insights.
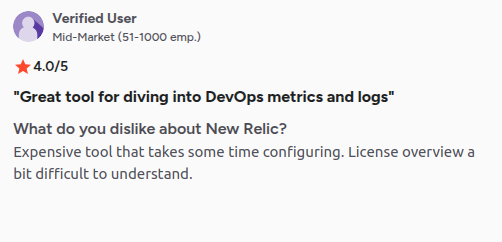
#2 Steep Learning Curve
New Relic’s all-in-one promise comes at a usability cost. Its dashboard requires deep configuration before users start getting actionable insights. Many users mention that without prior APM experience, understanding and navigating the platform feels overwhelming.
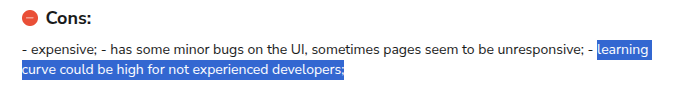
Insight: Teams looking for quick setup and instant visibility struggle with New Relic’s heavy configuration layer. The steep learning curve delays time-to-value and creates friction for smaller teams that need results, not complexity.
#3 Limited Historical Data Access
While New Relic provides rich real-time insights, its limited data retention policy restricts long-term trend analysis. For teams that rely on seasonality, historical performance, or regression tracking, this is a serious drawback.
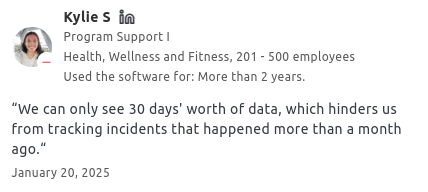
Insight: Without extended historical data, teams can’t fully assess the long-term impact of changes or spot recurring issues over quarters. This limits the effectiveness of data-driven decision-making.
#4 Overwhelming User Interface
New Relic’s interface tries to serve multiple personas, including developers, SREs, product teams, and executives. The result is a cluttered environment filled with dashboards, tabs, and jargon that often confuse users more than they help.
Insight: Teams need clarity, not chaos. An APM tool should help them pinpoint issues quickly, not slow them down with interface noise.
#5 Unethical Billing Practices
People discussing New Relic on Reddit have expressed frustration around unexpected billing and forced plan upgrades. Some report being charged for inactive users or for data ingestion volumes they were not fully aware of.
NewRelic unethical billing
byu/jaxn indevops
Observation: When billing becomes unpredictable or is perceived as unfair, trust erodes quickly. Users start looking for platforms that are more upfront and customer-focused.
Atatus Approach: Addressing What New Relic Misses
Atatus takes a different approach to monitoring. It is built to be simple, transparent, and fast, so teams can start seeing actionable insights immediately. Instead of overwhelming engineers with a complex dashboard and dozens of features that take weeks to configure, Atatus gives a clean, focused experience that just works.
Discover why engineering teams are choosing Atatus over New Relic
See the Detailed ComparisonHere’s how it addresses the challenges that often frustrate New Relic users:
#1 Transparent and Predictable Pricing
Atatus offers a clear pricing model. There are no hidden tiers, no confusing formulas for data usage or feature access. You know exactly what you are paying for each month. This clarity makes budgeting straightforward and avoids the stress of unexpected spikes in costs.
🌟 Customer Spotlight:
“The pricing system is very transparent and understandable. The support is top-notch, always in touch and helps to solve any questions.” - Capterra Review →
#2 Simple Setup and User-Friendly Interface
Setting up Atatus is quick. Once the agent is installed, it immediately starts collecting application performance metrics and providing insights. The interface is intuitive, so developers and SREs can quickly find what matters most without getting lost in menus or jargon.
🌟 Customer Spotlight:
“It's easy to set up, simple to use, has great metrics, and is simple to pinpoint pain points in the app. Great customer support.” - G2 Review →
#3 Full Historical Data Access
Atatus does not limit your visibility to the last 30 days. You can track performance and errors over longer periods, which helps identify recurring issues, understand trends, and plan improvements effectively.
#4 Clear and Actionable Dashboards
The dashboards are designed to be simple but informative. You can trace a slow API endpoint down to a specific line of code or database query without switching between multiple tools.
🌟 Customer Spotlight:
“Big-picture analytics dashboard to quickly monitor the overall health” - G2 Review→
#5 Customer-Focused Support
Atatus provides fast, human support. Users can get help directly from engineers who understand the product deeply, rather than dealing with scripted responses or tiered support.
🌟 Customer Spotlight:
“High uptime, nice and fast UI, easy to use. Great customer support.” - G2 Review→
Why Customers Choose Atatus Over New Relic?
When comparing features, Atatus stands ahead of New Relic with easy-to-use dashboards, real-time monitoring, straightforward pricing, and fast value from integrated tools.
Side-by-Side Feature Comparison: Atatus vs New Relic
Case Study Highlight: Drezga’s Success with Atatus
A great example of Atatus’s impact can be seen in the Drezga case study→
Drezga, a high-performance digital platform, struggled with visibility and scalability issues before switching to Atatus. They needed a monitoring platform that could handle their fast-growing infrastructure without inflating costs or adding unnecessary complexity.
Impact Summary:
30%
Reduction in cloud resource wastage
2x
API performance assurance
100%
Comprehensive service visibility
Atatus helped Drezga gain clarity, control, and measurable improvements in operational efficiency without overpaying for features they didn’t need. By adopting Atatus, Drezga gained full visibility into application performance, enabling their team to proactively resolve issues, optimize workflows, and reduce operational overhead while avoiding unnecessary costs.
Conclusion
Moving from New Relic to Atatus is more than a change of tools. It’s a way to simplify monitoring, gain clearer insights, and respond to issues faster.
Atatus gives engineering teams a single platform to track performance, errors, logs, and user experience without the complexity or setup hurdles. With intuitive dashboards, full historical data, and reliable alerts, teams can spend less time troubleshooting and more time improving their applications.
If you’re considering a switch, Atatus makes the process seamless. You can start monitoring your applications immediately and see actionable insights from day one.
💸 Save up to 50% on your New Relic bill
Get complete visibility into requests, queries, and microservices with Atatus to grow with your app.
Start Free TrialFAQs: New Relic vs Atatus
1) What are the main reasons users switch from New Relic to Atatus?
Many users find New Relic costly, complex to configure, and difficult to navigate, especially for small to mid-sized teams. Atatus solves these challenges with transparent pricing, intuitive dashboards, and faster deployment, making it easier for teams to monitor performance effectively.
2) Does Atatus provide better support than New Relic?
New Relic users often report slow response times and limited guidance for non-technical issues. Atatus offers responsive, helpful customer support that quickly resolves technical problems, subscription questions, and setup challenges, reducing downtime and frustration.
3) Is Atatus suitable for startups and large enterprises?
New Relic’s platform can be overwhelming for smaller teams, while enterprise setups can become expensive and complex. Atatus scales efficiently from startups to large enterprises, providing consistent performance monitoring, real-time insights, and actionable data without adding unnecessary complexity.
4) How does Atatus compare to New Relic in pricing?
Customers often leave New Relic due to unpredictable billing that grows with metrics, hosts, and add-ons. Atatus offers clear, predictable pricing, helping teams plan budgets and scale without surprise costs while still gaining full-stack observability.
5) Can Atatus replace other observability platforms like New Relic?
Teams migrate from New Relic because they need a more unified and efficient solution. Atatus combines APM, RUM, log management, and alerting into a single platform, improving performance visibility, simplifying monitoring, and enabling faster incident resolution.
#1 Solution for Logs, Traces & Metrics
![]() APM
APM
![]() Kubernetes
Kubernetes
![]() Logs
Logs
![]() Synthetics
Synthetics
![]() RUM
RUM
![]() Serverless
Serverless
![]() Security
Security
![]() More
More


![New Relic vs Splunk - In-depth Comparison [2026]](/blog/content/images/size/w960/2024/10/Datadog-vs-sentry--19-.png)