Technical Metrics to Measure Observability in Marketing

A website's performance can be measured using metrics. Metrics provide information on what is working, what is not, and where improvements are needed. Unlike numbers, spreadsheets, or data, it isn't as complicated or as time-consuming to use.
For observability in marketing, website metrics that measure user engagement are vital. By analyzing metrics, the marketing department will be able to determine what web pages are not providing the company with value.
Once the technical metrics for a page are known, developers can assess if any updates are necessary.
As long as website masters do not pay attention to the metrics, they're simply making assumptions, and they may be unaware of how much their website aids in their business growth or what opportunities they are missing.
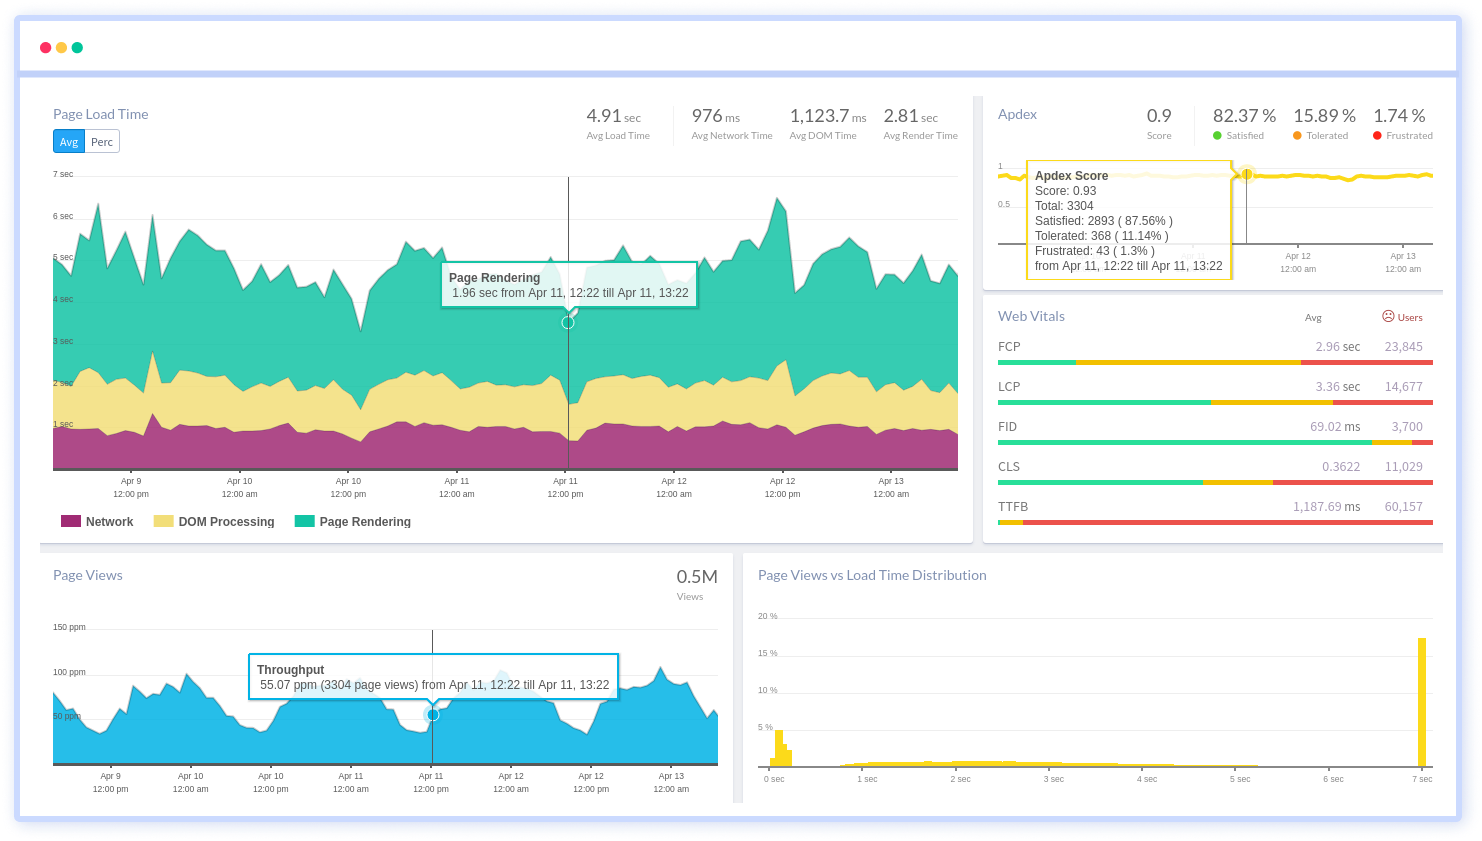
For say the moderate loading time of a page, is a distinct user engagement statistic, which can be recorded individually from technical logs.
When considering how a web page functions technically, it is vital to analogise technical and marketing metrics for observability.
It is advantageous for companies to analyze both marketing and technical data in the same platform since they are able to gain greater insight into the context of why users interact with a specific website in unique ways.
Tools For Analytics And Observability
There are many tools designed for capturing marketing data such as Google Analytics, Adobe Analytics, Amplitude, and Baidu Analytics.
While varied analytic tools track marketing metrics in varied ways, understanding how to evaluate performance observability is perhaps more prominent than the tools used.
To troubleshoot website content and behaviour, there are a variety of tools and platforms exist for tracking analytic data and furnishing observability of marketing data.
Atatus is a full-stack observability platform which has been embedded with more tools that can impart observability in marketing initiatives by analyzing user activity.
The consecutive is the preliminary technical metrics used to analyze observability in marketing;
1. Pages per Session
Pages per session indicate how many pages the user views on average during his visit to a website. The number of clicks and the number of pages viewed are the metrics used to measure engagement.
Pages per session or page depth provide insights into how engaging your content is and the ease of access.
The goal of most websites is to sustain the users' engagement, stimulate their interests, and propel them to take action.
User Engagement can also be measured by determining the number of pages a user interacts with. Pageviews indicate that the users are highly engaged and ready to explore the website.
Nevertheless, it is pertinent to note that if users are visiting multiple pages and the other metrics are low, then the user isn't finding what they are looking for.
2. Conversion Rate
The conversion rate tells us about the effectiveness of your webpage and marketing efforts while analyzing the entire web page's efficiency.
Along with engagement metrics, goals can also illustrate the relation between value and your business goals within your site's analytics story.
The standard conversion rate of Industry is 2%. As a metric of site performance, goal completions and conversion rates measure how well the site performs.
In order to determine which events on the web forum are most important to the businesses, goal completions and conversion rates must be reviewed. Ideally, these should be tied to the businesses' objectives.
It is important to distinguish conversions from events, as these are the upshots specified in the definition and indicate the reason why your internet site exists.

Despite the importance of events as a way to measure engagement, events can be segregated as subordinate website interactions that have no direct influence on business objectives.
Depending on your business goals and the use of your site, this benchmark will vary by industry.
Low conversion rates often indicate problems with pertinency, calls to action, lower-quality content, or usual disinterest.
Nevertheless, when the webpage is likely to experience a drop in its conversion rate if website engagement is suffering.
In order to identify the areas of the site that hold the greatest value and where improvement is needed most, conversion rates are a truly powerful digital marketing metric when viewed from a segmented perspective.
3. Bounce Rate
Generally, the bounce rate is a compute of the number of one-page visits, where users entered and exited your site from the same page. It is the proportion of single-page site visits.
The key takeaway is that the higher the bounce rate, the less engagement a Web page has with its visitors. The behaviour can also be used to measure how responsive a Web site is to visitor intentions and needs.
That’s why it’s important for marketers to pay attention to bounce rates when analyzing their analytics data and optimizing landing pages for better conversion.
A relatively low bounce rate (26% - 40%) indicates that visitors are engaging with your content, clicking through from one page to another, or even purchasing something from your website before they leave.
A higher than average bounce rate (56% - 70%) may signal that there is room for improvement on the landing page or that the content is not relevant enough.
Bounce rate is the percentage of visits that are one page views and then leave the site.
This happens when visitors follow a link to a page, view that page, and then leave without interacting with the content or navigating through any other pages on the site.
Bounce rate has become an important metric to digital marketers as it reveals how well they have optimized their web pages.
It is also used in SEO as a ranking signal by Google because there is a correlation between high bounce rates and low rankings.
An important point to keep in mind is that bounce rates can fluctuate over small time spans because it includes traffic coming and going from a website.
Since bounce rate is so closely tied to the number of people who come to your website, this metric is often used in conjunction with other metrics that can help provide better insights into actual visitors.
For instance, the number of visitors and time spent on web forums are two different metrics that can help you assess the success of your digital marketing efforts.
You might have a goal of increasing the number of visitors to your site. If you monitor their time spent on your site, you can see if the goal is met.
Recapitulate-Is Analytics Requiring Only One Metric?
Predominantly, to evaluate performance, not only one metric is used individually. Instead of letting them lend to the story together, focusing on one metric, the greater opportunity is missed.
Monitoring marketing metrics altogether with technical metrics reveals which pages demand rewriting and which developers need to improve in order to understand which pages work for your website.
This assists marketing departments determine which pages developers need to overhaul and which designers need to rework.
Technical metrics have a greater impact on marketing which enriches the website’s performance and navigates businesses to fulfil its objectives.
Atatus, Unified Monitoring Platform
Atatus is a classic and efficient full-stack observability platform for your complete application. It assists you in revamping your application to application monitoring. It creates better software and fastens instant visibility.
It delivers a top-notch user experience and harmonize application performance to your enterprise upshots with full-stack observability.
Bestowing your application with Atatus will aid in eliminating errors with the help of full-stack monitoring tools, and instruments, also analyzing, troubleshooting, and resolving the errors in your app.
Log Monitoring assists you with analyzing log analytics with a brisk and impulsive search to ascertain and affix issues. Monitor all your log file data that unfurl across various platforms in real-time.
Impel your application swifter and bug-free, try the 14-days free trial of Atatus!
#1 Solution for Logs, Traces & Metrics
![]() APM
APM
![]() Kubernetes
Kubernetes
![]() Logs
Logs
![]() Synthetics
Synthetics
![]() RUM
RUM
![]() Serverless
Serverless
![]() Security
Security
![]() More
More

![New Relic vs Splunk - In-depth Comparison [2025]](/blog/content/images/size/w960/2024/10/Datadog-vs-sentry--19-.png)
![New Relic vs Sentry - Which Monitoring Tool to Choose? [2025]](/blog/content/images/size/w960/2024/10/VS--1-.png)