How to Monitor Website Performance
Most organizations today have a large digital presence, and some rely significantly on their web applications to provide value to their customers and generate income. Keeping your website up and running 24/7 isn't enough in today's digital world.
To provide a better experience, you should optimize your web pages frequently. Slow-loading pages or those that aren't mobile-friendly might cause an increase in bounce rate as well as influence your search engine rankings.
In this article, we'll go through what is web performance monitoring and the tools to monitor and improve the speed of your website.
Here’s how it is done:
- What is Web Performance Monitoring?
- What Causes Poor Web Performance?
- How to Monitor Website Performance?
- Website Performance Indicators
- Tools for Monitoring Website
What is Web Performance Monitoring?
Web performance monitoring is a set of methods and tools that help you track your web application's performance using various metrics and technical aspects that affect page load speed and user experience.
Most web performance analyzers allow you to examine the condition of your website and track important metrics like page size, time to first byte, broken links, database performance, CPU use, and more. You can uncover any lingering, hidden, or cyclical difficulties, as well as improve your readiness to deal with unexpected spikes, by regularly monitoring your web applications.
Web performance monitoring tools can also help you improve your web pages’ “perceived performance”, making them appear to load faster than they actually are. Modern web performance monitors can also measure user experience (UX) indicators like page loading spinner, click and hover interactions, animations, scrolling, and more.
What Causes Poor Web Performance?
Many factors can contribute to a website's or web service's bad performance. File quantities, file sizes, system design, and user variables like location, device, browser type, operating system, and connection speed all contribute to a positive or negative end-user experience.
- Page Size
The majority of today's customer-facing websites use high-resolution photos. The average physical size of web pages has increased as a result. However, when the page weight grows, loading time may increase. - Scripting or Code-Related Issues
Thousands of lines of CSS, HTML, and JavaScript code go into every significant website. The quantity and complexity of code on websites grow as they evolve. Multiple scripts are frequently executing in concurrently. Higher-than-expected web server calls can result in greater latency in such scenarios. Additionally, several threads accessing the same shared code or data might cause a "race situation," exposing a website to cybersecurity threats. - Server Location
Businesses with multiple geographies must guarantee that the performance of their websites is uniform across all of them. If, on the other hand, your website is hosted in one location but receives visitors from other regions, the user experience will differ. In such circumstances, a CDN (content delivery network) might be a good option. - Server Performance
The performance of a web server has a direct impact on the performance of your website. When a browser sends a ping to your server, it is requesting that the server load or communicate data to your website. These requests take longer to process if your server is down.
How to Monitor Website Performance?
Web Performance Monitoring is complemented by similar performance monitoring technology; one of them is Application Performance Management (APM). APM is a set of tools and processes that allow a company to ensure that its applications, websites, web-based services, and other important infrastructure are performing at their best.
An APM solution, in further detail, accomplishes the following:
- Measures the availability and performance of an application
- Troubleshoots and diagnoses problems before they have an impact on operations or the user experience (UX)
- Actions to resolve and recover from apparent performance concerns are automated
Web Performance Optimization (WPO) is a similar performance monitoring tool that works in conjunction with Web Performance Monitoring.
The primary goal of WPO is to improve web performance. It makes use of several strategies to monitor and analyze the performance of web applications within an organization's network to find ways to improve them.
WPO is similar to Search Engine Optimization (SEO) in that enhancing web performance improves search engine rankings, user experience, and website traffic.
Real User Monitoring and Synthetic Monitoring are the two basic ways to Web Performance Monitoring. We'll go over them in-depth now.
Real User Monitoring (RUM)
Real User Monitoring (RUM) is a type of Web Performance Monitoring that uses passive monitoring (the RUM application collects website performance metrics without interfering with the website's operation) technology to continuously observe, capture, and analyze all user interactions with websites and web applications, tracking availability, functionality, and responsiveness.
Organizations may quickly gather data about how their applications are being used, as well as the application's and users' actual performance, regardless of device, browser, or network, using RUM approaches.
RUM collects all of the performance indicators (connectivity, load time, uptime, and so on) for each user, allowing you to see how your website is doing based on user location, browser type, operating system, and device. Using A/B testing or other techniques, RUM can also be used to test or predict changes in a live website or web application.
With the growing popularity of cloud services and web and mobile applications, it's become increasingly necessary to track how these applications are being used, even from the client's perspective. Organizations can obtain the following results by utilizing RUM:
- Recognize its users and determine which portions of the website require the greatest attention.
- Understand end-user distribution trends by geography or channel, as well as other significant usage data. Knowing your user trends allows you to target areas for performance improvements and optimization from a monitoring perspective.
- Get reports on load time, network duration, backend/frontend duration, and download time, among other things.
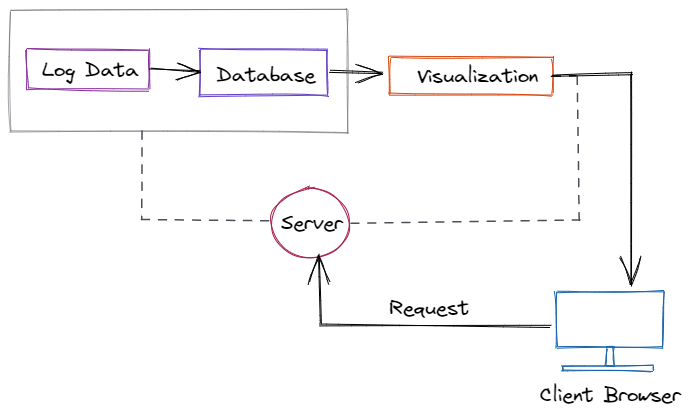
RUM technology works by recording performance metrics from a website or web application directly from the end-user browser or client. A little piece of JavaScript code embedded in each page captures this information from users as they navigate the websites and sends it back to be analyzed. After that, data visualization tools like graphs and charts are used to make it easier to extract meaningful insights from the data.
Synthetic Monitoring
Synthetic Monitoring is a type of Web Performance Monitoring that uses active monitoring technologies to install scripts that imitate an activity or path a user could take through a web application, then report the results for further analysis.
These pathways are then regularly evaluated for performance metrics such as functionality, availability, and response time at predetermined intervals. This sort of monitoring does not require actual web traffic or user interaction; instead, it collects data on page performance using synthetically generated traffic.
Synthetic monitoring is useful because it allows a webmaster or system administrator to spot and fix issues on the website before they affect actual end-users or customers. It allows businesses to test new applications before deploying them in a live environment.
Synthetic monitoring is best utilized to monitor heavily traveled pathways and essential business processes since it simulates regular user behavior. Depending on what is being monitored or measured, synthetic monitoring will report a wide range of performance metrics.
Synthetic Monitoring employs a computer application that performs routine performance checks. A checkpoint sends a request to the website or web service every minute or so, monitors response times, and creates reports and alerts based on the website's performance throughout the test.
Synthetic monitoring works by deploying scripts that run regularly to do automated periodic performance checks. The script sends requests to the website or web service regularly, monitors response times, and creates reports and alerts based on the website's performance.
Synthetic monitors work similarly to bots, connecting to websites, web services, APIs, and servers to assess availability and performance using a network of checkpoints located outside of the website's servers.
When these monitors detect downtime or any other sort of performance degradation, they send out notifications. System administrators can use these capabilities to detect availability concerns or serious execution issues before they harm users' digital experiences.
Website Performance Indicators
The following metrics can be used to assess the performance of your websites.
- Bounce Rate
The bounce rate is the percentage of visitors who depart your website without visiting any other pages after landing on the first one. Assume someone uses Google to search for something, and Google returns your website as one of the results. The user then goes to your website after clicking on the link. The bounce rate increases if a person leaves your website after viewing the first page. If a user navigates to different pages on your website, this is not called bouncing. - Connection Time
From the time the web application is first requested, the amount of time it takes the web browser or client to establish a connection with the webserver is known as connection time. The connection time can assist you to figure out how well the website's network is performing. There might be a lot going on in the network between the client and the browser. If you keep track of the connection time, you'll be able to detect if the network is producing a performance issue. - Error Rate
The error rate is the percentage of requests that contain errors. It's derived by dividing the total number of requests by the average number of problematic requests. When your website isn't working as it should, the error rate might help you figure out why. The error rate is especially useful if you want to know how your website will perform in the event of a sudden spike in traffic. - Page Load Time
The average time it takes for a page to load is referred to as page load time. Your browser sends a request to the server to deliver the page when you click on a URL. Your server sends a lot of information, such as text, images, and design. The time it took for the website to completely load from the moment you initially clicked on the URL is referred to as page load time. This metric can help you figure out how fast your server is and whether or not you're sending unoptimized elements from the server to the web browser. - Time to Interact
The time to interact is the time it takes for a person to interact with a website after the first visit. You may have observed that you can't always engage with a dynamic website right after it loads. Before you can type something into a text box or click a button, these websites take a while to load all of the content and render everything. The time it takes for a user to interact with your website provides you with an idea of how long they have to wait. - Time to Title
This is the amount of time it takes for the website's title to load from the time you originally requested the webpage. The title of the website is the text that appears in the tab linked with the website in your browser. A shorter time to title helps the user in determining whether or not the website they have requested is legitimate. This is especially useful if you have a website with a lot of heavy elements that would take a long time to load. The user may be persuaded to wait for the entire page to load if the time to title is reduced. - Uptime
A website's important performance indicator is uptime monitoring. As most businesses rely largely on their website, having an online presence is no longer an option. It has a direct impact on revenue if a website is offline for a few minutes or has a slow-loading page for longer than the suggested duration. In addition, an inaccessible website causes corporate procedures and operations to be disrupted. As a result, prolonged downtime and the frequency with which it occurs might damage your company's reputation.
Tools for Monitoring Website
While we continue to work on a more comprehensive analysis of the best Website Performance Monitoring products on the market, we'll take a quick look at a few of them.
- Atatus
It is a full observability platform that tracks and improves application performance, IT infrastructure, and user experience. It can be used to perform both Real User Monitoring (RUM) and Synthetic Monitoring. - SolarWinds Server & Application Monitor
It provides enterprises with capabilities to intelligently monitor the status of web applications, application servers, and more through a single web portal. - Site24x7
It is a cloud-based infrastructure monitor that comes in a variety of packages for the website, infrastructure, and application performance monitoring. - New Relic
It is a cloud-based software that allows owners of websites, web applications, and mobile applications to track the performance of their services in real-time. - SolarWinds Pingdom
It is yet another capable tool that allows you to examine your website in a much simpler, yet effective, and faster manner. It keeps track of website uptime, page speed, transactions, and real users (RUM).
Conclusion
The performance of a website can be influenced by a variety of factors, including images, CSS, JavaScript, underlying hardware, and networking issues. Modern web monitoring tools can help you keep track of various metrics and performance indicators so you can stay on top of the performance of your website.
Monitor Your Entire Application with Atatus
Atatus is a Full Stack Observability Platform that lets you review problems as if they happened in your application. Instead of guessing why errors happen or asking users for screenshots and log dumps, Atatus lets you replay the session to quickly understand what went wrong.
We offer Application Performance Monitoring, Real User Monitoring, Server Monitoring, Logs Monitoring, Synthetic Monitoring, Uptime Monitoring, and API Analytics. It works perfectly with any application, regardless of framework, and has plugins.

Atatus can be beneficial to your business, which provides a comprehensive view of your application, including how it works, where performance bottlenecks exist, which users are most impacted, and which errors break your code for your frontend, backend, and infrastructure.
If you are not yet an Atatus customer, you can sign up for a 14-day free trial.
#1 Solution for Logs, Traces & Metrics
![]() APM
APM
![]() Kubernetes
Kubernetes
![]() Logs
Logs
![]() Synthetics
Synthetics
![]() RUM
RUM
![]() Serverless
Serverless
![]() Security
Security
![]() More
More

![Application Performance Monitoring (APM) Guide: Monitor and Optimize Application Performance - [2026 Update]](/blog/content/images/size/w960/2025/10/APM-GUIDE---Monitor-and-Optimize-Application-Performance.png)