From Loading to Interaction: A Guide to Time to Interactive Improvement
Have you ever visited a website that took forever to load, leaving you staring at a blank screen and clicking your mouse in frustration? If so, then you have experienced the slow Time to Interactive (TTI).
TTI is the ultimate test of a website's speed and responsiveness, measuring the time it take s for a page to fully load and become interactive. A slow TTI can leave your users feeling bored, frustrated, and downright furious. So, if you want to keep your users engaged and avoid losing them to your competitors, it's time to get serious about optimizing your TTI.
TTI is a critical metric for website owners and developers who are focused on delivering fast, responsive, and engaging user experiences.
Table of Contents
- What is TTI?
- FCP and TTI
- What is a good TTI score?
- What Causes a Slow TTI?
- Factors affecting TTI
- How to improve TTI?
- Case Studies and Examples
- Tools for Measuring and Monitoring TTI
What is TTI?
TTI stands for Time to Interactive and it measures how long it takes for a web page to become fully interactive for the user.
In simpler terms, TTI is the time it takes for a web page to become fully functional and responsive to user input after the user clicks a link or enters a URL. It measures how long it takes for the web page to be fully loaded and usable, allowing the user to interact with it in a meaningful way.
Why TTI is important for user experience?
Here are some reasons why TTI is important for user experience:
- Users expect web pages to be responsive and interactive as soon as possible.
- Slow TTI can lead to user frustration and dissatisfaction, ultimately resulting in lost traffic and revenue for businesses.
- A high bounce rate caused by slow TTI can negatively impact a website's search engine ranking.
- Slow TTI can reduce user engagement and conversion rates, which is especially important for e-commerce sites and other sites that rely on user actions to achieve their goals.
- Faster TTI can lead to a better user experience, which can increase user satisfaction and retention.
- A better TTI can also lead to increased user trust and loyalty, which can be important for building and maintaining a strong brand image.
- TTI is a measurable metric that can help businesses identify performance issues and prioritize optimization efforts.
- Improving TTI can have a positive impact on other performance metrics, such as page load time and first contentful paint, further improving the user experience.
How TTI is measured?
Here's a general formula for calculating TTI:
TTI = Time when the page becomes interactive - Time when the page starts loading
The specific methods for measuring the time when the page becomes interactive may vary, but typically involve simulating user input and recording the time when the page responds to that input.
Different tools and methods may have their own algorithms for calculating TTI, but the basic idea is the same: to measure the time it takes for the page to become fully interactive and responsive to user input.
FCP and TTI
FCP (First Contentful Paint) is a metric that measures how long it takes for the first bit of content to appear on the user's screen after they request a web page. Whereas TTI (Time to Interactive) is a metric that measures how long it takes for the remaining content to load and for the page to become fully interactive.
TTI (Time to Interactive) is reached only after FCP (First Contentful Paint), because in order for a web page to be fully interactive, it needs to have all of its content loaded and displayed on the user's screen.
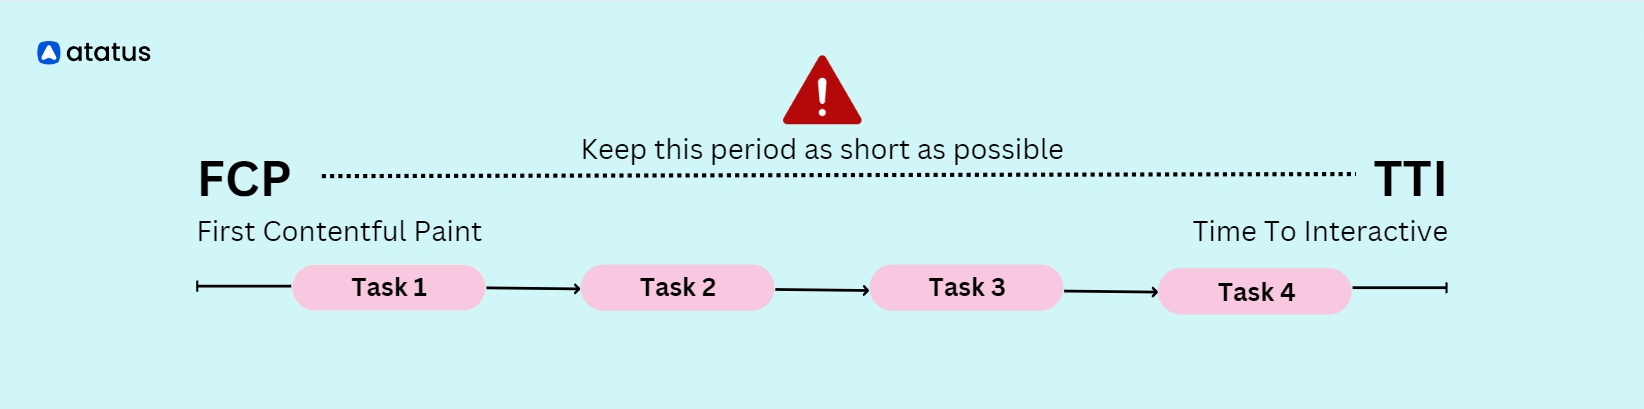
A larger gap between these two metrics can cause serious problems. The page may appear to be interactive but is not fully loaded or responsive to user input. This can lead to a frustrating user experience, especially if users try to interact with elements of the page that haven't finished loading yet.
If the TTI of a web page is too slow, it could lead to a worst-case scenario where users may assume that the webpage is not functioning properly and may choose to leave. This could result in users losing trust in the brand and perceiving the webpage's content to be of low value.
What is a good TTI score?
TTI (Time to Interactive) is an important performance metric that measures how long it takes for a web page to become fully interactive. In other words, it is the amount of time it takes for users to be able to interact with all page elements and complete actions without delay.
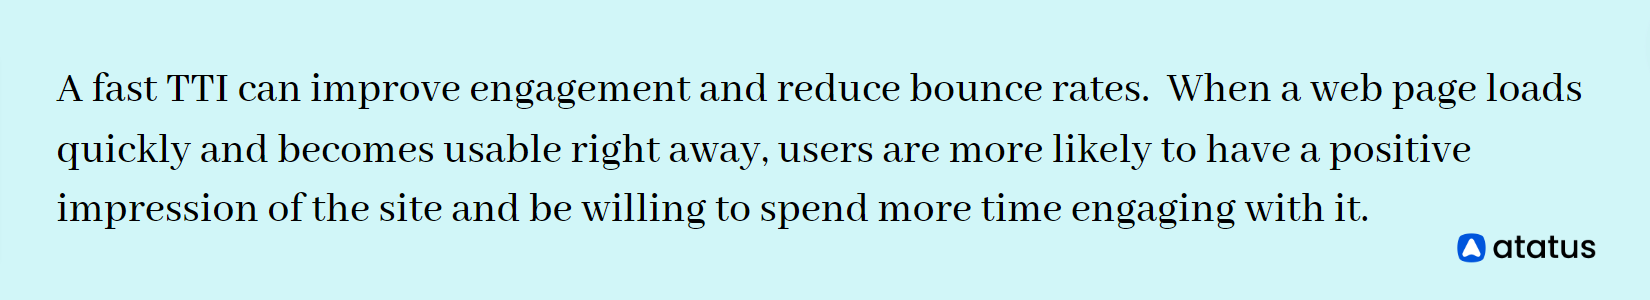
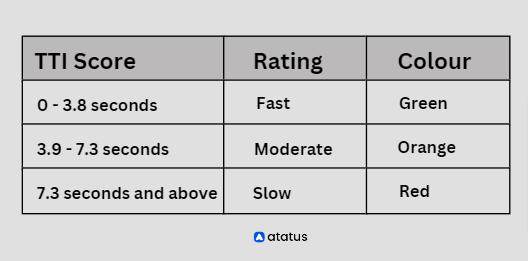
A good TTI score is generally considered to be less than or equal to 5 seconds. A good TTI score is crucial for providing a positive user experience, which can lead to higher engagement, lower bounce rates, and better conversion rates.

However, this ideal score may vary depending on a number of factors, such as the complexity of the web page, the user's internet connection speed, and the device they are using to access the page.
What Causes a Slow TTI?
There are several specific issues that can impact TTI and cause slow loading times. Some of these factors include large file sizes, unoptimized code, render-blocking resources, network issues, and server response times.
Large file sizes, such as images, videos, and scripts, can slow down the loading time of a web page, which can increase TTI (Time to Interactive). When a web page contains large files, it takes longer for the browser to download these resources from the server, which can cause the page to load slowly.
Uncompressed or high-resolution images can take a long time to load, which can delay the time it takes for a page to become interactive. Large videos can also significantly impact TTI, especially if they are set to autoplay or load automatically.
Another main factor which causes slow TTI is the usage of unoptimized code. This can include render-blocking resources, such as JavaScript or CSS, that delay the rendering of a web page. This delay can increase TTI. Unoptimized code can require more network usage, which can slow down the loading time of a web page, especially on slower network connections.
Render-blocking resources are resources such as JavaScript or CSS files that prevent a web page from rendering until they are fully downloaded and processed by the browser. When a browser encounters a render-blocking resource, it must stop rendering the page until that resource is downloaded and processed.
This can cause a delay in rendering, which can increase the time it takes for a web page to become interactive. For example, if a JavaScript file is included in the header of a web page, the browser must download and process the entire file before it can continue rendering the page, which can delay the time it takes for a user to interact with the page.
Factors affecting TTI
A slow TTI can negatively impact user experience, leading to increased bounce rates and lower engagement. To improve TTI, it's important to identify the factors that affect it. Here are the main factors to consider:
- Load time: The time it takes for a page to load is a critical factor in TTI. A slow load time can delay the page becoming interactive for the user, which can negatively impact their experience.
- Rendering: Rendering is the process of displaying the content of the page on the screen. A slow rendering time can delay TTI by preventing the page from becoming interactive.
- First Input Delay (FID): FID is the time it takes for the website to respond to user input. If the FID is slow, it can negatively impact the user experience and delay TTI.
- JavaScript execution: JavaScript can impact TTI if it is executed slowly or if there are long-running scripts that delay the rendering and FID.
- Server response time: The time it takes for the server to respond to a user's request can also impact TTI. A slow server response time can delay the loading and rendering of the page.
- Third-party scripts and resources: Third-party scripts and resources, such as ads and social media widgets, can impact TTI if they are slow to load or execute.
How to improve TTI?
Measuring TTI and interpreting the results can help you understand how your website is performing and identify areas for improvement. Here are the steps to measure TTI and interpret the results:
- Optimize your code: Make sure your code is as efficient as possible. This includes minimizing the use of JavaScript, CSS, and images, and removing any unnecessary or redundant code.
- Minimize HTTP requests: Reduce the number of HTTP requests by combining or minimizing files. This will help speed up the loading time of your page.
- Reduce the size of resources: Compress images and other assets to reduce their size, and use modern image formats like WebP to improve performance.
- Optimize server response times: Ensure that your server responds quickly to requests by using caching, reducing database queries, and using a faster server.
- Test and monitor: Test your website regularly to identify and fix any performance issues. Use monitoring tools like Atatus, to keep track of your website's performance over time and identify any trends or issues.
- Use a fast and reliable hosting provider: Choose a hosting provider that offers fast and reliable servers to reduce the time it takes for your website to respond to requests.
- Use asynchronous loading: Asynchronous loading allows resources to load in the background, without blocking the rendering of the page. This can help reduce TTI.
- Reduce the number of redirects: Reduce the number of redirects on your website, as each redirect adds to the time it takes for the page to load.
Case Studies and Examples
Here are some real-world examples of TTI improvement, success stories, and best practices from industry leaders:
- Airbnb: Airbnb was able to improve TTI by over 50% by optimizing the loading of their JavaScript files. By loading critical JavaScript files asynchronously, they were able to improve the time it took for the page to become interactive, resulting in a better user experience for their customers.
- AliExpress: AliExpress, the online retail platform, was able to reduce TTI by 36% by optimizing their images and using a Content Delivery Network (CDN) to reduce load times. They also improved their page layout and prioritized content to make it more accessible to users.
- Pinterest: Pinterest was able to improve TTI by 40% by optimizing their page load times and prioritizing content that users interact with most frequently. They also optimized their JavaScript files to load asynchronously, reducing the time it took for the page to become interactive.
- The Guardian: The Guardian, a UK-based news publisher, was able to improve TTI by 12% by optimizing their CSS and JavaScript files and using a CDN to reduce load times. They also removed unnecessary code and minimized their HTML to improve page load times.
- Walmart: Walmart was able to improve TTI by 50% by optimizing their images, using a CDN to reduce load times, and optimizing their JavaScript files to load asynchronously. They also prioritized content and used lazy loading to improve the user experience.
Tools for Measuring and Monitoring TTI
There are several tools available for measuring and monitoring TTI (Time to Interactive) to help website owners and developers optimize their website's performance. Here are some popular tools:
- Atatus Browser Monitoring: Atatus is a performance monitoring tool that provides comprehensive visibility into your web application's performance, including TTI. Collects performance data from real user sessions and provides a detailed report on how long it takes for the page to become interactive. Atatus provides insights into browser rendering and helps identify performance issues across different browsers and devices.
- Chrome DevTools: Chrome DevTools is an integrated development environment (IDE) that comes with Google Chrome browser. It provides a Performance panel that can be used to measure and analyze the performance of a webpage, including TTI. DevTools simulates user input to determine when the page becomes interactive.
- Lighthouse: Lighthouse is an open-source tool developed by Google that can be used to audit web page performance. It provides a comprehensive report that includes metrics such as TTI, page load time, and other performance-related metrics.
- WebPageTest: WebPageTest is a free online tool that allows you to test your website's performance from multiple locations around the world. It provides detailed performance reports that include TTI and other performance metrics.
- GTmetrix: GTmetrix is another online tool that analyzes the performance of a webpage. It provides a detailed report that includes TTI and other performance metrics, along with recommendations for optimization.
- SpeedCurve: SpeedCurve is a performance monitoring tool that provides a suite of performance-related metrics, including TTI. It allows you to track changes in performance over time and identify potential issues.
- Google Analytics: Google Analytics is a web analytics tool that can be used to track user engagement metrics, including time on page and bounce rate. While these metrics are not the same as TTI, they can provide insights into user behavior and indicate potential performance issues.
Conclusion
In today's digital age, where users expect instant gratification and seamless experiences, Time to Interactive (TTI) has become more critical than ever. A slow-loading website can have a significant impact on user engagement, conversion rates, and brand reputation.
However, by prioritizing TTI optimization, website owners can deliver a lightning-fast, highly engaging experience that keeps users coming back for more.
To optimize TTI, website owners and developers need to focus on reducing the loading time of critical resources such as JavaScript and CSS, optimizing images and other media, minimizing the use of third-party scripts and plugins, and prioritizing the loading of visible content.
Optimizing TTI is not just good for user experience, it is also a sound business strategy. A fast website not only increases engagement and conversions but also improves search engine rankings, which can drive even more traffic and revenue.
Atatus Real User Monitoring
Atatus is a scalable end-user experience monitoring system that allows you to see which areas of your website are underperforming and affecting your users. Understand the causes of your front-end performance issues and how to improve the user experience.
By understanding the complicated frontend performance issues that develop due to slow page loads, route modifications, delayed static assets, poor XMLHttpRequest, JS errors, core web vitals and more, you can discover and fix poor end-user performance with Real User Monitoring (RUM).
You can get a detailed view of each page-load event to quickly detect and fix frontend performance issues affecting actual users. With filterable data by URL, connection type, device, country, and more, you examine a detailed complete resource waterfall view to see which assets are slowing down your pages.
#1 Solution for Logs, Traces & Metrics
![]() APM
APM
![]() Kubernetes
Kubernetes
![]() Logs
Logs
![]() Synthetics
Synthetics
![]() RUM
RUM
![]() Serverless
Serverless
![]() Security
Security
![]() More
More