A Comprehensive Comparison of Prometheus and Nagios
Prometheus and Nagios are both open-source infrastructure monitoring solutions created by SoundCloud Engineers and Ethan Galstad respectively. They both find popular usage in monitoring the availability and performance of computer systems, networks, and applications.
While Prometheus uses a pull-based model to collect metrics and its dynamic service discovery support, Nagios uses a push-based model modeled on plugins. It has a large library of plugins and supports complex configuration and customization.
Prometheus can integrate with Kubernetes and other containerization applications and is well-suited for monitoring modern, cloud-native environments. At the same time, Nagios may be a better fit for more traditional IT environments.
In this article, we would compare them on several important stands like deployment, installation, data model, metrics collection, service discovery, scalability, visualization, and alerting capabilities, among others, that can influence a developer's monitoring journey.
Table Of Contents
- Prometheus
- Nagios
- Prometheus vs. Nagios Comparison
- Atatus - Comprehensive Alternative to Prometheus and Nagios
Prometheus
Prometheus is an open-source monitoring and alerting tool that was first developed at SoundCloud in 2012. Prometheus collects time-series data from various sources, such as application metrics, system metrics, and log files, and stores it in a time-series database. It then allows users to query and visualize this data in real-time using a flexible query language and a web-based dashboard.
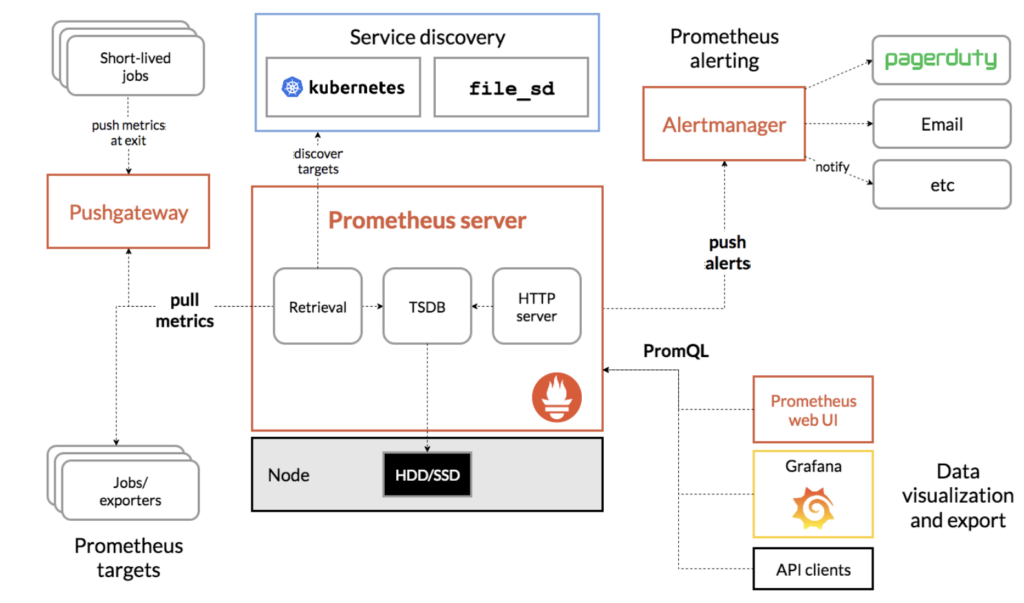
Prometheus uses a pull-based model, where agents known as "exporters" are installed on the systems being monitored, and they periodically expose metrics to the Prometheus server. The server then collects and stores these metrics, allowing users to create custom alerts based on specific thresholds or conditions. Prometheus also supports dynamic service discovery, allowing it to automatically discover and monitor new services as they are deployed.
Prometheus is a powerful and flexible monitoring tool that has gained widespread adoption in the DevOps community due to its scalability, ease of use, and rich feature set. It is designed to help monitor and analyze the performance and health of computer systems, networks, and applications.
Deploying Prometheus for your System
- Download the latest version of Prometheus from the official website:
- Extract the downloaded archive to a directory on your system.
- Navigate to the extracted directory and locate the
prometheus.ymlconfiguration file. This file contains the list of targets that Prometheus will scrape metrics from. You will need to modify this file to include the endpoints for the systems and services you want to monitor. - Start the Prometheus server by running the Prometheus binary. By default, the Prometheus server listens on port 9090.
- Once the Prometheus server is running, you can access the web-based user interface by navigating to http://localhost:9090 in your web browser.
- Configure Prometheus as a service using systemd or any other service manager.
- Install and configure exporters to monitor specific targets, such as Node Exporter, MySQL Exporter, or Nginx Exporter.
- Configure alerts using the Alertmanager to receive notifications in case of any issues or anomalies.
- Monitor the metrics and graphs in the Prometheus web interface to gain insights into the performance of your systems.
Nagios
Nagios is an open-source monitoring system that is used to monitor the availability and performance of computer systems, networks, and applications. It was first released in 1999 and has since become one of the most widely used monitoring tools in the industry.
Nagios works by running checks on various hosts and services, such as HTTP servers, email servers, and network devices, to ensure that they are functioning correctly. The checks can be performed using various methods, including SNMP, NRPE, and plugins. Nagios can also be configured to send alerts when it detects problems, either via email, SMS, or other means.
One of the key strengths of Nagios is its flexibility and extensibility. It has a large community of users and developers who have contributed to a vast library of plugins, which can be used to monitor a wide range of systems and services. Nagios also provides a web-based interface, making it easy to manage and monitor the system from anywhere.
Nagios is a robust and reliable monitoring tool that has proven to be a valuable asset for IT departments and system administrators in managing and maintaining complex IT infrastructure.
Deploying Nagios
Install the Nagios Core server on a system. The Nagios Core server is the main monitoring engine that runs checks on the systems and services you want to monitor. Nagios Core can be installed on various Linux distributions using package managers such as yum or apt.
1. Install Prerequisites: Before installing Nagios, ensure that your system has the necessary prerequisites installed, including Apache web server, PHP, and several other required packages.
2. Download Nagios Core: Download the latest version of Nagios Core from the official website and extract the files to a directory on your system.
3. Configure Nagios: Navigate to the extracted Nagios directory and configure the installation by running the following commands:
./configure --with-command-group=nagcmd
make all
sudo make install
4. Create Nagios User and Group: Create a new user and group for Nagios using the following commands:
sudo useradd nagios
sudo groupadd nagcmd
sudo usermod -a -G nagcmd nagios
sudo usermod -a -G nagcmd www-data
5. Install Nagios Plugins: Download and install Nagios Plugins, which are essential for monitoring services and hosts. Extract the plugins to the Nagios directory and run the following commands:
./configure --with-nagios-user=nagios --with-nagios-group=nagios
make
sudo make install
6. Configure Nagios Web Interface: Configure the Nagios web interface by modifying the Apache configuration file with the following lines:
ScriptAlias /nagios/cgi-bin /usr/local/nagios/sbin
<Directory "/usr/local/nagios/sbin">
   Options ExecCGI
   AllowOverride None
   Order allow,deny
   Allow from all
   AuthName "Nagios Access"
   AuthType Basic
   AuthUserFile /usr/local/nagios/etc/htpasswd.users
   Require valid-user
</Directory>
Alias /nagios /usr/local/nagios/share
<Directory "/usr/local/nagios/share">
   Options None
   AllowOverride None
   Order allow,deny
   Allow from all
   AuthName "Nagios Access"
   AuthType Basic
   AuthUserFile /usr/local/nagios/etc/htpasswd.users
   Require valid-user
</Directory>
7. Create Nagios Admin User: Create a new Nagios admin user with the following command:
sudo htpasswd -c /usr/local/nagios/etc/htpasswd.users nagiosadmin8. Restart Apache and Start Nagios: Restart Apache to apply the configuration changes and start Nagios by running the following command:
sudo service apache2 restart
sudo systemctl start nagios
Note: This is just a basic overview of the steps involved in deploying both these tools. The specific details may vary depending on your system and the systems and services you want to monitor. It is recommended to refer to the official documentation for more detailed instructions and best practices.
Prometheus vs. Nagios Comparison
Prometheus and Nagios are both popular open-source monitoring tools, but they have some significant differences in their design, features, and use cases. Here are some of the key differences between the two tools:
#1 Deployment and Installation
Prometheus uses a pull-based model where the Prometheus server pulls data from the targets using HTTP. This makes it easier to monitor dynamic environments where targets can come and go. Prometheus can be installed as a standalone binary, making it easy to get started quickly. Prometheus also provides pre-built Docker images for easy deployment.
Nagios uses a push-based model where agents (known as Nagios plugins) are installed on the systems being monitored, and they push data to the Nagios server. This can make Nagios more difficult to deploy in dynamic environments. Nagios requires more configuration and dependencies to be installed, such as the Nagios Core server and the Nagios plugins. This can make it more time-consuming to install and set up.
#2 Data Model
One of the most significant differences between the two tools is their data model. Nagios is primarily focused on monitoring individual services and hosts and sending alerts when they fail. Prometheus, on the other hand, is more oriented towards monitoring the performance and behavior of complex systems and applications over time, collecting metrics and logs data that can be queried and analyzed.
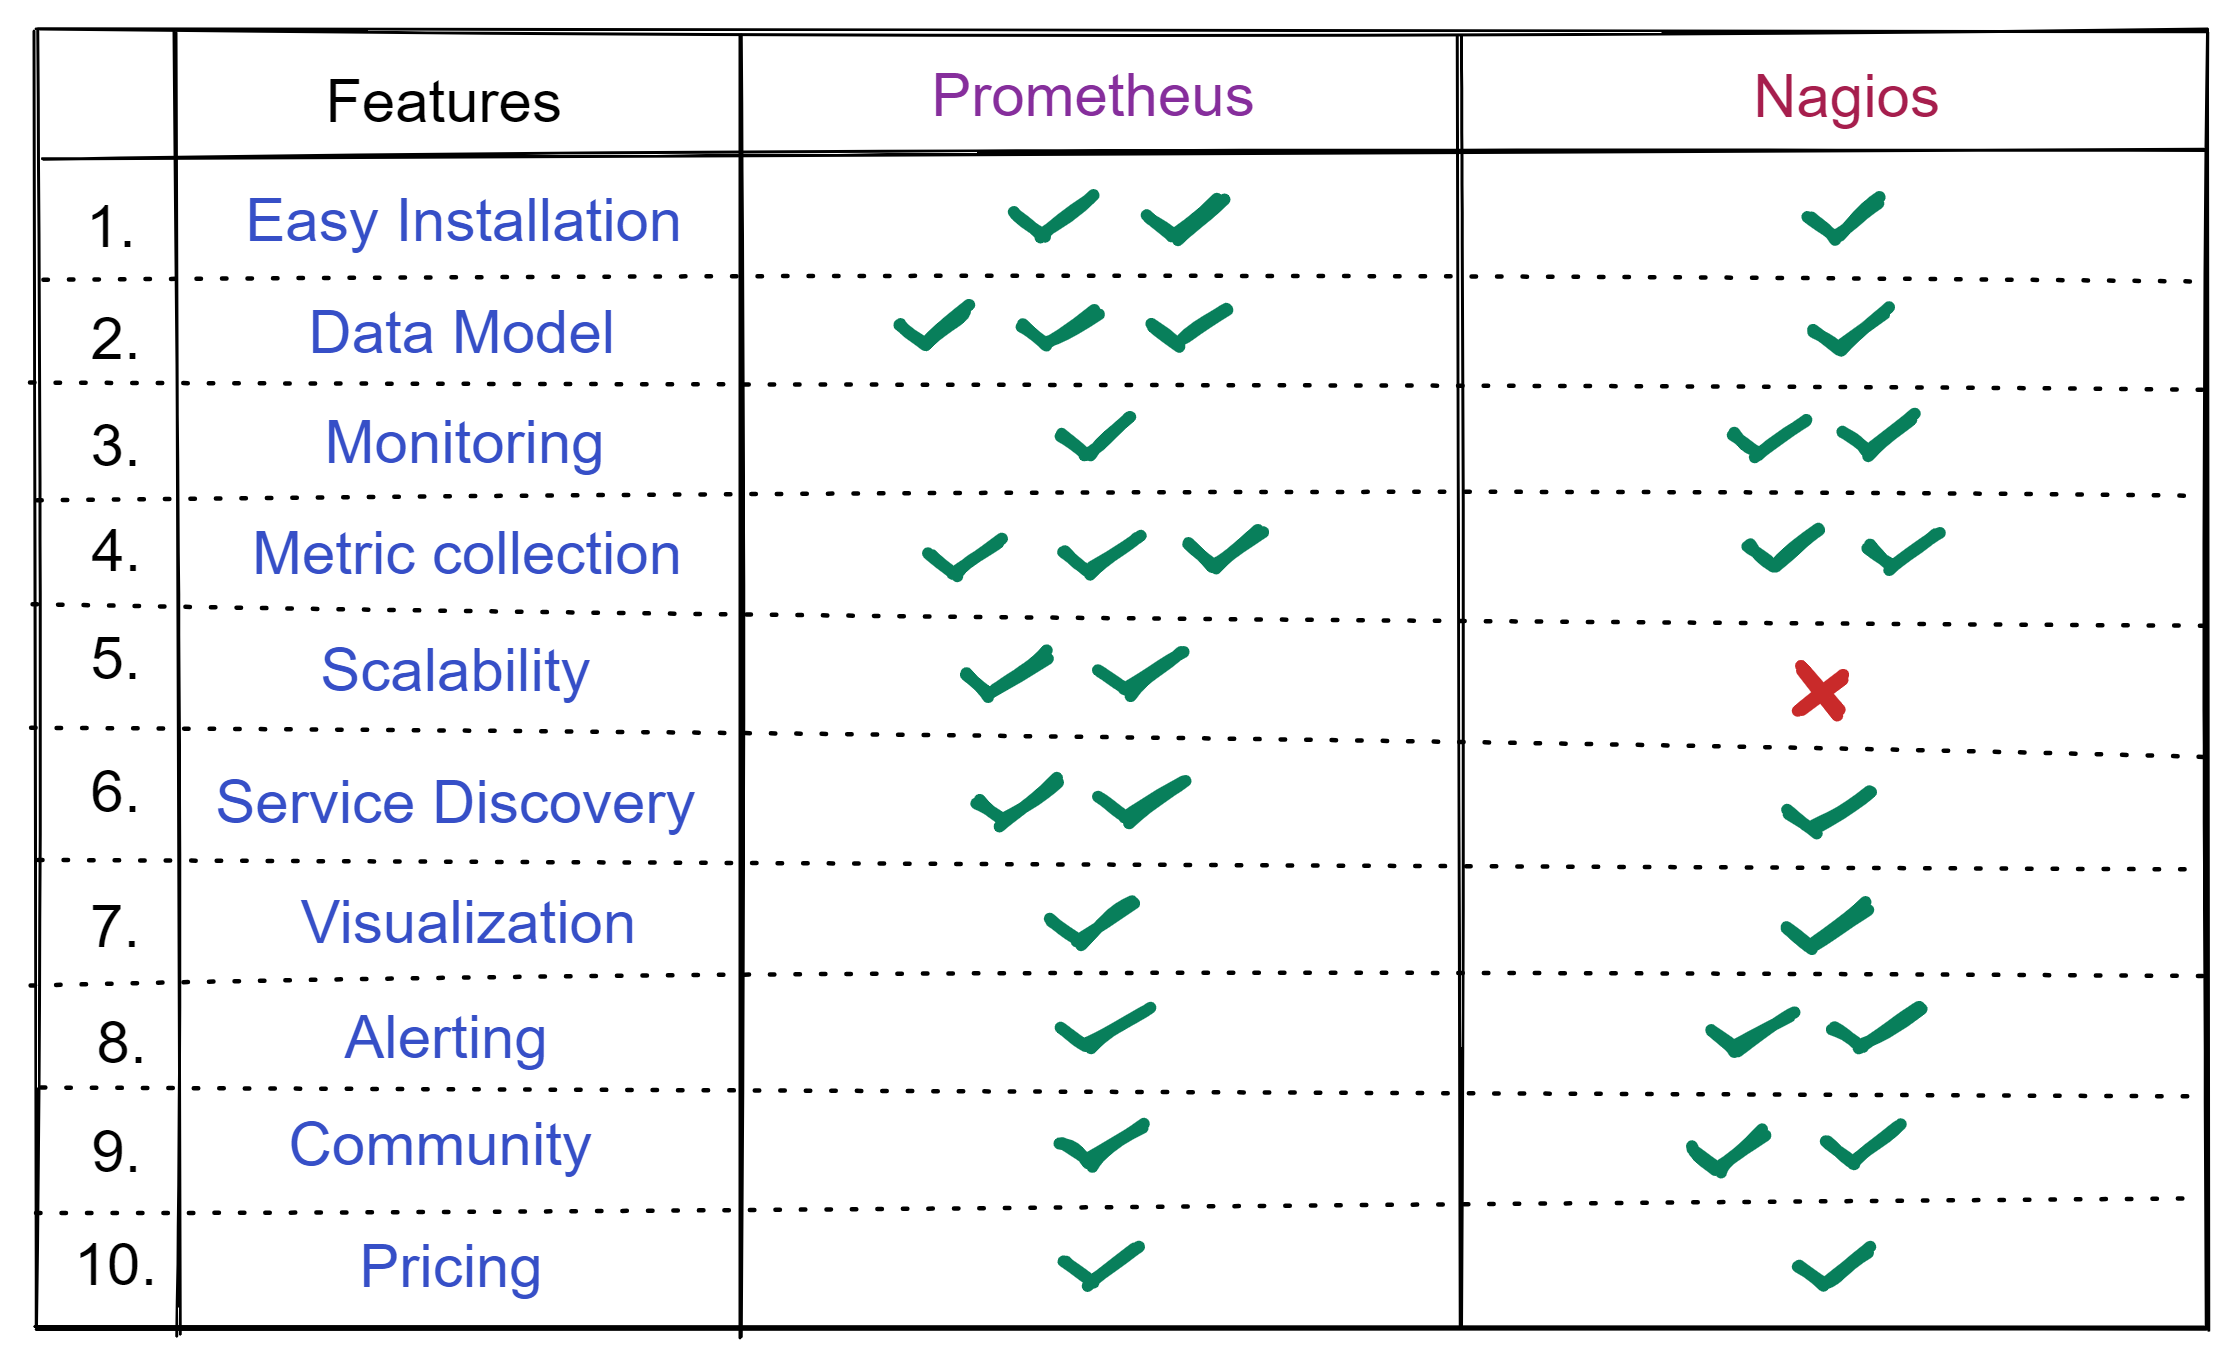
For example, Prometheus supports complex queries and aggregations that allow for advanced analysis of historical data, while Nagios is more limited in this regard.
#3 Monitoring Approach
Nagios uses an active monitoring approach where checks are performed at regular intervals to determine the state of services or hosts. Prometheus, on the other hand, uses a pull-based approach, where it periodically scrapes metrics from monitored services.
#4 Metrics Collection
Nagios requires different plugins when monitoring different services. For example, you need NRPE to obtain information from the host about CPU load, memory usage, and disk usage. Using the Nagios interface, you will be able to access the collected data as soon as you have installed the plugin and configured the host you wish to monitor.
With Prometheus' unique and powerful query language, PromQL, the systems can retrieve and aggregate time-series data from a multidimensional database in real time. You can then display the results as a graph or table, or use HTTP to send them to an external system.
#5 Scalability
Currently, Nagios is not keeping up with IT infrastructure. Companies and organizations often have to set up multiple Nagios servers for different types of infrastructure (agent) when a single server cannot handle the load, which introduces the downside of unable to view your entire infrastructure in one place. Prometheus on the other hand has a tool called Federation, which allows one Prometheus server to collect data from another through the /federate command.
#6 Service Discovery
Prometheus has built-in service discovery and automatic configuration capabilities, making it easy to monitor dynamic infrastructures. Nagios requires manual configuration of hosts and services, which can be time-consuming in dynamic environments.
#7 Visualization Capability
Nagios doesn't have an in-built visualization tools. But, NagVis plugin does the job. Meanwhile in Prometheus, the visualization feature although present, is really dull. You can only view one graph at a time. So, in terms of visualization capabilities, both don't seem to have an upper hand.
#8 Alerting
Nagios has a powerful alerting system that can send alerts via email, SMS, or other means when a service or host fails. Prometheus has a similar alerting system but is more focused on alerting based on defined thresholds or rules rather than simply when a service or host fails.
#9 Community and Ecosystem
Nagios has a large and active community of users and developers, with a vast library of plugins and extensions available. Prometheus has a smaller community but has gained significant traction in the container orchestration and cloud-native ecosystem.
#10 Pricing
Last but not the least, price decides the game! Both these tools are open-source, so you can freely install and use them. But Nagios provides Nagios XI is a paid version that provides much better functionality than the free version.
Here are some specific examples of how these differences can affect the use of each tool:
- In a large-scale environment with thousands of hosts and services, Prometheus's distributed architecture and sharding capabilities can make it easier to manage and scale the monitoring infrastructure.
- When monitoring complex systems that require advanced analysis of historical data, Prometheus's time-series database and query language provide more powerful capabilities than Nagios's flat file data storage and limited querying capabilities.
- For users who want to create rich and interactive dashboards for monitoring and analysis, Prometheus's integration with Grafana makes it easier to visualize data than Nagios's integration with third-party visualization tools.
- Nagios's support for custom plugins in any programming language can be useful for users who need to monitor non-standard systems or applications that are not natively supported by Prometheus.
Atatus - Comprehensive Alternative to Prometheus and Nagios
Atatus is a comprehensive monitoring solution that provides a complete observability platform for businesses. With Atatus, you can monitor and diagnose issues with your application, infrastructure, and user experience.
Advantages of Atatus Over Prometheus and Nagios:
- All-in-one platform: Atatus is a comprehensive observability platform that combines monitoring, tracing, and error reporting in one place, eliminating the need for separate tools for visualization.
- Easy installation and setup: Atatus offers easy installation and setup with minimal configuration, making it a more user-friendly alternative to Prometheus and Nagios.
- Real-time monitoring: Atatus provides real-time monitoring of your application performance, with the ability to identify and resolve issues quickly, improving your overall business efficiency.
- Auto-instrumentation: Atatus auto-instruments your application code without requiring any manual configuration, reducing the burden on developers.
- In-depth application insights: Atatus provides deep insights into your application performance, with the ability to trace every transaction end-to-end, from the user interface to the backend systems.
- Intelligent alerting: Atatus offers intelligent alerting with real-time anomaly detection and customizable alerts, allowing you to stay on top of issues before they impact your business.
- Cost-effective: Atatus offers flexible pricing plans based on the number of hosts and applications, making it a cost-effective alternative to Prometheus and Nagios.
Atatus Features
- Application Performance Monitoring: Atatus APM provides deep visibility into the performance of your application's components, including databases, third-party services, and other infrastructure components. It helps identify and resolve issues quickly before they impact your users.
- Real User Monitoring: Atatus provides real-time insights into the performance of web applications by capturing user interactions and measuring response times, page load times, and other critical metrics from the user's perspective.
- Infrastructure Monitoring: Atatus Infrastructure Monitoring provides real-time visibility into the health and performance of your servers, containers, and other infrastructure components. It helps you identify and resolve issues before they impact your users.
- Synthetic Monitoring: Atatus Synthetic Monitoring tests your applications from various locations and devices to simulate real-world user experiences. It helps ensure that your applications perform as expected and provides insights into how users experience your application from different parts of the world.
- Logs Monitoring: Atatus logs monitoring collects and analyzes logs from various sources, including applications, servers, and other infrastructure components. It helps identify real-time errors, performance issues, and other critical events.
- API Analytics: Atatus API Analytics provides insights into your API endpoints' usage, performance, and reliability. It helps you identify issues with your API and optimize its performance for your users.
Conclusion
In conclusion, Prometheus and Nagios are both popular tools for monitoring systems and applications. While Nagios has been around for a longer time and has a more established user base, Prometheus offers more advanced features and better scalability.
While Nagios may be more difficult to deploy and install than Prometheus, it has a larger library of plugins and a longer track record of use in the industry. Prometheus, on the other hand, has a more modern architecture that makes it easier to use in dynamic environments and is well-suited to monitoring containerized applications in a cloud-native environment.
Overall, both Prometheus and Nagios are powerful monitoring tools, but they have different strengths and weaknesses. Nagios is well-suited for monitoring traditional infrastructure, while Prometheus excels in monitoring dynamic cloud-native environments.
Ultimately, the choice between the two tools will depend on the specific needs and requirements of the organization.
#1 Solution for Logs, Traces & Metrics
![]() APM
APM
![]() Kubernetes
Kubernetes
![]() Logs
Logs
![]() Synthetics
Synthetics
![]() RUM
RUM
![]() Serverless
Serverless
![]() Security
Security
![]() More
More

![Splunk vs Prometheus: A Side-by-Side Comparison [2025 Guide]](/blog/content/images/size/w960/2024/08/Datadog-vs-sentry--13-.png)